. 1998 Feb 15;18(4):1280-96.
doi: 10.1523/JNEUROSCI.18-04-01280.1998.

Neuronal expression of zinc finger transcription factor REST/NRSF/XBR gene

Affiliations

Neuronal expression of zinc finger transcription factor REST/NRSF/XBR gene

K Palm et al. J Neurosci. .

Abstract

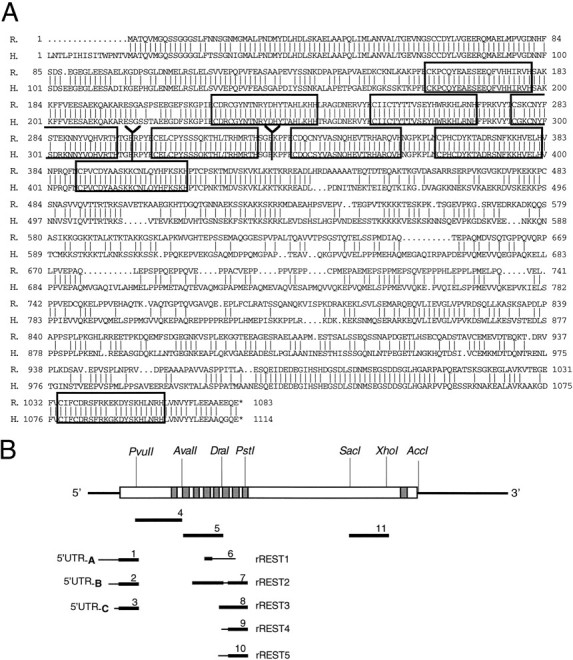
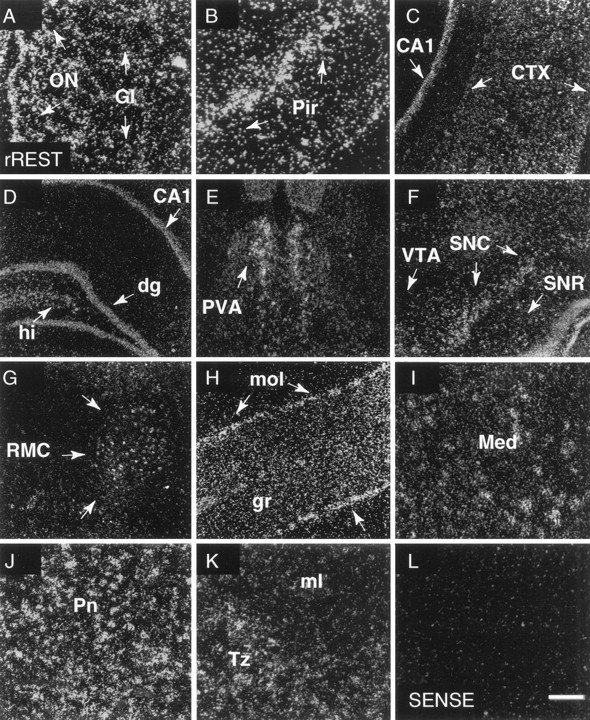
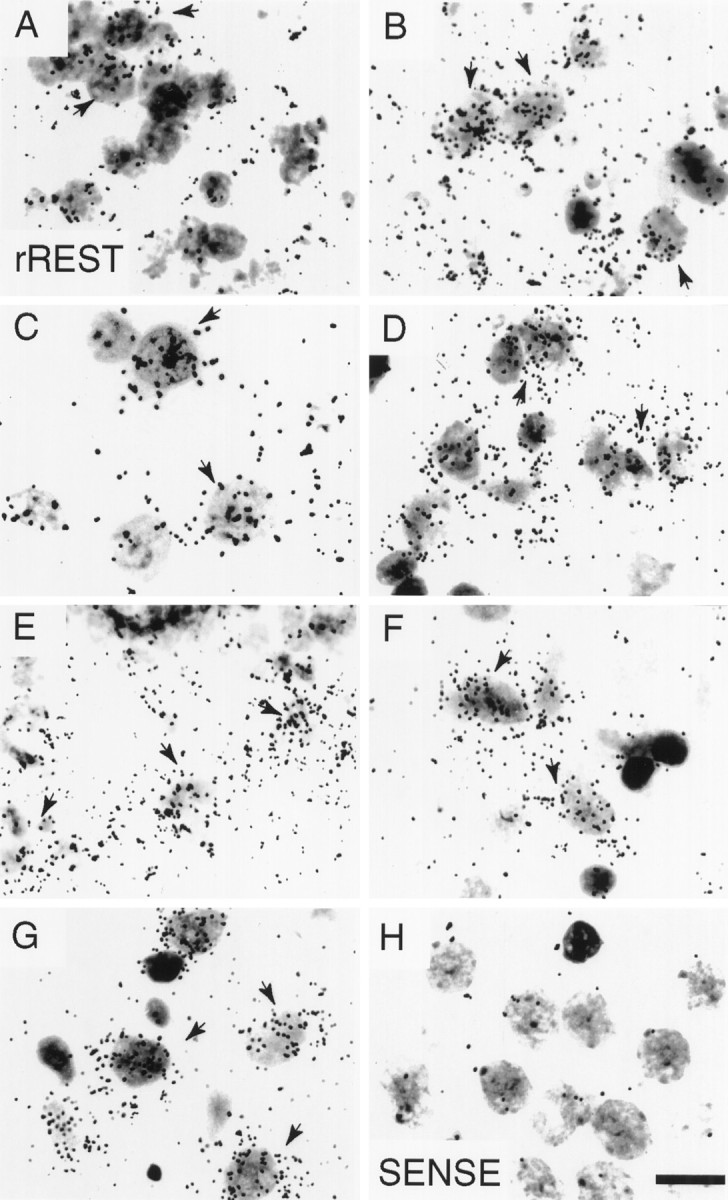
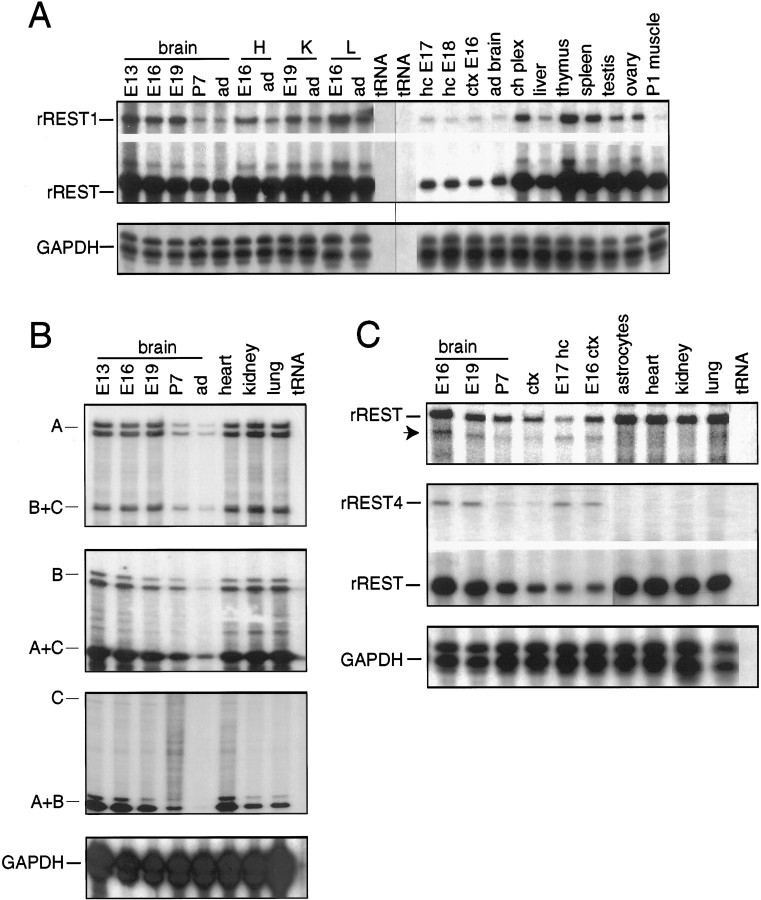
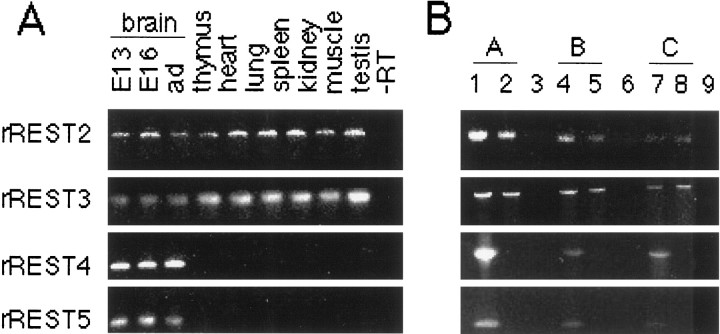
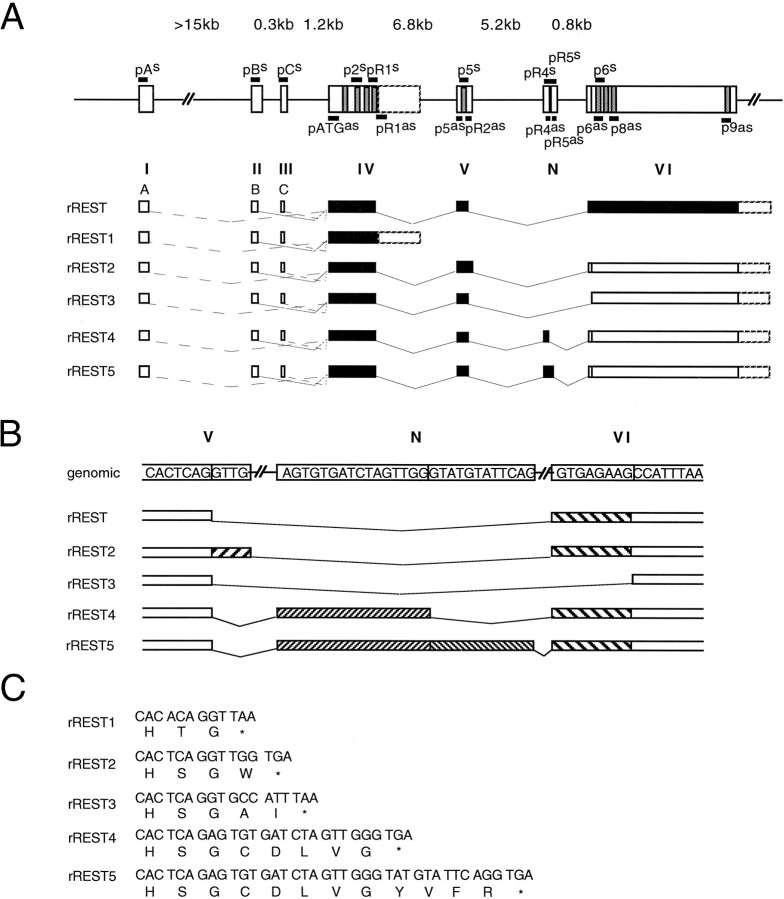
The identification of a common cis-acting silencer element, a neuron-restrictive silencer element (NRSE), in multiple neuron-specific genes, together with the finding that zinc finger transcription factor REST/NRSF/XBR could confer NRSE-mediated silencing in non-neuronal cells, suggested that REST/NRSF/XBR is a master negative regulator of neurogenesis. Here we show that, although REST/NRSF/XBR expression decreases during neuronal development, it proceeds in the adult nervous system. In situ hybridization analysis revealed neuronal expression of rat REST/NRSF/XBR mRNA in adult brain, with the highest levels in the neurons of hippocampus, pons/medulla, and midbrain. The glutamate analog kainic acid increased REST/NRSF/XBR mRNA levels in various hippocampal and cortical neurons in vivo, suggesting that REST/NRSF/XBR has a role in neuronal activity-implied processes. Several alternatively spliced REST/NRSF/XBR mRNAs encoding proteins with nine, five, or four zinc finger motifs are transcribed from REST/NRSF/XBR gene. Two of these transcripts are generated by neuron-specific splicing of a 28-bp-long exon. Rat REST/NRSF/XBR protein isoforms differ in their DNA binding specificities; however, all mediate repression in transient expression assays. Our data suggest that REST/NRSF/XBR is a negative regulator rather than a transcriptional silencer of neuronal gene expression and counteracts with positive regulators to modulate target gene expression quantitatively in different cell types, including neurons.


Figures

Fig. 1.
Fig. 1.
Primary structure of rREST cDNA and the predicted rREST protein. A, Optimized alignment of the rREST and human REST/NRSF/XBR amino acid sequences. Vertical linesindicate identical amino acid residues. Zinc fingers are boxed. Y marks the divergence of rREST from rREST1trunc and rREST2–5trunc. Stop codons are indicated by an asterisk.B, Schematic representation of rREST full-length cDNA encoding rREST protein with nine zinc finger motifs. Zinc finger motifs are shown as vertical gray bars. The long unfilled box indicates ORF. 5′- and 3′-UTR regions are indicated as thick lines. cRNA probes used in Southern analysis, RNase protection assays, and in situhybridization are shown below in relation to the rREST cDNA. Thin lines in the cRNA probes correspond to the unique parts of respective rREST transcripts. R., Rat;H., human. The nucleotide sequences of rREST cDNAs have been submitted to GenBank under accession numbers AF 037199, AF 037200, AF 037201, AF 037202, and AF 037203.
Fig. 2.
Fig. 2.
Northern blot analysis of rREST mRNA expression. Poly(A+) RNA (10 μg) isolated from the indicated rat brain regions, peripheral tissues, and rat C6 glioma cells was electrophoresed in the agarose gel, transferred to Hybond N+ filter, and hybridized to the rREST cDNA fragment covering the region between zinc finger motifs 2 and 8.A, rREST mRNA expression in various regions of adult rat brain and in rat C6 glioma cells. B, rREST mRNA expression in non-neuronal tissues (testis, spleen, and muscle) and during the development of brain and spinal cord. The position of rREST mRNA-specific signal and migration of 28S ribosomal RNA are indicated. Integrity of RNAs was checked by reprobing the blot with a GAPDH cDNA probe. C6, Rat C6 glioma cell line; str,striatum; thal, thalamus; p/m,pons/medulla; hc, hippocampus; cblm,cerebellum; v midbr, ventral midbrain;sept, septum; o bulb, olfactory bulb;ctx, cerebral cortex; coll, colliculi;spc, spinal cord; E, embryonic day;P, postnatal day; ad, adult.
Fig. 3.
Fig. 3.
In situ hybridization analysis of rREST mRNA expression in the adult rat brain. Shown are dark-field emulsion autoradiographs obtained after hybridization of coronal sections of adult rat brain with the [α-35S]-labeled rREST cRNA probe corresponding to the region upstream of zinc finger 9 (riboprobe 11; see Materials and Methods and Fig.1B). rREST mRNA-specific labeling is shown inA, olfactory bulb; B, piriform cortex;C, cerebral cortex; D, hippocampus;E, paraventricular nucleus of thalamus;F, ventral midbrain; G, red nucleus;H, cerebellar cortex; I, deep cerebellar nuclei; J, pontine nuclei; and K, nucleus trapezoid body. L, Section of brain area shown inH hybridized with sense RNA probe. Exposure time was 6 weeks. ON, Olfactory nerve layer; Gl, glomerular layer; Pir, piriform cortex;CTX, cerebral cortex; CA1, CA1 region of the hippocampus; dg, dentate gyrus of the hippocampus;hi, hilar region of the dentate gyrus;PVA, paraventricular thalamus nucleus anterior;VTA, ventral tegmental area; SNC, substantia nigra compacta;SNR, substantia nigra reticular; RMC, red nucleus magnocellular; mol and gr, molecular and granular layers of the cerebellar cortex;Med, medial cerebellar nucleus; Pn, pontine nuclei; Tz, nucleus trapezoid body;ml, medial lemniscus. Arrowheads inH indicate labeled cells along the border between the granular and molecular layers of cerebellar cortex. Scale bar: 200 μm in C, E, F, L; 100 μm in A, B, D, G, H, I–K.
Fig. 4.
Fig. 4.
Cellular localization of rREST mRNA in the adult rat brain by in situ hybridization. Shown are bright-field emulsion autoradiographs obtained after hybridization of coronal sections of adult rat brain with the [α-35S]-labeled rREST cRNA probe corresponding to the region upstream of zinc finger 9 (riboprobe 11; see Materials and Methods and Fig. 1B). Shown is rREST-specific labeling in the cells of the following: A, granular layer of olfactory bulb; B, dentate gyrus of hippocampus; C, cerebral cortex; D, CA1 pyramidal layer of hippocampus; E, along the border between the granular and molecular layers of the cerebellar cortex;F, gigantocellular reticular nucleus; andG, substantia nigra pars compacta. A section hybridized with the sense RNA probe is shown in H, corresponding to the brain area shown in F. Exposure time was 6 weeks.Arrows point to dense accumulations of silver grains over individual cells. Scale bar, 12 μm.
Fig. 5.
Fig. 5.
Analysis of rREST mRNA expression by RNase protection assay. A, Expression of rREST1 mRNA and all other rREST transcripts (denoted as rREST) in rat brain, in peripheral tissues, and in cultured hippocampal and cortical neurons. B, Expression of rREST transcripts with 5′-UTRs of type A (panel one),B (panel two), andC (panel three) during rat brain development and in peripheral tissues. C, Top panel, Expression of rREST transcripts exhibiting alternative splicing in the region spanning zinc fingers 5 and 6. Thearrow indicates the protected fragment that consists of a mixed population of transcripts rREST2, rREST3, rREST4, and rREST5.Middle panel, Expression of rREST4 mRNA, as compared with the expression of all other rREST transcripts (denoted asrREST). All bottom panels ofA, B, and C show the levels of GAPDH mRNA in the RNA samples that were analyzed. Total cellular RNA (20 μg in A and B; 40 μg in C) from each tissue or cultured primary neurons was analyzed by RPA. The cRNA probes that were used include the following (see Materials and Methods and Fig. 1B).A, rREST1 cDNA fragment encompassing zinc finger motifs 2–4 and the unique 3′-UTR of rREST1 cDNA (riboprobe 6).B, First panel, rREST cDNA fragment with type A (riboprobe 1); second panel, type B; third panel, type C (riboprobe 3) 5′-UTRs. C,First panel, rREST cDNA fragment spanning the region between zinc finger motifs 2 and 6 (riboprobe 5); second panel, rat REST4-specific cDNA fragment (riboprobe 9). Specific protected fragments are indicated on the left of each panel. E, Embryonic day; P, postnatal day; ad, adult; H, heart;K, kidney; L, lung; ctx,cerebral cortex; E17 hc, cultured hippocampal neurons;E16 ctx, cultured cortical neurons; ch plex, choroid plexus; astrocytes, cultured hippocampal astrocytes; tRNA, yeast tRNA as a negative control; B+C, mixed population of rREST transcripts with 5′-UTRs of types B and C; A+C, mixed population of rREST transcripts with 5′-UTRs of types A and C; A+B, mixed population of rREST transcripts with 5′-UTRs of types A and B.
Fig. 6.
Fig. 6.
RT-PCR analysis of the expression of rREST transcripts encoding truncated rREST protein isoforms with five zinc finger motifs. Shown are ethidium bromide stains of 2% agarose gels. Poly(A+) RNA (500 ng) was reverse-transcribed; 35 cycles of PCR amplification were performed in A, and 45 cycles were performed in B. Each lane contains one-fifth of the RT-PCR reaction. A, Expression of rREST2, rREST3, rREST4, and rREST5 mRNAs during rat brain development and in non-neuronal tissues. Note that rREST2 and rREST3 mRNA are expressed during brain development and in non-neuronal tissues, whereas expression of rREST4 and rREST5 mRNA is detected exclusively in the brain at different stages of development. RT-PCR analysis was performed by using primer sets specific to rREST2 mRNA (p2s–pR2as), rREST3 mRNA (p2s–pR3as), rREST4 mRNA (p2s–pR4as), and rREST5 mRNA (p2s–pR5as) (see also Materials and Methods and Fig. 8A). B, Expression of rREST2, rREST3, rREST4, and rREST5 mRNAs with different 5′-UTRs of type A (lanes 1–3), type B (lanes 4–6), and type C (lanes 7–9) in the brain (lanes 1, 4, 7) and thymus (lanes 2, 5, 8). Note that all of these truncated rREST transcripts exhibit no bias for any particular 5′-UTR sequence. RT-PCR analyses that were performed are not quantitative and show only the presence or absence of the rREST transcripts analyzed. Primer combinations that were used include the following (see also Materials and Methods and Fig. 8A): lanes 1–3,pAs in combination with pR2as, pR3as, pR4as, or pR5as; lanes 4–6,pBs in combination with pR2as, pR3as, pR4as, or pR5as; lanes 7–9,pCs in combination with pR2as, pR3as, pR4as, or pR5as. −RT in A andlanes 3, 6, and 9 in B are negative controls for which no cDNA was added to the PCR reaction.
Fig. 7.
Fig. 7.
Southern blot analysis of rREST gene. Rat genomic DNA was digested with the indicated restriction enzymes. Two identical filters were hybridized with probes corresponding to different regions of rREST cDNA. Left, Hybridization with the 460 bpPvuII/AvaII rREST cDNA fragment (riboprobe 4; see Materials and Methods) spanning the region encoding part of the N terminus up to the zinc finger 2 motif.Right, Hybridization with the 360 bpAvaII/DraI rREST cDNA fragment (riboprobe 5; see Materials and Methods) covering the region from the zinc finger 2 motif up to the zinc finger 6 motif. The detection of two genomic DNA fragments of different sizes in both lanes of the right panel indicates that at least one intron is present in the region encoding the N-terminal zinc finger cluster. The DNA molecular weight size markers (in kb) are indicated at left.
Fig. 8.
Fig. 8.
Structure of the rREST gene and alternative transcripts. A, The structural organization of rREST gene determined by PCR analysis of genomic DNA. Exons are shown asboxes, and introns are shown as lines. The numbers above the introns indicate their respective sizes. Short black bars with primer-specific identification symbols shown above orbelow the exons indicate the position of the sense or antisense primers used in PCR analyses. The putative extension of exon IV is shown with the dashed stroke. The vertical gray bars indicate zinc finger motifs. Exon numbers inbold Roman characters from I toVI are shown below the respective exons; the neural-specific exon located between exons V andVI is indicated as N. The schematic representation of rREST transcripts in relation to the gene is shownbelow the gene structure. Alternatively spliced rREST transcripts are shown. 5′-UTRs of types A, B, and C are indicated asopen boxes. Dashed lines and linesindicate the regions that are spliced out from the primary transcripts.Dashed lines also show the usage of alternative 5′-UTRs. 3′-UTRs are shown as open boxes with dashed strokes. The ORF of each rREST transcript is indicated as afilled box. B, Alternative splice sites for exons V, N, and VI. Exon sequences are given in capital letters and areboxed. Alternatively spliced sequences are indicated asstriped boxes. Lines indicate the regions that are spliced out of the primary transcript. rREST4 and rREST5 transcripts are the products of neuron-specific splicing with the insertion of either partial or entire exonN, shown as striped boxes between exonsV and VI. C, Partial alignment of rREST cDNAs in the region that follows zinc finger 4 (rREST1) or zinc finger 5 motif (rREST2–5), where the introduced termination codons lead to altered ORFs. The amino acid sequences of the predicted proteins are shown. The termination codons are indicated by anasterisk.
Fig. 9.
Fig. 9.
Expression of rREST mRNA in the hippocampus after kainic acid treatment. A, RPA of rREST1, rREST4, and rREST mRNA expression in the hippocampus at 2, 4, and 24 hr after KA-induced seizures. The amount of RNA used in RPA was 20 μg for rREST1 transcripts (riboprobe 6; see Materials and Methods and Fig.1B) and 40 μg for rREST4 transcripts (riboprobe 9; see Materials and Methods and Fig. 1B). Total RNA was isolated from the hippocampus of saline- or KA-treated animals. Protected fragments corresponding to rREST1, rREST4, rREST, and GAPDH mRNA are indicated. Saline treatment was performed for 2, 4, and 24 hr; no changes were detected in the expression levels of any of the rREST transcripts. B, Dark-field autoradiographs showing rREST mRNA-specific labeling in the adult rat brain at 4 and 24 hr after KA-induced seizures. Coronal sections were prepared at the level of dorsal hippocampus and hybridized with the rREST-specific cRNA probes (riboprobes 4 and 11; see Materials and Methods and Fig.1B). contr., Endogenous levels of corresponding rREST transcripts in hippocampus; saline,levels of rREST1, rREST4, and rREST transcripts 4 hr after saline treatment; KA, kainic acid; tRNA, yeast tRNA as a negative control; SENSE, section hybridized with the [α-35S]-labeled sense riboprobe;CP, choroid plexus; dg, dentate gyrus of the hippocampus; CTX, cerebral cortex;CA1, CA3, CA4, pyramidal layers CA1, CA3, and CA4 of the hippocampus.
Fig. 10.
Fig. 10.
Effects of rREST and rREST-truncated isoforms on pNRSEBDNFCAT promoter activity in Neuro-2A and C6 cells. A, rREST represses pNRSEBDNFCAT activity in a concentration-dependent manner. Transient transfection assays were performed in Neuro-2A cells, using 2 μg of pNRSEBDNFCAT and various amounts of plasmid encoding rREST protein, as indicated. Acetylated (Cm-3-Ac) and nonacetylated (Cm) forms of chloramphenicol are indicated on the left. CAT activity of pNRSEBDNFCAT in the presence of pcDNA3 alone was assigned a level of 100% activity. Repression (fold) is calculated as 100% ÷ CAT activity at a given plasmid concentration. Shown are the calculated values of one experiment; however, similar results were obtained in four independent experiments. B, Effects of rREST and rREST-truncated isoforms on pNRSEBDNFCAT activity. Shown is a schematic representation of rREST protein and the rREST-truncated isoforms; the last amino acid is indicated on the right, and the designation of the construct is shown on the left. Black boxes represent zinc fingers. The pNRSEBDNFCAT reporter plasmid was cotransfected with 15 μg of parental pcDNA3 or with 15 μg of recombinant expression vectors of rREST or rREST-truncated isoforms. In the table atright, the values denoting repression were calculated as described in A of this figure and represent averages of at least four independent experiments performed in triplicate. SEM is shown. C, Gel retardation assays showing the DNA binding activity of rREST isoforms (rREST1trunc andrREST2–5trunc), the deletion mutant with seven zinc fingers (rREST402D), and rREST protein to the wild-type palindromic NRSEbdnfsequence derived from the promoter II region of BDNF gene. The radiolabeled DNA fragment containing NRSEbdnf was incubated in the binding buffer with the in vitrotranslated protein products in the presence of the nonspecific competitor or 100-fold excess of the specific competitors, the unlabeled oligonucleotides corresponding to the upper (lane +11) or lower (lane +21) half site of NRSEbdnf. The DNA–protein complexes were resolved by native 5% PAGE electrophoresis. D, In vitro translation analyses of equimolar amounts of different rREST expression plasmids. [35S]methionine-labeled protein samples were analyzed by 12.5% SDS-PAGE electrophoresis. Molecular weight size standard markers are shown on theleft.

Similar articles

Cited by

References

    1. Abe H, Watanabe M, Yamakuni T, Kuwano R, Takahashi Y, Kondo H. Localization of gene expression of calbindin in the brain of adult rats. Neurosci Lett. 1992;138:211–215. - PubMed
    1. Barker PA, Lomen-Hoerth C, Gensch EM, Meakin S, Glass DJ, Shooter E. Tissue-specific alternative splicing generates two isoforms of the trkA receptor. J Biol Chem. 1993;268:15150–15157. - PubMed
    1. Belluardo N, Wu G, Mudo G, Hansson AC, Petterson R, Fuxe K. Comparative localization of fibroblast growth factor receptor -1, -2, and -3 mRNAs in the rat brain: in situ hybridization analysis. J Comp Neurol. 1997;379:226–246. - PubMed
    1. Ben-Ari Y, Represa A. Brief seizure episodes induce long-term potentiation and mossy fibre sprouting in the hippocampus. Trends Neurosci. 1990;13:375–403. - PubMed
    1. Benezra R, Davis RL, Lockshon D, Turner DL, Weintraub H. The proteins Id: a negative regulator of helix-loop-helix DNA binding proteins. Cell. 1990;61:49–59. - PubMed

Publication types

MeSH terms