Kinetics of CD4+ T cell repopulation of lymphoid tissues after treatment of HIV-1 infection
- PMID: 9448301
- PMCID: PMC18704
- DOI: 10.1073/pnas.95.3.1154
Kinetics of CD4+ T cell repopulation of lymphoid tissues after treatment of HIV-1 infection
Abstract
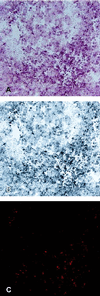
Potent combinations of antiretroviral drugs diminish the turnover of CD4+ T lymphocytes productively infected with HIV-1 and reduce the large pool of virions deposited in lymphoid tissue (LT). To determine to what extent suppression of viral replication and reduction in viral antigens in LT might lead correspondingly to repopulation of the immune system, we characterized CD4+ T lymphocyte populations in LT in which we previously had quantitated viral load and turnover of infected cells before and after treatment. We directly measured by quantitative image analysis changes in total CD4+ T cell counts, the CD45RA+ subset, and fractions of proliferating or apoptotic CD4+ T cells. Compared with normal controls, we documented decreased numbers of CD4+ T cells and increased proliferation and apoptosis. After treatment, proliferation returned to normal levels, and total CD4+ T and CD45RA+ cells increased. We discuss the effects of HIV-1 on this subset based on the concept that renewal mechanisms in the adult are operating at full capacity before infection and cannot meet the additional demand imposed by the loss of productively infected cells. The slow increases in the CD45RA+ CD4+ T cells are consistent with the optimistic conclusions that (i) renewal mechanisms have not been damaged irreparably even at relatively advanced stages of infection and (ii) CD4+ T cell populations can be partially restored by control of active replication without eradication of HIV-1.
Figures


Similar articles
-
Population biology of HIV-1 infection: viral and CD4+ T cell demographics and dynamics in lymphatic tissues.Annu Rev Immunol. 1999;17:625-56. doi: 10.1146/annurev.immunol.17.1.625. Annu Rev Immunol. 1999. PMID: 10358770 Review.
-
Immunoarchitecture of lymphoid tissue in HIV-infection during antiretroviral therapy correlates with viral persistence.Mod Pathol. 2005 Jan;18(1):127-36. doi: 10.1038/modpathol.3800267. Mod Pathol. 2005. PMID: 15389256
-
Severe CD4+ T-cell depletion in gut lymphoid tissue during primary human immunodeficiency virus type 1 infection and substantial delay in restoration following highly active antiretroviral therapy.J Virol. 2003 Nov;77(21):11708-17. doi: 10.1128/jvi.77.21.11708-11717.2003. J Virol. 2003. PMID: 14557656 Free PMC article.
-
Persistent abnormalities in lymphoid tissues of human immunodeficiency virus-infected patients successfully treated with highly active antiretroviral therapy.J Infect Dis. 2002 Oct 15;186(8):1092-7. doi: 10.1086/343802. Epub 2002 Sep 20. J Infect Dis. 2002. PMID: 12355359
-
Failure to reconstitute CD4+ T-cells despite suppression of HIV replication under HAART.AIDS Rev. 2006 Apr-Jun;8(2):88-97. AIDS Rev. 2006. PMID: 16848276 Review.
Cited by
-
How is the effectiveness of immune surveillance impacted by the spatial distribution of spreading infections?Philos Trans R Soc Lond B Biol Sci. 2015 Aug 19;370(1675):20140289. doi: 10.1098/rstb.2014.0289. Philos Trans R Soc Lond B Biol Sci. 2015. PMID: 26150655 Free PMC article.
-
Macrophages and their relevance in Human Immunodeficiency Virus Type I infection.Retrovirology. 2012 Oct 4;9:82. doi: 10.1186/1742-4690-9-82. Retrovirology. 2012. PMID: 23035819 Free PMC article. Review.
-
Antigen-driven CD4+ T cell and HIV-1 dynamics: residual viral replication under highly active antiretroviral therapy.Proc Natl Acad Sci U S A. 1999 Dec 21;96(26):15167-72. doi: 10.1073/pnas.96.26.15167. Proc Natl Acad Sci U S A. 1999. PMID: 10611356 Free PMC article.
-
Emerging concepts in gastrointestinal aspects of HIV-1 pathogenesis and management.Gastroenterology. 2001 Feb;120(3):607-21. doi: 10.1053/gast.2001.22427. Gastroenterology. 2001. PMID: 11179239 Free PMC article. Review.
-
The role of collagen deposition in depleting CD4+ T cells and limiting reconstitution in HIV-1 and SIV infections through damage to the secondary lymphoid organ niche.Semin Immunol. 2008 Jun;20(3):181-6. doi: 10.1016/j.smim.2008.04.002. Epub 2008 Jul 2. Semin Immunol. 2008. PMID: 18595731 Free PMC article. Review.
References
-
- Haase A T, Henry K, Zupancic M, Sedgewick G, Faust R A, Melroe H, Cavert W, Gebhard K, Staskus K, Zhang Z-Q, Dailey P J, Balfour H H, Jr, Erice A, Perelson A S. Science. 1996;274:985–989. - PubMed
-
- Cavert W, Notermans D W, Staskus K A, Wietgrefe S W, Zupancic M, Gebhard K, Henry K, Zhang Z, Mills R, McDade H, Schuwirth C, Goudsmit J, Danner S A, Haase A T. Science. 1997;276:960–964. - PubMed
-
- Fauci A S. Nature (London) 1996;384:529–534. - PubMed
-
- Giorgi J V. Immunology of HIV Infection. New York: Plenum; 1996.
-
- Lane H C, Depper J M, Greene W C, Whalen G, Waldmann T A, Fauci A S. N Engl J Med. 1985;313:79–84. - PubMed
Publication types
MeSH terms
Substances
Grants and funding
LinkOut - more resources
Full Text Sources
Other Literature Sources
Medical
Research Materials

