

Poly(A)-driven and poly(A)-assisted termination: two different modes of poly(A)-dependent transcription termination
- PMID: 9418875
- PMCID: PMC121491
- DOI: 10.1128/MCB.18.1.276
Poly(A)-driven and poly(A)-assisted termination: two different modes of poly(A)-dependent transcription termination
Abstract
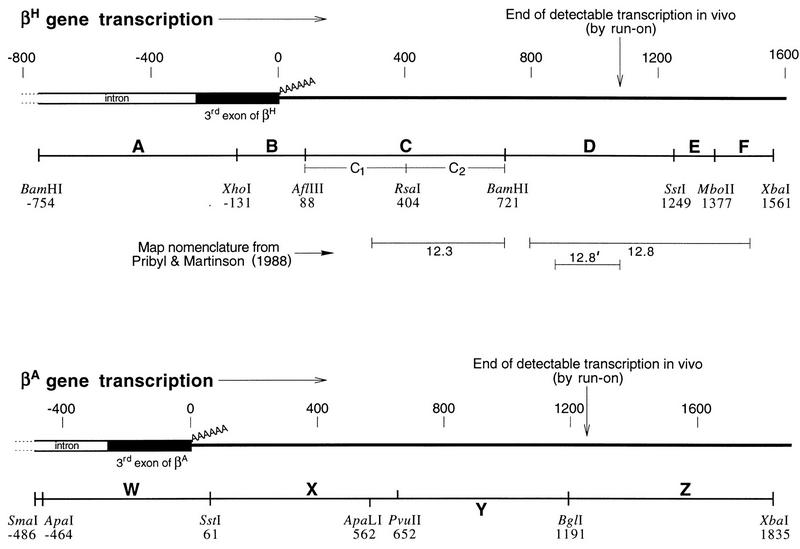
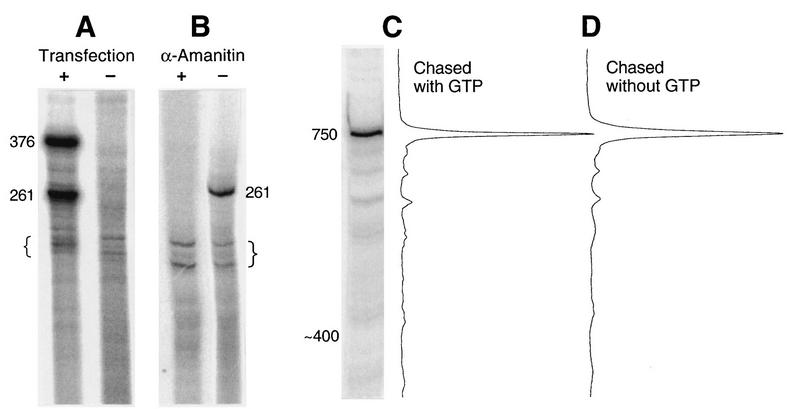
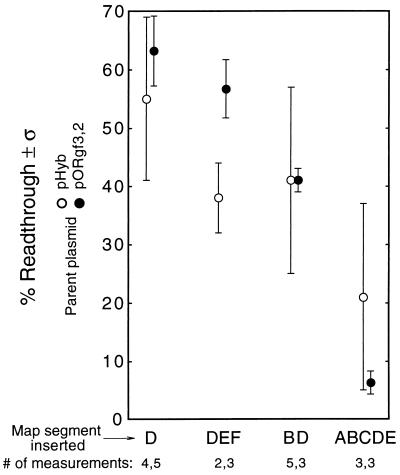
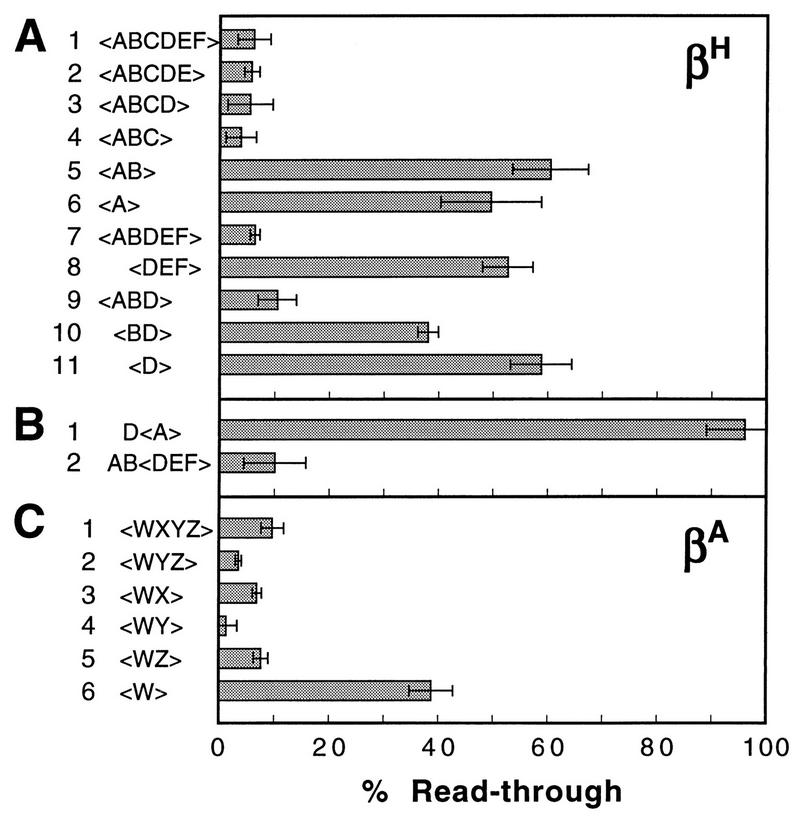
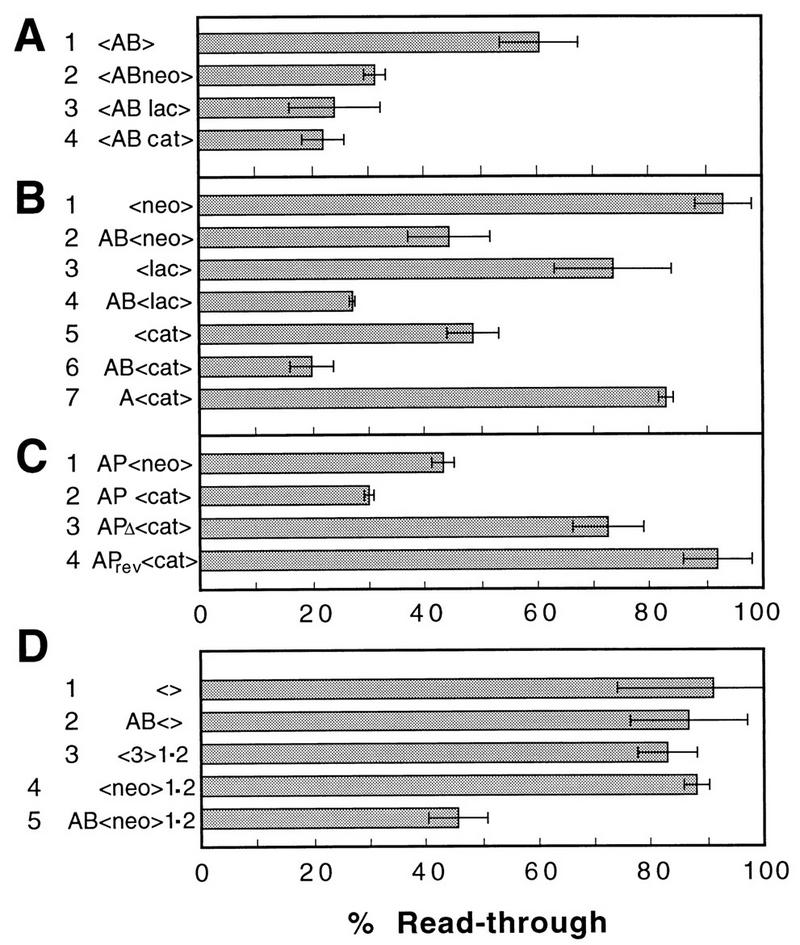
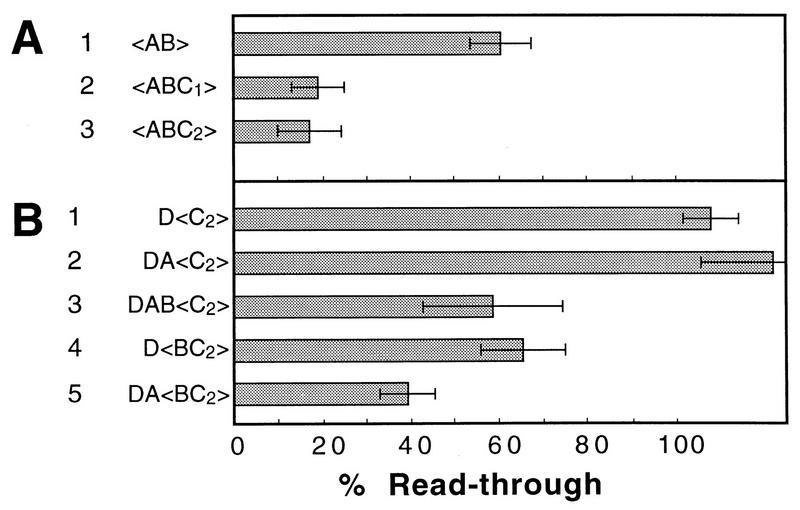
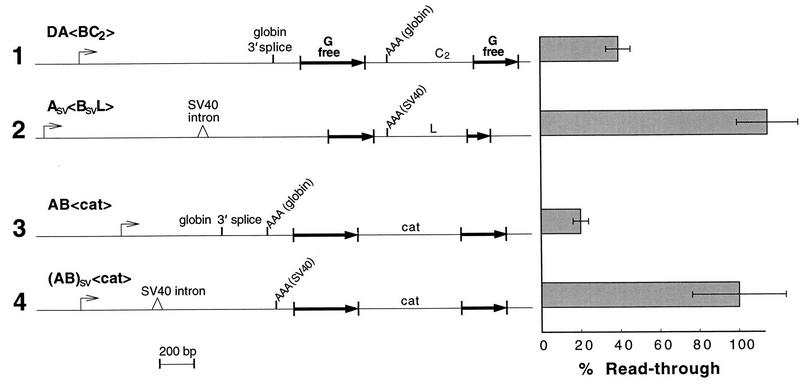
We mapped the elements that mediate termination of transcription downstream of the chicken betaH- and betaA-globin gene poly(A) sites. We found no unique element and no segment of 3'-flanking DNA to be significantly more effective than any other. When we replaced the native 3'-flanking DNA with bacterial DNA, it too supported transcription termination. Termination in the bacterial DNA depended on a functional poly(A) signal, which apparently compelled termination to occur in the downstream DNA with little regard for its sequence. We also studied premature termination by poorly processive polymerases close to the promoter. The rate of premature termination varied for different DNA sequences. However, the efficiencies of poly(A)-driven termination and promoter-proximal premature termination varied similarly on different DNAs, suggesting that poly(A)-driven termination functions by returning the transcription complex to a form which resembles a prior state of low processivity. The poly(A)-driven termination described here differs dramatically from the poly(A)-assisted termination previously described for the simian virus 40 (SV40) early transcription unit. In the SV40 early transcription unit, essentially no termination occurs downstream of the poly(A) site unless a special termination element is present. The difference between the betaH-globin and SV40 modes of termination is governed by sequences in the upstream DNA. For maximum efficiency, the betaH-globin poly(A) signal required the assistance of upstream enhancing sequences. Moreover, the SV40 early poly(A) signal also drove termination in betaH-globin style when it was placed in a betaH-globin sequence context. These studies were facilitated by a rapid, improved method of run-on transcription analysis, based on the use of a vector containing two G-free cassettes.
Figures

Similar articles
-
A poly(A) addition site and a downstream termination region are required for efficient cessation of transcription by RNA polymerase II in the mouse beta maj-globin gene.Proc Natl Acad Sci U S A. 1987 Dec;84(23):8306-10. doi: 10.1073/pnas.84.23.8306. Proc Natl Acad Sci U S A. 1987. PMID: 3479794 Free PMC article.
-
3' RNA processing efficiency plays a primary role in generating termination-competent RNA polymerase II elongation complexes.Mol Cell Biol. 1993 Jun;13(6):3472-80. doi: 10.1128/mcb.13.6.3472-3480.1993. Mol Cell Biol. 1993. PMID: 7684499 Free PMC article.
-
An apparent pause site in the transcription unit of the rabbit alpha-globin gene.J Mol Biol. 1991 Jul 20;220(2):255-70. doi: 10.1016/0022-2836(91)90011-t. J Mol Biol. 1991. PMID: 1856860
-
Characterization of the mouse beta maj globin transcription termination region: a spacing sequence is required between the poly(A) signal sequence and multiple downstream termination elements.Mol Cell Biol. 1993 Jan;13(1):578-87. doi: 10.1128/mcb.13.1.578-587.1993. Mol Cell Biol. 1993. PMID: 8417354 Free PMC article.
-
The poly(A) signal, without the assistance of any downstream element, directs RNA polymerase II to pause in vivo and then to release stochastically from the template.J Biol Chem. 2002 Nov 8;277(45):42899-911. doi: 10.1074/jbc.M207415200. Epub 2002 Aug 23. J Biol Chem. 2002. PMID: 12196547
Cited by
-
Poly(A) signal-dependent degradation of unprocessed nascent transcripts accompanies poly(A) signal-dependent transcriptional pausing in vitro.RNA. 2010 Jan;16(1):197-210. doi: 10.1261/rna.1622010. Epub 2009 Nov 19. RNA. 2010. PMID: 19926725 Free PMC article.
-
Ssu72 protein mediates both poly(A)-coupled and poly(A)-independent termination of RNA polymerase II transcription.Mol Cell Biol. 2003 Sep;23(18):6339-49. doi: 10.1128/MCB.23.18.6339-6349.2003. Mol Cell Biol. 2003. PMID: 12944462 Free PMC article.
-
A dual-light reporter system to determine the efficiency of protein-protein interactions in mammalian cells.Nucleic Acids Res. 2005 Apr 11;33(7):e66. doi: 10.1093/nar/gni066. Nucleic Acids Res. 2005. PMID: 15824058 Free PMC article.
-
The two steps of poly(A)-dependent termination, pausing and release, can be uncoupled by truncation of the RNA polymerase II carboxyl-terminal repeat domain.Mol Cell Biol. 2004 May;24(10):4092-103. doi: 10.1128/MCB.24.10.4092-4103.2004. Mol Cell Biol. 2004. PMID: 15121832 Free PMC article.
-
Local character of readthrough activation in adenovirus type 5 early region 1 transcription control.J Virol. 2003 Sep;77(17):9266-77. doi: 10.1128/jvi.77.17.9266-9277.2003. J Virol. 2003. PMID: 12915542 Free PMC article.
References
-
- Affolter M, Ruiz-Carrillo A. Transcription unit of the chicken histone H5 gene and mapping of H5 pre-mRNA sequences. J Biol Chem. 1986;261:11496–11502. - PubMed
-
- Ausubel F M, Brent R, Kingston R E, Moore D D, Seidman J G, Smith J A, Struhl K. Current protocols in molecular biology. New York, N.Y: Wiley & Sons; 1988.
Publication types
MeSH terms
Substances
Grants and funding
LinkOut - more resources
Full Text Sources
Other Literature Sources