. 1997 Aug 25;138(4):913-26.
doi: 10.1083/jcb.138.4.913.

Role of actin polymerization and adhesion to extracellular matrix in Rac- and Rho-induced cytoskeletal reorganization

Affiliations

Role of actin polymerization and adhesion to extracellular matrix in Rac- and Rho-induced cytoskeletal reorganization

L M Machesky et al. J Cell Biol. .

Abstract

Most animal cells use a combination of actin-myosin-based contraction and actin polymerization- based protrusion to control their shape and motility. The small GTPase Rho triggers the formation of contractile stress fibers and focal adhesion complexes (Ridley, A.J., and A. Hall. 1992. Cell. 70:389-399) while a close relative, Rac, induces lamellipodial protrusions and focal complexes in the lamellipodium (Nobes, C.D., and A. Hall. 1995. Cell. 81:53-62; Ridley, A.J., H.F. Paterson, C.L. Johnston, D. Diekmann, and A. Hall. 1992. Cell. 70:401-410); the Rho family of small GTPases may thus play an important role in regulating cell movement. Here we explore the roles of actin polymerization and extracellular matrix in Rho- and Rac-stimulated cytoskeletal changes. To examine the underlying mechanisms through which these GTPases control F-actin assembly, fluorescently labeled monomeric actin, Cy3-actin, was introduced into serum-starved Swiss 3T3 fibroblasts. Incorporation of Cy3- actin into lamellipodial protrusions is concomitant with F-actin assembly after activation of Rac, but Cy3-actin is not incorporated into stress fibers formed immediately after Rho activation. We conclude that Rac induces rapid actin polymerization in ruffles near the plasma membrane, whereas Rho induces stress fiber assembly primarily by the bundling of actin filaments. Activation of Rho or Rac also leads to the formation of integrin adhesion complexes. Integrin clustering is not required for the Rho-induced assembly of actin-myosin filament bundles, or for vinculin association with actin bundles, but is required for stress fiber formation. Integrin-dependent focal complex assembly is not required for the Rac-induced formation of lamellipodia or membrane ruffles. It appears, therefore, that the assembly of large integrin complexes is not required for most of the actin reorganization or cell morphology changes induced by Rac or Rho activation in Swiss 3T3 fibroblasts.


Figures

Figure 1
Figure 1
Quantitation of F-actin in cells responding to various stimuli. Bar graphs show the quantity of filamentous actin relative to serum-starved cells (defined as 1). Samples were taken at 5, 10, 20, and 60 min after addition of the stimulus and processed as described in Materials and Methods. (Black bars) Sphingosine-1-p treatment; (dark shaded bars) PDGF treatment; (light shaded bars) sphingosine-1-p + PDGF treatment; (white bars) serum treatment. F-actin was calculated by measuring fluorescence of extracted rhodamine phalloidin in a fluorometer as described. Error bars represent the standard deviation from at least six separate experiments per time point. Statistical analysis of the data using the t test with unequal variance showed means (μ) and confidence (expressed as percentage) as follows. Sphingosine-1-p: 5 min, μ = 1.10 (97%), 10 min, μ = 1.17 (>99%), 20 min, μ = 1.22 (>99%), 60 min, μ = 1.12 (98%); PDGF: 5 min, μ = 1.11 (92%), 10 min, μ = 1.24 (98%), 20 min, μ = 1.28 (94%), 60 min, μ = 1.20 (98%); sphingosine-1-p plus PDGF: 5 min, μ = 1.38 (>99%), 10 min, μ = 1.28 (>99%), 20 min, μ = 1.39 (99%), 60 min, μ = 1.26 (97%); serum: 5 min, μ = 1.43 (>99%), 10 min, μ = 1.37 (>99%), 20 min, μ = 1.37 (>99%), 60 min, μ = 1.43 (>99%). Confidence levels represent the confidence that each mean experimental value is different from the equivalent mean value for the control (starved cells) using the t test.
Figure 5
Figure 5
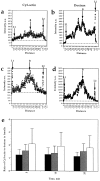
Quantitation of Cy3-actin in Rac or PDGF-induced lamellipodia. Serum-starved quiescent confluent Swiss 3T3 cells were treated under three different conditions: (a) injected with fluorescein dextran and Cy3-actin and incubated for 5, 10, or 20 min; (b) injected with fluorescein dextran and Cy3-actin and incubated for 5, 10, or 20 min in the presence of PDGF; and (c) injected with fluorescein dextran, constitutively active recombinant Rac protein, and Cy3-actin and incubated for 5, 10, or 20 min. The relative amount of Cy3-actin to fluorescein dextran concentrated in the lamellipodium of each cell was quantitated using a Hamamatsu C4880 cooled CCD camera. The fluorescence intensity profiles (for both the red and green fluorescence channels) of a line drawn across an entire starved cell 20 min after Cy3-actin and fluorescein dextran are shown in a and b. Intensity is in arbitrary units vs distance across the cell in arbitrary units, with ∼0.1 U = 5 μm. Similar profiles are shown in c and d for a starved cell 20 min after injection with constitutively active Rac, Cy3- actin, and fluorescein dextran. The peripheral lamellipodium was defined as the first (L1) or last (L2) peak of either dextran or actin fluorescence (see arrows in a–d). The wide peak in the middle of the cell is the cell body near the nucleus (B). Dashed lines in each graph indicate the background fluorescence of the substrate, which was subtracted from all peak heights. The bar graph in e shows a summary of the relative amount of Cy3-actin (to fluorescein dextran) concentrated in the lamellipodium averaged for at least 20 cells at each condition and time. (Black bars) Starved cells injected with Cy3-actin and fluorescein dextran. (Gray bars) Starved cells injected with Cy3-actin and fluorescein dextran and treated with PDGF. (White bars) Starved cells injected with Cy3-actin, fluorescein dextran, and constitutively active Rac protein. All values obtained for Rac-induced accumulation of Cy3-actin were significantly different from the mean values for the starved cells to >99.5% confidence using the t test assuming unequal variance among the samples. For the PDGF-treated cells, the data at 5 min were significantly different from the starved cells with 97% confidence, the data at 10 min were significantly different with 77% confidence, and the data at 20 min were significantly different with 99% confidence.
Figure 2
Figure 2
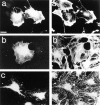
Examples of the cellular response to stimuli used in the quantitation of F-actin experiments. All photos show rhodamine phalloidin labeling of Swiss 3T3 cells taken directly from the F-actin quantitation of Fig. 1. (a) Typical serum-starved Swiss 3T3 cells, which are devoid of stress fibers or ruffles. (b and c) Cells after 20 and 60 min of PDGF stimulation, respectively. (d–f) 5, 20, and 60 min, respectively, after stimulation with sphingosine-1-p. (g–i) 5, 20, and 60 min, respectively, after addition of 10% serum. (j–l) 5, 20, and 60 min after addition of a mixture of both PDGF and sphingosine-1-p. Bar, 10 μm.
Figure 3
Figure 3
Cy3-actin polymerization is influenced by Rac and Rho activation states. Swiss 3T3 cells growing in 10% serum (a, a′, b, and b′) or serum starved overnight (c and c′) were microinjected with Cy3-actin and inhibitors of Rho (C3-transferase; a and a′) or Rac (recombinant dominant negative Rac protein; b and b′). At 20 min after injection, cells were fixed, Cy3-actin was visualized directly (a–c), and fluorescein phalloidin costaining was used (a′–c′) to show total F-actin. Bar, 5 μm.
Figure 4
Figure 4
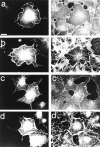
Incorporation of Cy3-actin into ruffling lamellipodia induced by activation of Rac. Serum-starved confluent quiescent Swiss 3T3 cells were microinjected with Cy3-actin and constitutively active Rac protein (a, a′, b, and b′) or treated with PDGF (c, c′, d, and d′). At 5 min (a, a′, c, and c′) or 20 min (b, b′, d, and d′) cells were fixed and costained with fluorescein phaloidin to visualize total F-actin. (a–d) Cy3-actin; (a′–d′) fluorescein phalloidin costain of total F-actin. Bar, 5 μm.
Figure 6
Figure 6
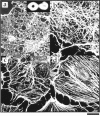
Time course of formation of stress fibers upon Rho activation with sphingosine-1-p. Serum-starved confluent quiescent Swiss 3T3 cells were examined by confocal microscopy to determine the organization of filamentous actin stained with rhodamine phalloidin (a–d). (a) Filamentous actin in starved cells; arrow in a points to rings of filamentous actin seen only in starved cells. (Inset) Two rings enlarged an additional 20 times. (b) Filamentous actin at 5 min after sphingosine-1-p addition. (c) Filamentous actin at 20 min after sphingosine-1-p addition. (d) Filamentous actin at 60 min after addition of sphingosine-1-p. Bar, 5 μm.
Figure 7
Figure 7
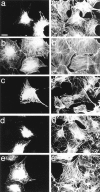
Time course of incorporation of Cy3-actin into stress fibers induced by Rho activation. Serum-starved confluent quiescent Swiss 3T3 cells were treated in two ways to cause Rho activation: either injection of Cy3-actin and then addition of sphingosine-1-p (a, a′, b, b′, c, and c′), or coinjection of Cy3-actin with dominant active Rho protein (d, d′, e, and e′). Cells were counterstained with fluorescein phalloidin (a′–e′) to compare total filamentous actin to injected Cy3-actin (a–e). (a and a′) Cells injected for 5 min with Cy3-actin and then treated for 5 min with sphingosine-1-p; (b and b′) Cells injected for 5 min with Cy3-actin and then treated for 20 min with sphingosine-1-p; (c and c′) Cells injected for 5 min with Cy3-actin and then treated for 40 min with sphingosine-1-p; (d and d′) Cells injected with Rho protein and Cy3-actin for 5 min and then incubated for 10 min; (d and d′) Cells injected with Rho protein and Cy3-actin for 5 min and then incubated for 20 min. Bar, 5 μm.
Figure 8
Figure 8
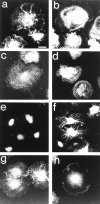
Response of cells plated on poly-l-lysine to Rho activation. Serum-starved quiescent Swiss 3T3 cells were trypsinized and plated onto poly-l-lysine (10 μg/ml)–coated coverslips for 20 min before addition of sphingosine-1-p for 20 min (b, d, f, and h) or mock treatment with serum-free medium for 20 min (a, c, e, and g). Cells were then fixed and stained for filamentous actin (a and b), myosin-II light chain (c and d), vinculin (e and f), or talin (g and h). Bar, 5 μm.
Figure 9
Figure 9
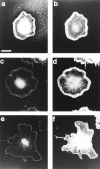
Response of cells plated on poly-l-lysine to Rac activation. Serum-starved quiescent Swiss 3T3 cells were trypsinized and plated onto poly-l-lysine (10 μg/ ml)–coated coverslips for 20 min (a–d) or fibronectin-coated coverslips for 2 h (e and f). (a) Cy3- actin fluorescence in a cell 20 min after comicroinjection of Cy3- actin and L61 Rac protein. (b) Counterstain of the same cell with fluorescein phalloidin. (c) The distribution of vinculin in a cell treated for 20 min with PDGF and counterstained with rhodamine phalloidin (d). (e) Vinculin in normal focal complexes formed after PDGF treatment for 20 min. (f) Rhodamine phalloidin counterstain of the same cell. Bar, 5 μm.

Similar articles

Cited by

References

    1. Bershadsky A, Chausovsky A, Becker E, Lyubimova A, Geiger B. Involvement of microtubules in the control of adhesion-dependent signal transduction. Curr Biol. 1996;6:1279–1289. - PubMed
    1. Bretcher MS. Getting membrane flow and the cytoskeleton to cooperate in moving cells. Cell. 1996;87:601–606. - PubMed
    1. Burridge K, Fath K. Focal contacts: transmembrane links between the extracellular matrix and the cytoskeleton. Bioessays. 1989;10:104–108. - PubMed
    1. Burridge K, Fath K, Kelly T, Nuckolls G, Turner C. Focal Adhesions: transmembrane junctions between the extracellular matrix and the cytoskeleton. Annu Rev Cell Biol. 1988;4:487–525. - PubMed
    1. Burridge K, Nuckolls G, Otey C, Pavalko F, Simon K, Turner C. Actin membrane interaction in focal adhesions. Cell Differ Dev. 1990;32:337–342. - PubMed

Publication types

MeSH terms