

Apoptosis resistance of nonobese diabetic peripheral lymphocytes linked to the Idd5 diabetes susceptibility region
- PMID: 9238035
- PMCID: PMC23070
- DOI: 10.1073/pnas.94.16.8670
Apoptosis resistance of nonobese diabetic peripheral lymphocytes linked to the Idd5 diabetes susceptibility region
Abstract
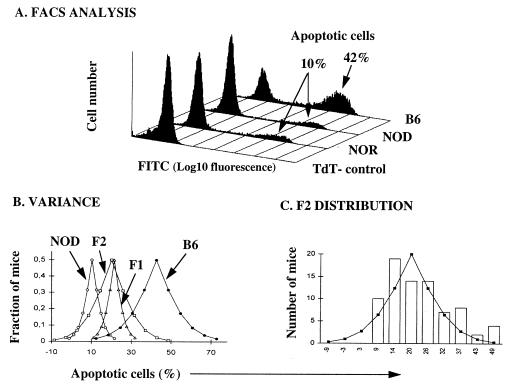
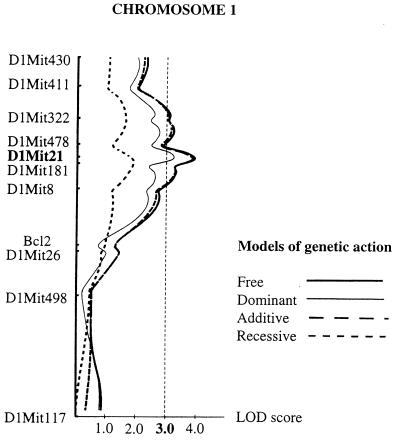
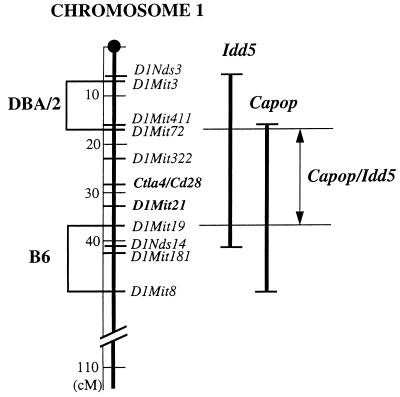
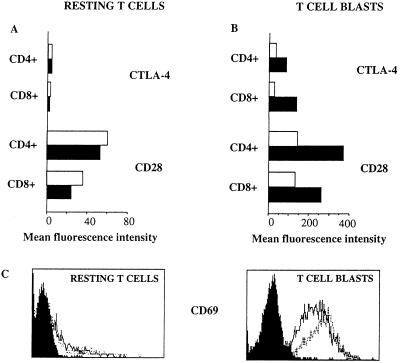
Defects in lymphocyte apoptosis may lead to autoimmune disorders and contribute to the pathogenesis of type 1 diabetes. Lymphocytes of nonobese diabetic (NOD) mice, an animal model of autoimmune diabetes, have been found resistant to various apoptosis signals, including the alkylating drug cyclophosphamide. Using an F2 intercross between the apoptosis-resistant NOD mouse and the apoptosis-susceptible C57BL/6 mouse, we define a major locus controlling the apoptosis-resistance phenotype and demonstrate its linkage (logarithm of odds score = 3.9) to a group of medial markers on chromosome 1. The newly defined gene cannot be dissociated from Ctla4 and Cd28 and in fact marks a 20-centimorgan region encompassing Idd5, a previously postulated diabetes susceptibility locus. Interestingly, we find that the CTLA-4 (cytotoxic T lymphocyte-associated antigen 4) and the CD28 costimulatory molecules are defectively expressed in NOD mice, suggesting that one or both of these molecules may be involved in the control of apoptosis resistance and, in turn, in diabetes susceptibility.
Figures
Similar articles
-
The diabetes susceptibility locus Idd5.1 on mouse chromosome 1 regulates ICOS expression and modulates murine experimental autoimmune encephalomyelitis.J Immunol. 2004 Jul 1;173(1):157-63. doi: 10.4049/jimmunol.173.1.157. J Immunol. 2004. PMID: 15210770
-
Further mapping of the Idd5.1 locus for autoimmune diabetes in NOD mice.Diabetes. 2001 Dec;50(12):2874-8. doi: 10.2337/diabetes.50.12.2874. Diabetes. 2001. PMID: 11723074
-
Fine mapping, gene content, comparative sequencing, and expression analyses support Ctla4 and Nramp1 as candidates for Idd5.1 and Idd5.2 in the nonobese diabetic mouse.J Immunol. 2004 Jul 1;173(1):164-73. doi: 10.4049/jimmunol.173.1.164. J Immunol. 2004. PMID: 15210771
-
Genetic control of autoimmune diabetes in the NOD mouse.Annu Rev Immunol. 1995;13:179-200. doi: 10.1146/annurev.iy.13.040195.001143. Annu Rev Immunol. 1995. PMID: 7612220 Review.
-
Mouse models of type 1 and type 2 diabetes derived from the same closed colony: genetic susceptibility shared between two types of diabetes.ILAR J. 2004;45(3):268-77. doi: 10.1093/ilar.45.3.268. ILAR J. 2004. PMID: 15229374 Review.
Cited by
-
Chronic oscillating glucose challenges disarrange innate immune homeostasis to potentiate the variation of neutrophil-lymphocyte ratio in rats with or without hidden diabetes mellitus.Diabetes Metab Syndr Obes. 2018 Jun 13;11:277-288. doi: 10.2147/DMSO.S160301. eCollection 2018. Diabetes Metab Syndr Obes. 2018. PMID: 29942142 Free PMC article.
-
A locus on chromosome 1 promotes susceptibility of experimental autoimmune myocarditis and lymphocyte cell death.Clin Immunol. 2009 Jan;130(1):74-82. doi: 10.1016/j.clim.2008.06.015. Epub 2008 Oct 31. Clin Immunol. 2009. PMID: 18951849 Free PMC article.
-
Vitamin D Actions on CD4(+) T Cells in Autoimmune Disease.Front Immunol. 2015 Mar 18;6:100. doi: 10.3389/fimmu.2015.00100. eCollection 2015. Front Immunol. 2015. PMID: 25852682 Free PMC article. Review.
-
Fas-independent death of activated CD4(+) T lymphocytes induced by CTLA-4 crosslinking.Proc Natl Acad Sci U S A. 1998 Aug 18;95(17):10083-8. doi: 10.1073/pnas.95.17.10083. Proc Natl Acad Sci U S A. 1998. PMID: 9707604 Free PMC article.
-
CTLA-4-Ig activates forkhead transcription factors and protects dendritic cells from oxidative stress in nonobese diabetic mice.J Exp Med. 2004 Oct 18;200(8):1051-62. doi: 10.1084/jem.20040942. J Exp Med. 2004. PMID: 15492127 Free PMC article.
References
-
- Kisielow P, von Boehmer H. Adv Immunol. 1995;58:87–209. - PubMed
-
- Cohen J J, Duke R C, Fadok V A, Sellins K S. Annu Rev Immunol. 1992;10:267–293. - PubMed
-
- Castano L, Eisenbarth G S. Annu Rev Immunol. 1991;8:647–679. - PubMed
-
- Vyse T J, Todd J A. Cell. 1996;85:311–318. - PubMed
-
- Wicker L S, Todd J A, Peterson L B. Annu Rev Immunol. 1995;13:179–200. - PubMed
Publication types
MeSH terms
LinkOut - more resources
Full Text Sources
Medical
Miscellaneous
