. 1997 Jul 28;138(2):363-74.
doi: 10.1083/jcb.138.2.363.

Regulation of actin polymerization in cell-free systems by GTPgammaS and Cdc42

Affiliations

Regulation of actin polymerization in cell-free systems by GTPgammaS and Cdc42

S H Zigmond et al. J Cell Biol. .

Abstract

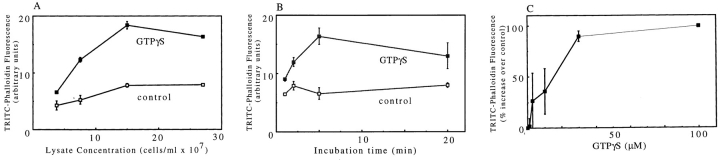
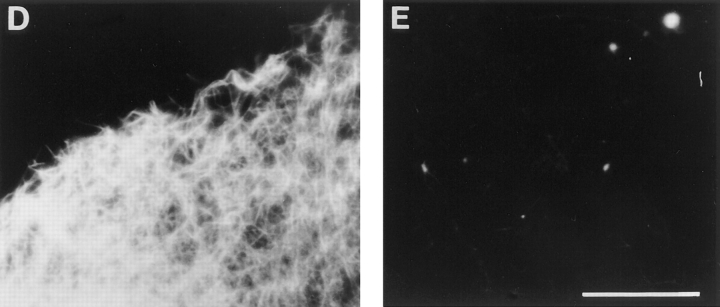
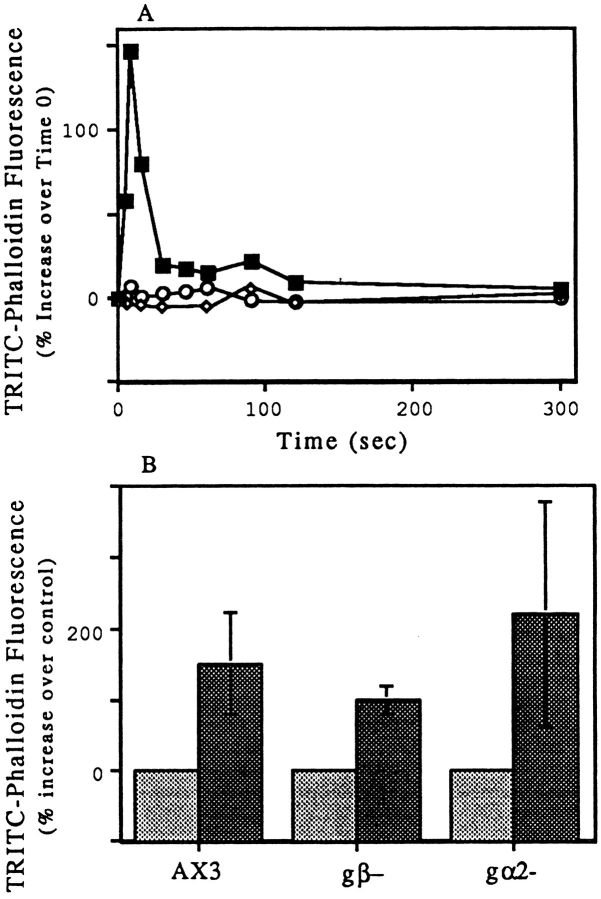
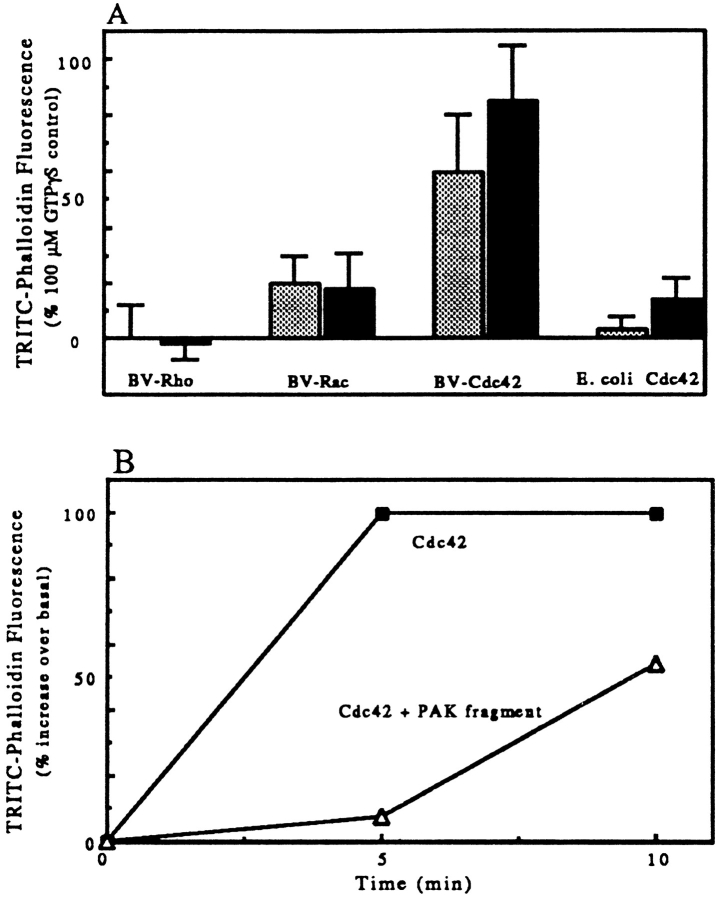
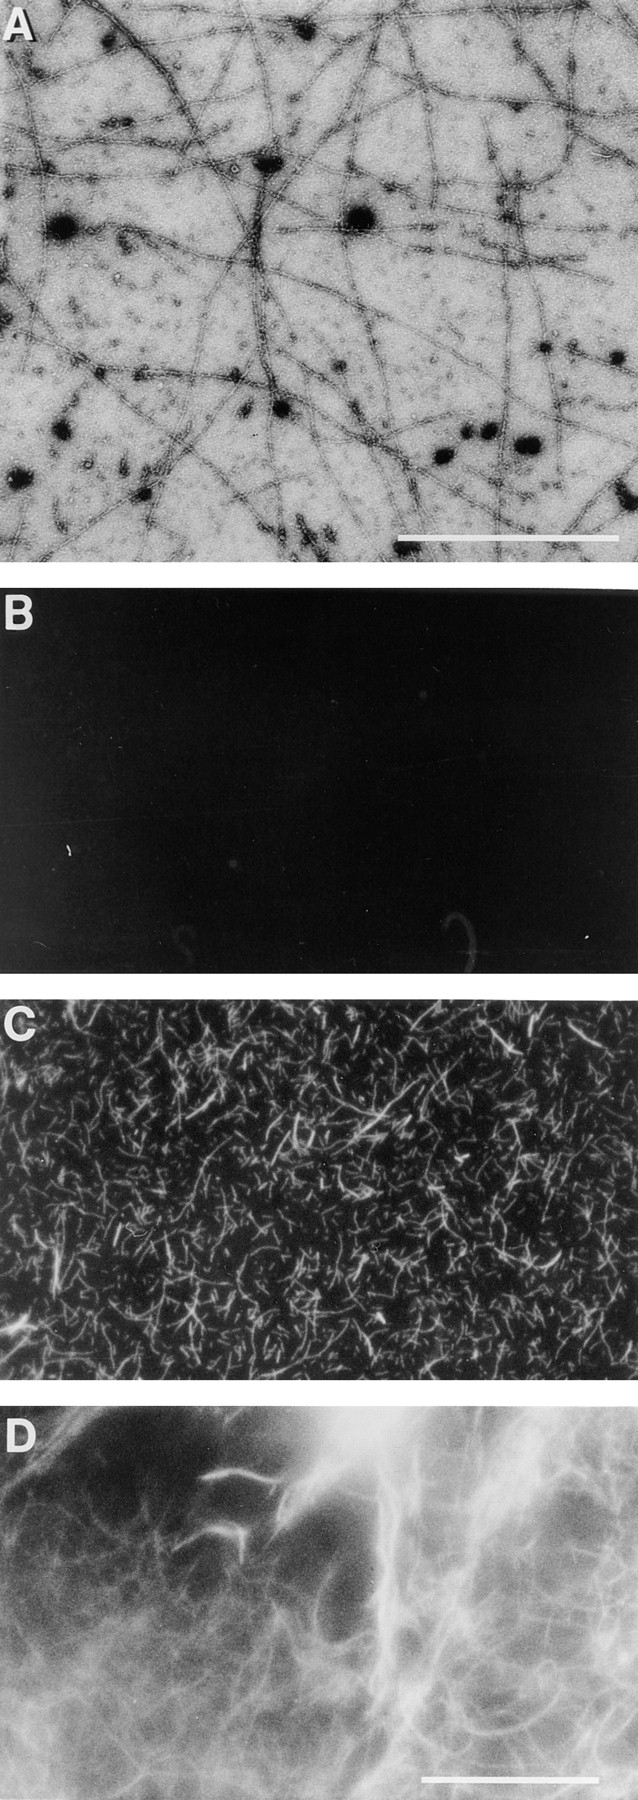
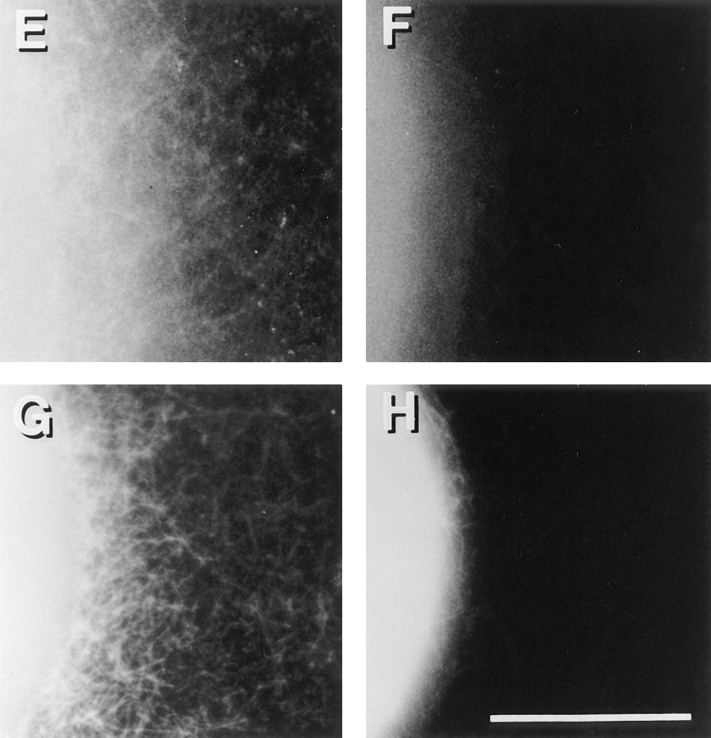
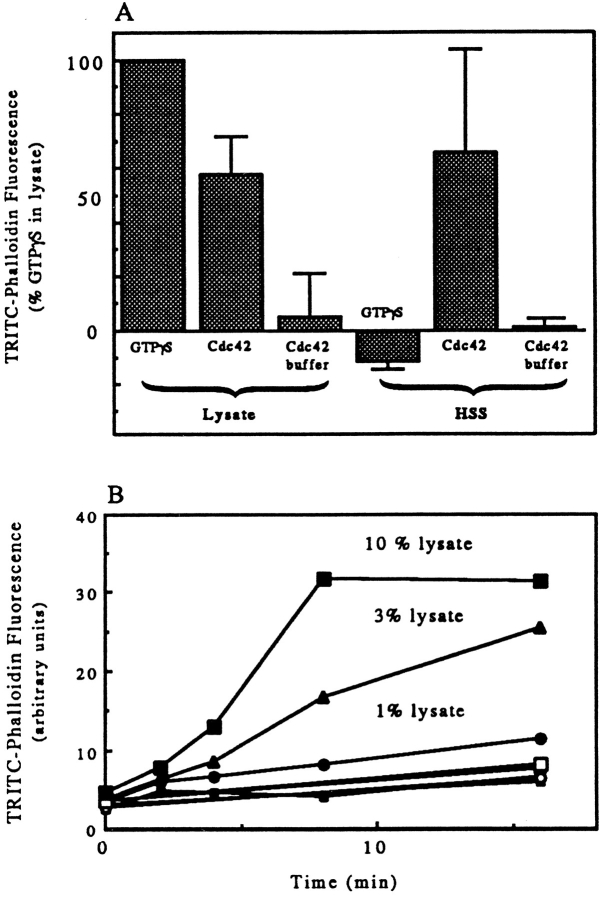
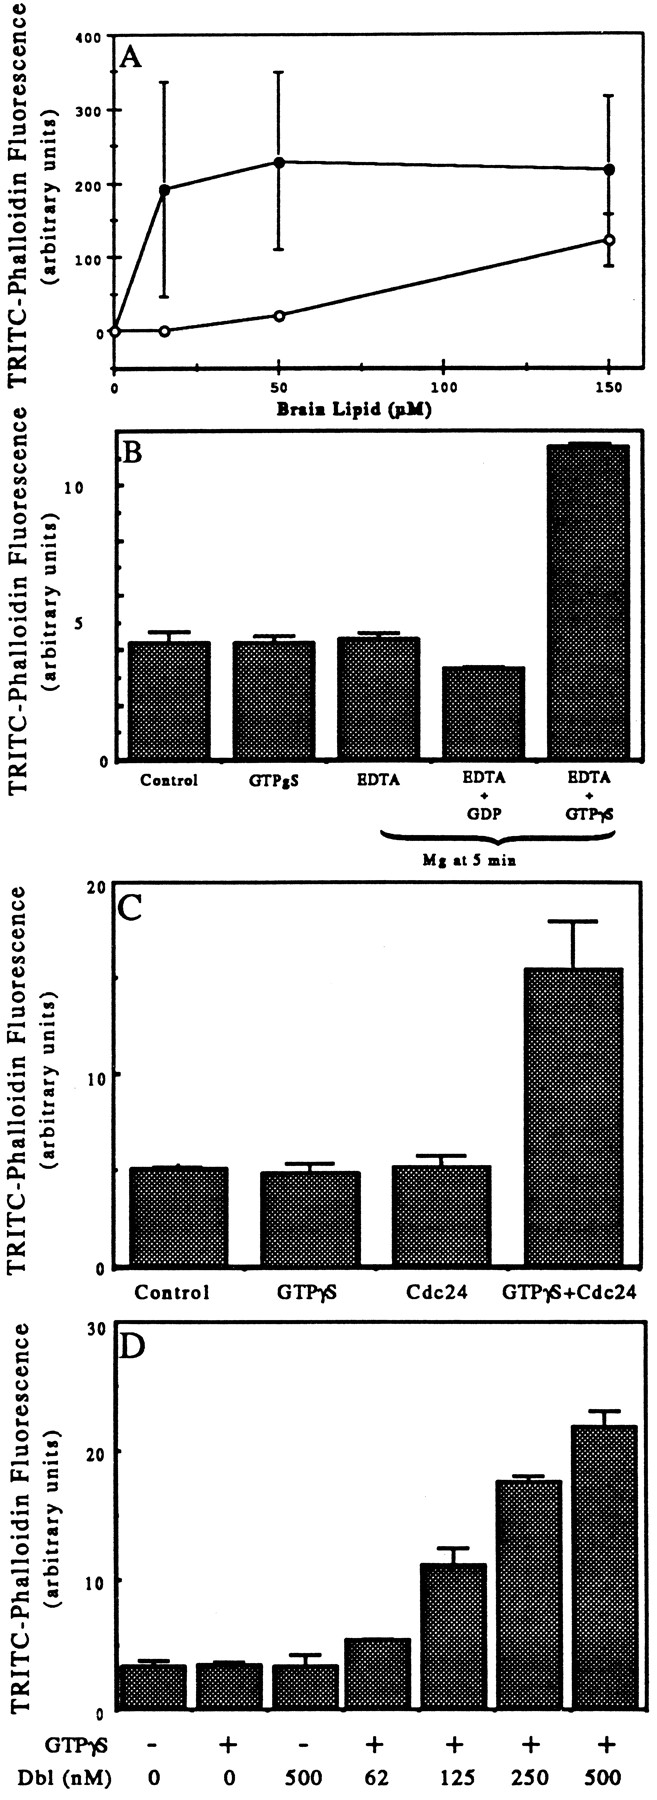
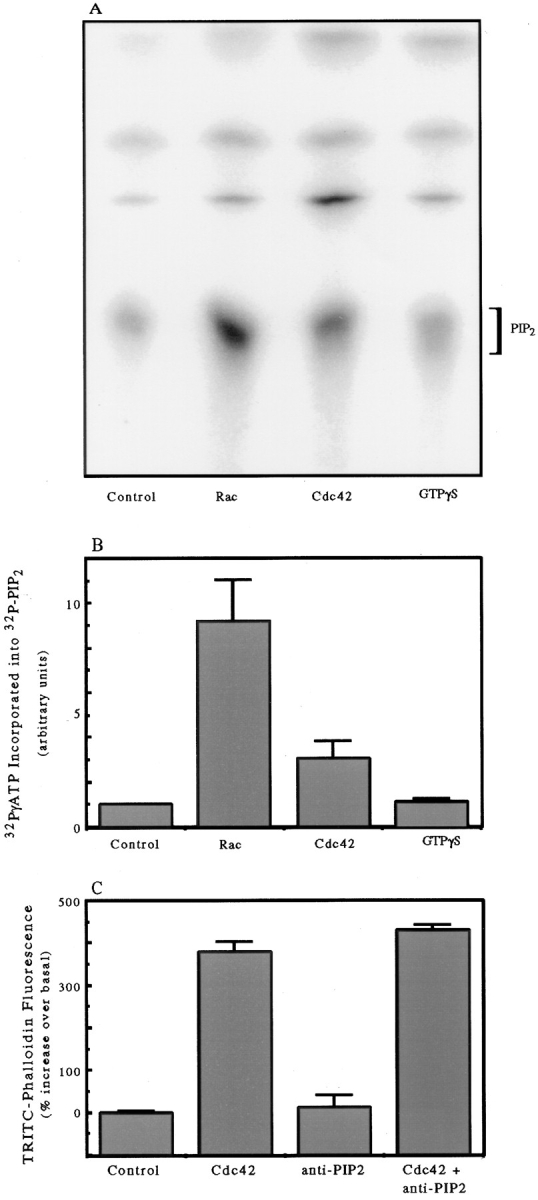
We have established a cell-free system to investigate pathways that regulate actin polymerization. Addition of GTPgammaS to lysates of polymorphonuclear leukocytes (PMNs) or Dictyostelium discoideum amoeba induced formation of filamentous actin. The GTPgammaS appeared to act via a small G-protein, since it was active in lysates ofD. discoideum mutants missing either the alpha2- or beta-subunit of the heterotrimeric G-protein required for chemoattractant-induced actin polymerization in living cells. Furthermore, recombinant Cdc42, but not Rho or Rac, induced polymerization in the cell-free system. The Cdc42-induced increase in filamentous actin required GTPgammaS binding and was inhibited by a fragment of the enzyme PAK1 that binds Cdc42. In a high speed supernatant, GTPgammaS alone was ineffective, but GTPgammaS-loaded Cdc42 induced actin polymerization, suggesting that the response was limited by guanine nucleotide exchange. Stimulating exchange by chelating magnesium, by adding acidic phospholipids, or by adding the exchange factors Cdc24 or Dbl restored the ability of GTPgammaS to induce polymerization. The stimulation of actin polymerization did not correlate with PIP2 synthesis.


Figures

Figure 1
Figure 1
(A) Actin polymerization as function of lysate concentration in cell equivalents/ml. PMNs were bombed at 3 × 10⁸ cells/ml; the lysate was diluted to concentrations of 28, 15, 8, and 4 × 10⁷ cell equivalents/ml and warmed for 6 min with (closed squares) or without (open squares) 100 μM GTPγS. The samples were then diluted ∼17-fold into TRITC–phalloidin, stained for 1 h before spinning at 80,000 rpm for 20 min in a tabletop ultracentrifuge (Beckman). The TRITC–phalloidin in the pellet (6 × 10⁶ cell equivalents/pellet) was extracted with MeOH overnight and the fluorescence read at ex = 540 nm; em = 575 nm. Data presented are duplicates of an experiment (error bars are the individual values) representative of three experiments. (B) Time course of actin polymerization in lysate. PMN lysates at 3 × 10⁸ cell equivalents/ml were warmed for various times with (closed squares) or without (open squares) 100 μM GTPγS before processing as described in A. The experimental data are the means of four experiments (with up to seven individual values). (C) Concentration dependence of GTPγS. PMN lysates at 3 × 10⁸ cell equivalents/ml were warmed for 3 to 5 min in various concentrations of GTPγS and then processed as described in A. Data are means ±SEM compiled from at least four experiments: n = 4 (1 μM), 5 (3 μM), 7 (10 μM), 5 (30 μM), and 7 (100 μM) normalized relative to the unstimulated control. (D and E) Actin filaments induced by GTPγS and stained with TRITC–phalloidin. LSS of neutrophil lysates were incubated at room temperature for 5 min with 100 μM GTPγS (D) or without GTPγS (E) and then stained with TRITC–phalloidin and observed in a fluorescent microscope. Bar, 10 μm.
Figure 1
Figure 1
(A) Actin polymerization as function of lysate concentration in cell equivalents/ml. PMNs were bombed at 3 × 10⁸ cells/ml; the lysate was diluted to concentrations of 28, 15, 8, and 4 × 10⁷ cell equivalents/ml and warmed for 6 min with (closed squares) or without (open squares) 100 μM GTPγS. The samples were then diluted ∼17-fold into TRITC–phalloidin, stained for 1 h before spinning at 80,000 rpm for 20 min in a tabletop ultracentrifuge (Beckman). The TRITC–phalloidin in the pellet (6 × 10⁶ cell equivalents/pellet) was extracted with MeOH overnight and the fluorescence read at ex = 540 nm; em = 575 nm. Data presented are duplicates of an experiment (error bars are the individual values) representative of three experiments. (B) Time course of actin polymerization in lysate. PMN lysates at 3 × 10⁸ cell equivalents/ml were warmed for various times with (closed squares) or without (open squares) 100 μM GTPγS before processing as described in A. The experimental data are the means of four experiments (with up to seven individual values). (C) Concentration dependence of GTPγS. PMN lysates at 3 × 10⁸ cell equivalents/ml were warmed for 3 to 5 min in various concentrations of GTPγS and then processed as described in A. Data are means ±SEM compiled from at least four experiments: n = 4 (1 μM), 5 (3 μM), 7 (10 μM), 5 (30 μM), and 7 (100 μM) normalized relative to the unstimulated control. (D and E) Actin filaments induced by GTPγS and stained with TRITC–phalloidin. LSS of neutrophil lysates were incubated at room temperature for 5 min with 100 μM GTPγS (D) or without GTPγS (E) and then stained with TRITC–phalloidin and observed in a fluorescent microscope. Bar, 10 μm.
Figure 2
Figure 2
F-actin responses of D. discoideum mutants lacking the β or α2 subunits of the trimeric G-protein, Gα2. (A) The F-actin in intact cells was determined by TRITC–phalloidin staining of amoeba fixed at various times after stimulation with 2 nM cAMP. Cell lines tested were wild type, AX3 (closed squares); Gβ− minus, LW14 (open diamonds); and Gα2−, JM1 (open circles). The data were normalized relative to the F-actin level at t = 0. (B) Lysates from wild type and mutants stimulated with GTPγS. Lysates of cell lines tested in A were stimulated with 100 μM GTPγS, and the F-actin level present was determined as described in Materials and Methods. The F-actin level in each extract without GTPγS was used to normalize the data (grey bars). The mean GTPγS-induced F-actin (dark bars) and standard deviation (error bars) is shown for 8 experiments with AX3, 3 experiments with LW14 (−) and 11 experiments with JM1 (Gα2 ). Data for cells stimulated for 2 through 10 min were pooled for this figure, since separate experiments showed the F-actin levels were maximal after about 2 min and were maintained for at least 10 min.
Figure 3
Figure 3
Recombinant Cdc42-induced actin polymerization. (A) Time course of polymerization as a function of Cdc42 concentration. Various concentrations of GTPγS-charged Cdc42, 0 (open circles), 25 (closed triangles), 50 (closed circles), or 100 nM Cdc42 (closed squares) were incubated with an HSS of PMN lysate for 2, 4, or 6 min before stopping with TRITC–phalloidin and processing samples. Data shown are from a single experiment representative of three. (B) Extent of polymerization as a function of Cdc42 concentration. Various concentrations of GTPγS-charged Cdc42 (closed triangles) or the GTPγS associated with 100 nM Cdc42 (open triangle) were incubated with the LSS of PMN lysates for 10 min. The samples were processed as described in Fig. 1 A. The data represent the means and SD of two experiments normalized by setting the increase in staining induced by 100 μM GTPγS to 100% (GTPγS-induced increase was 160% over basal in both experiments). (C) Cdc42 and GTPγs increase the rate of pyrenyl-actin polymerization. Lysates (1.5 × 10⁸ cells/ ml) were warmed for 5 min with buffer (Control), 100 μM GTPγS, or GTPγS-charged 100 nM Cdc42 before dilution (200-fold) into 2 mM pyrenyl-G-actin in polymerization buffer. The change in pyrene fluorescence representing polymerization of the pyrene actin was followed over time. The data shown are representative samples. In this experiment, the initial rate of polymerization (determined between 2 and 6 min) for duplicate samples was increased 2-fold by GTPγS and 2.3-fold by Cdc42.
Figure 4
Figure 4
(A) The induction of actin polymerization was unique to Cdc42, other Rho family members were inactive. PMN lysates were warmed for 3 to 5 min with GTPγS-charged baculovirus-expressed Cdc42 (50 nM light bar; 100 nM dark bar); baculovirus-expressed Rho (80 nM, light bar; 200 nM, dark bar); baculovirus-expressed Rac1 (50 nM light bar; 100 dark bar); and E. coli-expressed V12Cdc42 (50 nM, light bar; 100 nM, dark bar). Increasing Rho or Rac to 200 nM or E. coli-expressed Cdc42 to 1 μM did not result in increased phalloidin staining. The samples were processed as in Fig. 1 A. The data represent at least two experiments with each construct. To pool data between experiments, we normalized by expressing the staining induced by a given G-protein to the increase in that experiment induced by 100 μM GTPγS (GTPγS-induced increase over basal was: mean, 97%; range, 67 to 130%, n = 14). Error bars represent the range of values. (B) The Rac and Cdc42 binding fragment of PAK inhibits actin polymerization induced by Cdc42. LSS of PMN lysates were warmed for 5 or 10 min with GTPγS-charged Cdc42 (100 nM) in the absence (closed squares) or presence of 1 μM PAK fragment (open diamonds). The samples were processed as above. The data are from one experiment, representative of three.
Figure 5
Figure 5
Cdc42-induced actin filaments could be observed by electron and fluorescence microscopy. HSS from PMN lysates was incubated with 100 nM GTPγS-charged Cdc42 for 5 min at room temperature were stained with uranyl acetate and examined in the electron microscope (A). PMN HSS was warmed at 37°C for 1 min with (C) or without (B) 100 nM charged Cdc42 in the presence of TRITC–phalloidin; or for 5 min in 100 nM charged Cdc42 before dilution into TRITC–phalloidin (D). GST– Cdc42 attached to glutathione beads with (E,G,H) or without charging with GTPγS (F), was diluted with buffer and then added to PMN HSS without (E,F,G) or with 4 μM PAK fragment (H). The samples were warmed at 37°C for 5 min in the presence of TRITC-phalloidin and photographed. Bars: (A) 1 μm; (B–H) 10 μm.
Figure 5
Figure 5
Cdc42-induced actin filaments could be observed by electron and fluorescence microscopy. HSS from PMN lysates was incubated with 100 nM GTPγS-charged Cdc42 for 5 min at room temperature were stained with uranyl acetate and examined in the electron microscope (A). PMN HSS was warmed at 37°C for 1 min with (C) or without (B) 100 nM charged Cdc42 in the presence of TRITC–phalloidin; or for 5 min in 100 nM charged Cdc42 before dilution into TRITC–phalloidin (D). GST– Cdc42 attached to glutathione beads with (E,G,H) or without charging with GTPγS (F), was diluted with buffer and then added to PMN HSS without (E,F,G) or with 4 μM PAK fragment (H). The samples were warmed at 37°C for 5 min in the presence of TRITC-phalloidin and photographed. Bars: (A) 1 μm; (B–H) 10 μm.
Figure 6
Figure 6
(A) Cdc42 but not GTPγS induced actin polymerization in HSS of lysates. PMN lysates were either tested directly or were used to produce a HSS: spun at 14,000 rpm for 5 min in an Eppendorf microfuge, and the supernate of this “low speed spin” was then centrifuged for 20 min at 80,000 rpm in a 100.2 rotor of a tabletop ultracentrifuge (Beckman). The lysate and supernatant of the high speed spin were warmed for 3 min (lysates) or 10 min with 100 μM GTPγS or 100 nM GTPγS-charged Cdc42 or the GTPγS carried over from activating the Cdc42 (Cdc42 buffer). Samples were then processed as described in Fig. 1 A. The data presented are the mean and SD of two experiments in which both lysate and HSS were tested. Data were normalized by setting the change in TRITC–phalloidin fluorescence of lysate stimulated with GTPγS as 100% (the GTPγS-induced increase over basal was 112 and 125% in the two experiments). (B) Addition of PMN lysate back to the HSS allowed GTPγS to induce actin polymerization. Various amounts of lysate equal to 1% (circles), 3% (triangles), or 10% (squares) of the volume of the HSS were incubated for various times in the presence (closed symbols) or absence (open symbols) of 100 μM GTPγS. The samples were processed as described in Materials and Methods.
Figure 7
Figure 7
(A) Effects of liposomes on ability of GTPγS to induce actin polymerization in HSS. HSS was incubated for 10 min at 37° without (open circles) or with (closed circles) 100 μM GTPγS and with varying concentrations of liposomes made of brain lipid. The samples were processed as described in Fig. 1. The data plotted are the means and ranges of values from duplicates of at least two experiments. (B) Pre-incubation of HSS with GTPγS and EDTA allowed GTPγS to stimulate actin polymerization. HSS at 1.5 × 10⁸ cell equivalents/ml were incubated at room temperature for 5 min with no addition (Control), 100 μM GTPγS, 10 mM EDTA, 10 mM EDTA with 100 μM GDP, or 10 mM EDTA with 100 μM GTPγS. Then 12 mM Mg was added to each of the EDTA-containing samples; all samples were incubated for a further 5 min at 37°C. The samples were then processed as in Fig. 1 A. The data shown are duplicates from one experiment representative of three. (C) Addition of Cdc24 allowed GTPγS to stimulate actin polymerization in the HSS. HSS were incubated at room temperature for 5 min and then at 37°C for 10 min with Cdc24 buffer (Control); buffer plus 100 μM GTPγS (GTPγS); 500 nM Cdc24 (Cdc24); or 100 μM GTPγS and 500 nM Cdc24. The samples were processed as described in Fig. 1 A. The data presented are the means and ranges of duplicates of a single experiment. Similar but smaller increases (∼50% increases over buffer control) were induced by Cdc24 in two additional experiments. (D) Addition of oncogenic Dbl allowed GTPγS to stimulate actin polymerization in the HSS. HSS were incubated at room temperature for 5 min and then 10 min at 37°C with buffer, 100 μM GTPγS, 500 nM Dbl, or with 100 μM GTPγS plus 62, 125, 250, or 500 nM oncogenic Dbl. The samples were processed as described in Fig. 1 A. The data presented are the means and ranges of duplicates of a single experiment. Comparable levels of stimulation were achieved by 500 nM Dbl in a second experiment.
Figure 8
Figure 8
Stimulation of PIP2 synthesis by GTPγS, Cdc42, and Rac. (A) 32P incorporation into PIP2 separated by TLC after PIP/ PS micelles were mixed with HSS containing 50 μg/ml brain lipids and addition of either buffer (Control), 100 nM GTPγS-charged Rac, 100 nM GTPγS-charged Cdc42, or 100 μM GTPγS. The labeling and TLC were run as described in Materials and Methods. The data are representative of duplicate samples from two experiments performed on different days. (B) Quantitative analysis by the phosphorimager of the PIP2 peak separated on a chromatograph as in Fig. 8 A. The data for each column represent the mean integrated volume value and range of values from duplicate experiments run on two separate days. (C) Effect of 0.2 mg/ml anti-PIP2 antibody on Cdc42-induced actin polymerization in an HSS. The data are presented relative to the basal (control) fluorescence set at 100% and plotted as the means and ranges of duplicates from a single experiment representative of two.

Similar articles

Cited by

References

    1. Abo A, Webb MR, Grogan A, Segal AW. Activation of NADPH oxidase involves the dissociation of p21rac from its inhibitory GDP/GTP exchange protein (rhoGDI) followed by its translocation to the plasma membrane. Biochem J. 1994;298:585–591. - PMC - PubMed
    1. Barkalow KW, Witke KJ, Kwiatkowshi DJ, Hartwig JH. Coordinated regulation of platelet actin filament barbed ends by gelsolin and capping protein. J Cell Biol. 1996;134:389–399. - PMC - PubMed
    1. Bengtsson T, Sarndahl E, Stendahl O, Andersson T. Involvement of GTP-binding proteins in actin polymerization in human neutrophils. Proc Natl Acad Sci USA. 1990;87:2921–2925. - PMC - PubMed
    1. Bokoch GMS. Regulation of the human neutrophil NADPH oxidase by the Rac GTP-binding proteins. Curr Opin Cell Biol. 1994;6:212–218. - PubMed
    1. Bokoch GM, Bohl BP, Chuang T-H. Guanine nucleotide exchange regulates membrane translocation of Rac/Rho GTP-binding proteins. J Biol Chem. 1994;269:31674–31679. - PubMed

Publication types

MeSH terms