. 1997 Jul 14;138(1):95-103.
doi: 10.1083/jcb.138.1.95.

In vitro reconstitution of cortical actin assembly sites in budding yeast

Affiliations

In vitro reconstitution of cortical actin assembly sites in budding yeast

T Lechler et al. J Cell Biol. .

Abstract

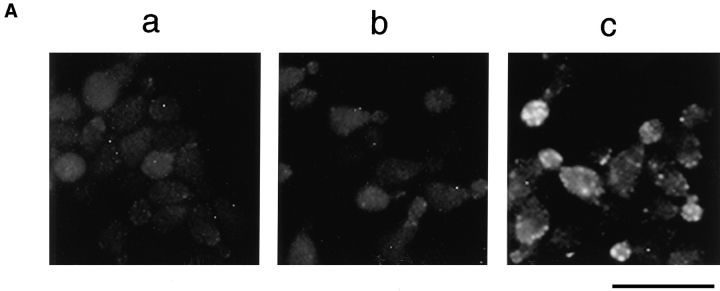
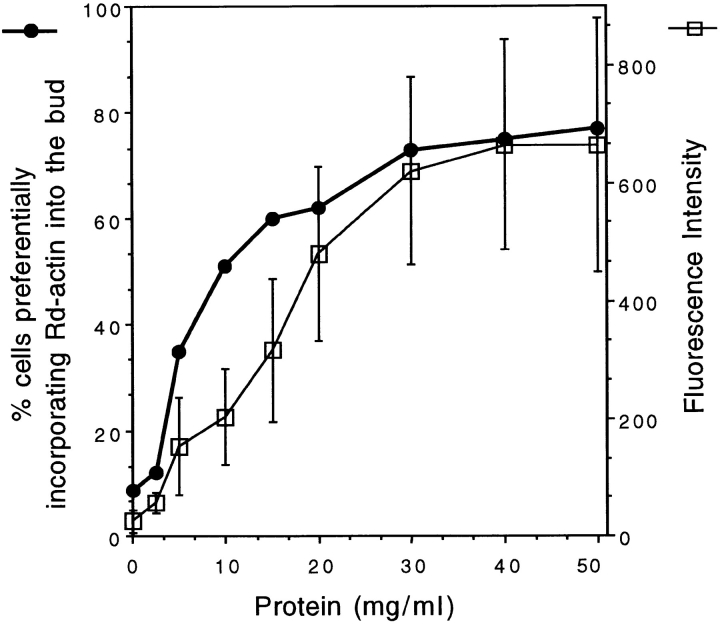
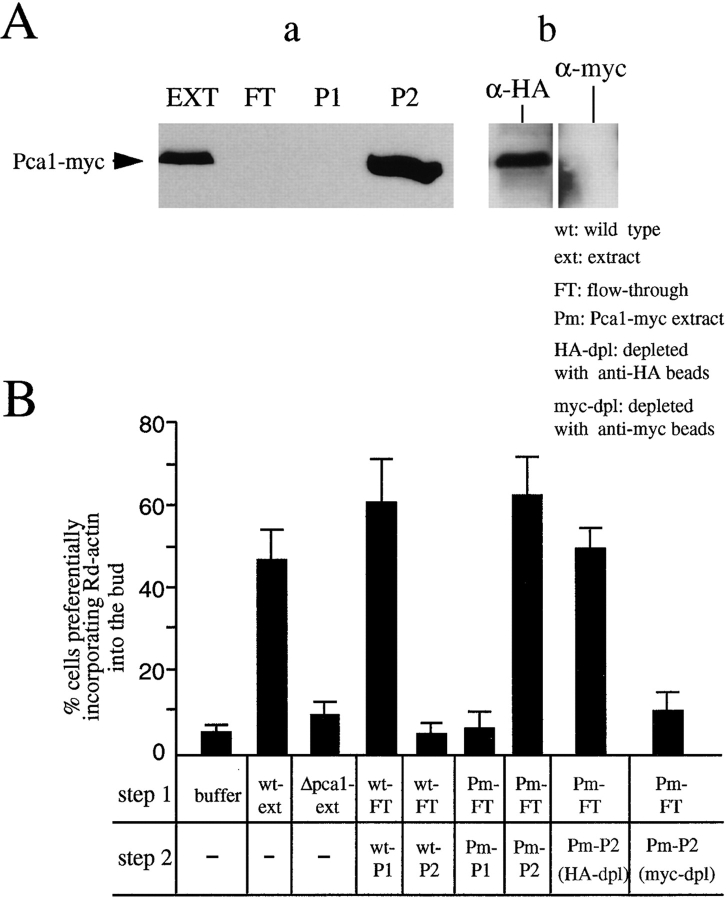
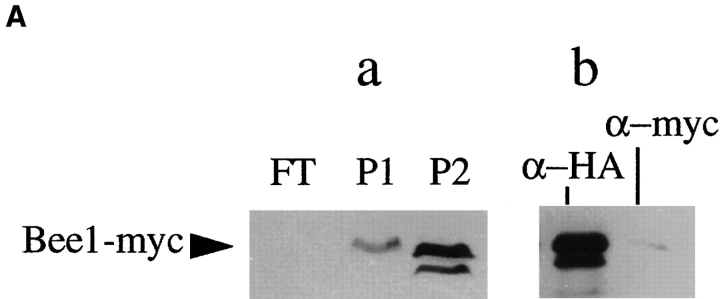
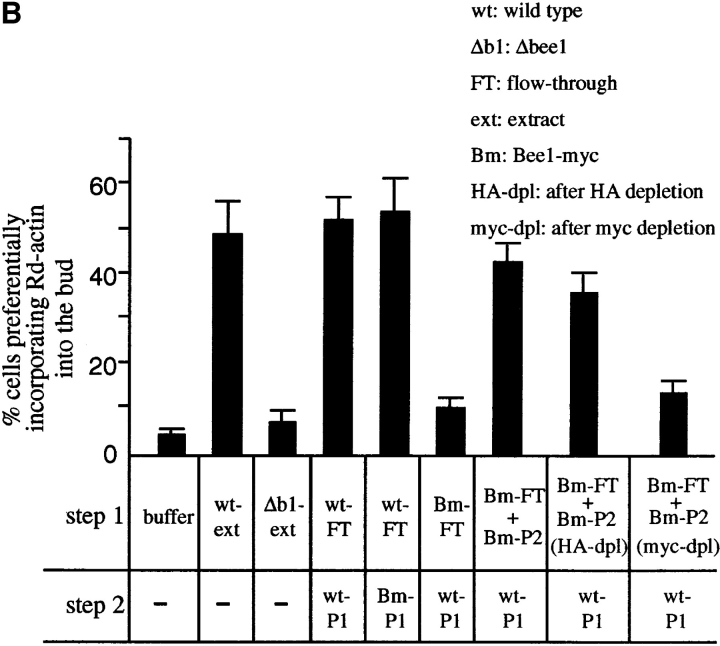
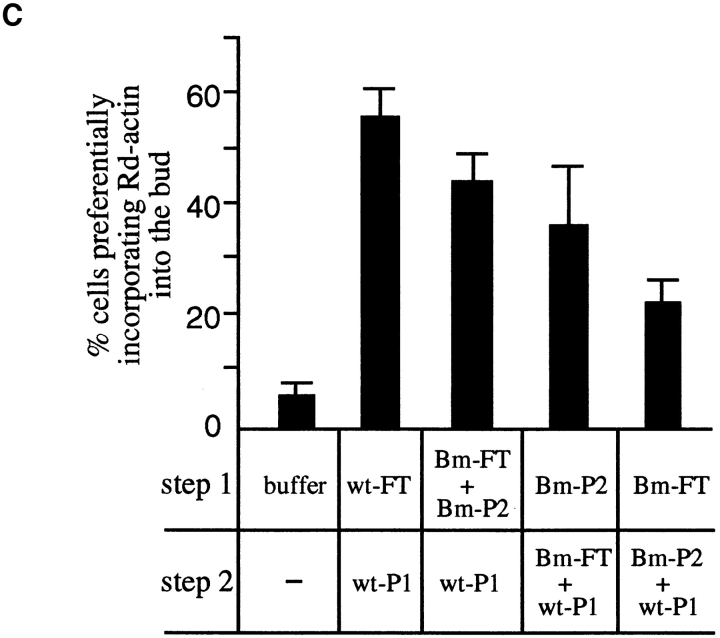
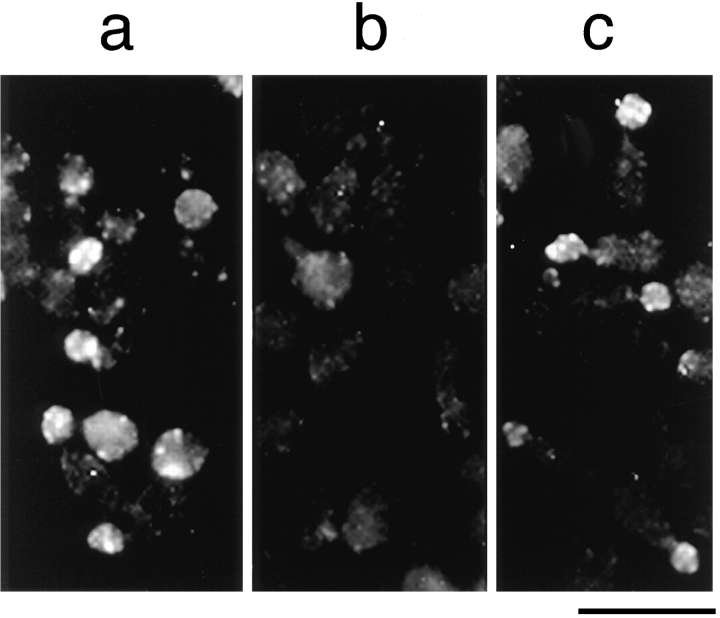
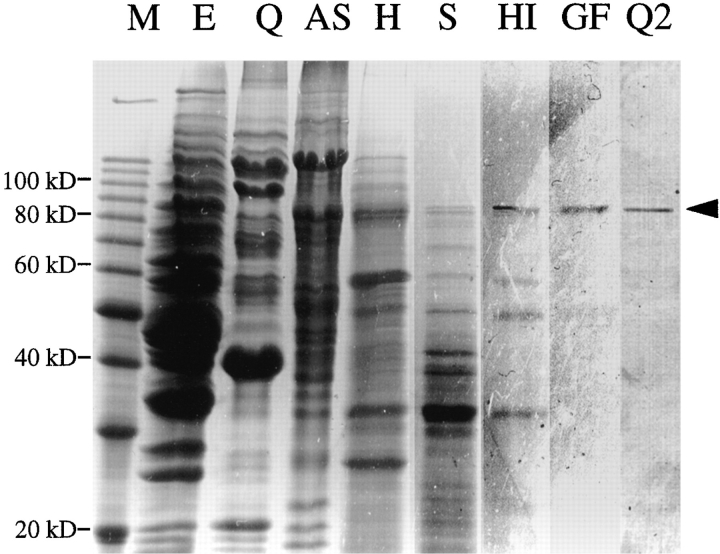
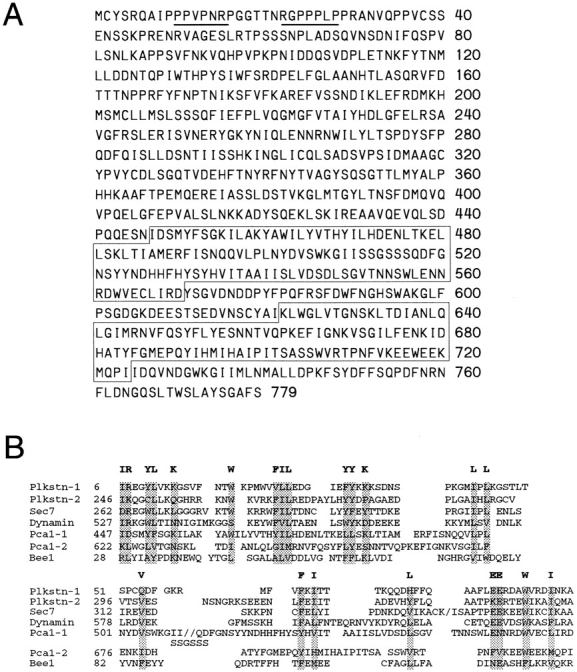
We have developed a biochemical approach for identifying the components of cortical actin assembly sites in polarized yeast cells, based on a permeabilized cell assay that we established for actin assembly in vitro. Previous analysis indicated that an activity associated with the cell cortex promotes actin polymerization in the bud. After inactivation by a chemical treatment, this activity can be reconstituted back to the permeabilized cells from a cytoplasmic extract. Fractionation of the extract revealed that the reconstitution depends on two sequentially acting protein factors. Bee1, a cortical actin cytoskeletal protein with sequence homology to Wiskott-Aldrich syndrome protein, is required for the first step of the reconstitution. This finding, together with the severe defects in actin organization associated with the bee1 null mutation, indicates that Bee1 protein plays a direct role in controlling actin polymerization at the cell cortex. The factor that acts in the second step of the reconstitution has been identified by conventional chromatography. It is composed of a novel protein, Pca1. Sequence analysis suggests that Pca1 has the potential to interact with SH3 domain-containing proteins and phospholipids.


Figures

Figure 3
Figure 3
Sequential activation of actin assembly sites by ACF1 and ACF2. (A) An extract was fractionated over a Q-Sepharose column to yield the flow through and the 0.5 M KCl eluate, which were subsequently desalted and concentrated. The urea-treated, permeabilized cells were incubated with the flow through (a), the eluate (b), or a 1:1 mixture of the two fractions (c) before Rd-actin polymerization. Rhodamine fluorescence images of representative groups of cells are shown. (B) The complementing factors in the flow through and in the eluate are designated ACF1 and ACF2, respectively. The histograms show the percentages of the urea-treated cells that preferentially incorporated Rd-actin into the bud after the cells were incubated with the buffer, a mixture of ACF1 and ACF2, ACF1 first and then ACF2, or ACF2 first and then ACF1. In the latter two treatments, the cells were washed with the buffer after the incubation with the first factor. The percentages shown are averages of the results from two experiments, and the error bars are standard deviations. Bar, 10 μm.
Figure 3
Figure 3
Sequential activation of actin assembly sites by ACF1 and ACF2. (A) An extract was fractionated over a Q-Sepharose column to yield the flow through and the 0.5 M KCl eluate, which were subsequently desalted and concentrated. The urea-treated, permeabilized cells were incubated with the flow through (a), the eluate (b), or a 1:1 mixture of the two fractions (c) before Rd-actin polymerization. Rhodamine fluorescence images of representative groups of cells are shown. (B) The complementing factors in the flow through and in the eluate are designated ACF1 and ACF2, respectively. The histograms show the percentages of the urea-treated cells that preferentially incorporated Rd-actin into the bud after the cells were incubated with the buffer, a mixture of ACF1 and ACF2, ACF1 first and then ACF2, or ACF2 first and then ACF1. In the latter two treatments, the cells were washed with the buffer after the incubation with the first factor. The percentages shown are averages of the results from two experiments, and the error bars are standard deviations. Bar, 10 μm.
Figure 2
Figure 2
Quantification of the activity that complements the urea-treated cells at various extract concentrations (horizontal axis). The complementation activity was quantified by two methods: (a) the percentage of the small budded cells that assemble Rd-actin to a higher level in the bud than in the mother (closed circles); (b) the average fluorescence intensity in the bud over the background fluorescence in the mother (open squares). The error bars are standard deviations. The fluorescence unit is arbitrary.
Figure 6
Figure 6
Pca1 is the protein component of ACF2. An extract prepared from the wild-type (RLY1) or the Pca1-myc expressing strain (RLY163) was fractionated over a Q column as described in the legend to Fig. 4 to yield the FT, P1, and P2 fractions. (A) Immunoblot analysis with a mouse anti-myc antibody showing that Pca1-myc is present exclusively in P2 (a), and the depletion of Pca1-myc from P2 by the anti-myc affinity beads but not by the control anti-HA affinity beads (b). (B) The histograms show the percentages of the urea-treated cells that preferentially incorporated Rd-actin into the bud after the cells were incubated in steps under the conditions described in the table below. The percentages shown are averages of the results from two experiments. wt, the wild-type strain (RLY1); Δpca1, RLY148; Pm, the Pca1-myc expressing strain (RLY163); HA-dpl, after depletion with the control anti-HA affinity beads; myc-dpl, after depletion with the anti-myc affinity beads.
Figure 4
Figure 4
Bee1 is an essential component of ACF1. An extract prepared from the wild-type (RLY1) or the Bee1-myc–expressing strain (RLY160) was passed over a Q-Sepharose column yielding the flow through (FT). The bound proteins were eluted with 0.25 M KCl to yield P1 and then with 0.4 M KCl to yield P2. (A) Immunoblot analysis with a mouse anti-myc antibody showing that Bee1-myc is mostly in P2 (a) and showing the depletion of Bee1-myc from P2 by the anti-myc affinity beads but not by the control anti-HA affinity beads (b). (B) The histograms show the percentages of the urea-treated cells that preferentially incorporated Rd-actin into the bud after the cells were incubated under the conditions described in the table below. The cells were washed with the buffer between the two incubation steps. The percentages shown are averages of the results from two experiments, and the error bars are standard deviations. wt-ext, An extract from the wild-type strain (RLY1); Δb1-ext, an extract from the Δbee1 strain (RLY157); Bm, the Bee1-myc–expressing strain (RLY160); HA-dpl, after depletion with the control anti-HA affinity beads; myc-dpl, after depletion with the anti-myc affinity beads. (C) The order of interaction between Bee1 and the unknown ACF1 component. The histograms show the percentages of the urea-treated cells that preferentially incorporated Rd-actin into the bud after the cells were incubated under the conditions described in the table below. The cells were washed with the buffer between the two incubation steps. The percentages shown are averages of the results from four experiments, and the error bars are standard deviations. The abbreviations are the same as in B.
Figure 4
Figure 4
Bee1 is an essential component of ACF1. An extract prepared from the wild-type (RLY1) or the Bee1-myc–expressing strain (RLY160) was passed over a Q-Sepharose column yielding the flow through (FT). The bound proteins were eluted with 0.25 M KCl to yield P1 and then with 0.4 M KCl to yield P2. (A) Immunoblot analysis with a mouse anti-myc antibody showing that Bee1-myc is mostly in P2 (a) and showing the depletion of Bee1-myc from P2 by the anti-myc affinity beads but not by the control anti-HA affinity beads (b). (B) The histograms show the percentages of the urea-treated cells that preferentially incorporated Rd-actin into the bud after the cells were incubated under the conditions described in the table below. The cells were washed with the buffer between the two incubation steps. The percentages shown are averages of the results from two experiments, and the error bars are standard deviations. wt-ext, An extract from the wild-type strain (RLY1); Δb1-ext, an extract from the Δbee1 strain (RLY157); Bm, the Bee1-myc–expressing strain (RLY160); HA-dpl, after depletion with the control anti-HA affinity beads; myc-dpl, after depletion with the anti-myc affinity beads. (C) The order of interaction between Bee1 and the unknown ACF1 component. The histograms show the percentages of the urea-treated cells that preferentially incorporated Rd-actin into the bud after the cells were incubated under the conditions described in the table below. The cells were washed with the buffer between the two incubation steps. The percentages shown are averages of the results from four experiments, and the error bars are standard deviations. The abbreviations are the same as in B.
Figure 1
Figure 1
Reconstitution of actin assembly sites in permeabilized yeast cells. Rhodamine fluorescence images of the permeabilized cells after Rd-actin assembly. (a) Untreated, permeabilized cells. (b) Permeabilized cells that were treated with 2 M urea and then incubated with the buffer. (c) Permeabilized cells that were treated with 2 M urea and then incubated with the extract. Bar, 10 μm.
Figure 5
Figure 5
Purification of ACF2. The peak fractions that contained ACF2 activity after each consecutive purification step (from left to right) were analyzed on 12.5% SDS–polyacrylamide gels. The gels were stained with Coomassie blue and photographed. M, protein molecular weight marker (Life Technologies, Inc., Gaithersburg, MD). E, the starting extract; Q, Q-Sepharose column; AS, 45% ammonium sulfate precipitation; H, heat treatment at 60°C; S, S-Sepharose and heparin columns (connected in series); HI, methyl hydrophobic interaction column; GF, S-200 Gel filtration column; Q2, Bio-Scale Q2 column.
Figure 7
Figure 7
Sequence features of Pca1 protein. (A) Amino acid sequence of Pca1 (these sequence data are available from GenBank/EMBL/DDBJ under accession number Z73316). The proline-rich SH3 domain-interacting sequences are underlined. The two putative PH domains are boxed. (B) Alignment of the two putative PH domains with the PH domains of pleckstrin (Tyers et al., 1988), Sec7 (Liu and Pohajdak, 1992), dynamin (Downing et al., 1994), and Bee1 (Symons et al., 1996). The conserved hydrophobic and basic amino acids are highlighted.

Similar articles

Cited by

References

    1. Adams AE, Johnson DI, Longnecker RM, Sloat BF, Pringle JR. CDC42 and CDC43, two additional genes involved in budding and the establishment of cell polarity in the yeast Saccharomyces cerevisiae. . J Cell Biol. 1990;111:131–142. - PMC - PubMed
    1. Adams AE, Botstein D, Drubin DG. Requirement of yeast fimbrin for actin organization and morphogenesis in vivo. . Nature (Lond) 1991;354:404–408. - PubMed
    1. Amatruda JF, Gattermeir DJ, Karpova TS, Cooper JA. Effects of null mutations and overexpression of capping protein on morphogenesis, actin distribution, and polarized secretion in yeast. J Cell Biol. 1992;119:1151–1162. - PMC - PubMed
    1. Carpenter CL, Cantley LC. Phosphoinositide kinases. Curr Opin Cell Biol. 1996;8:153–158. - PubMed
    1. Cooper JA. Effects of cytochalasin and phalloidin on actin. J Cell Biol. 1987;105:1473–1478. - PMC - PubMed

Publication types

MeSH terms

Associated data