

In vivo 13C NMR measurements of cerebral glutamine synthesis as evidence for glutamate-glutamine cycling
- PMID: 9122259
- PMCID: PMC20152
- DOI: 10.1073/pnas.94.6.2699
In vivo 13C NMR measurements of cerebral glutamine synthesis as evidence for glutamate-glutamine cycling
Abstract
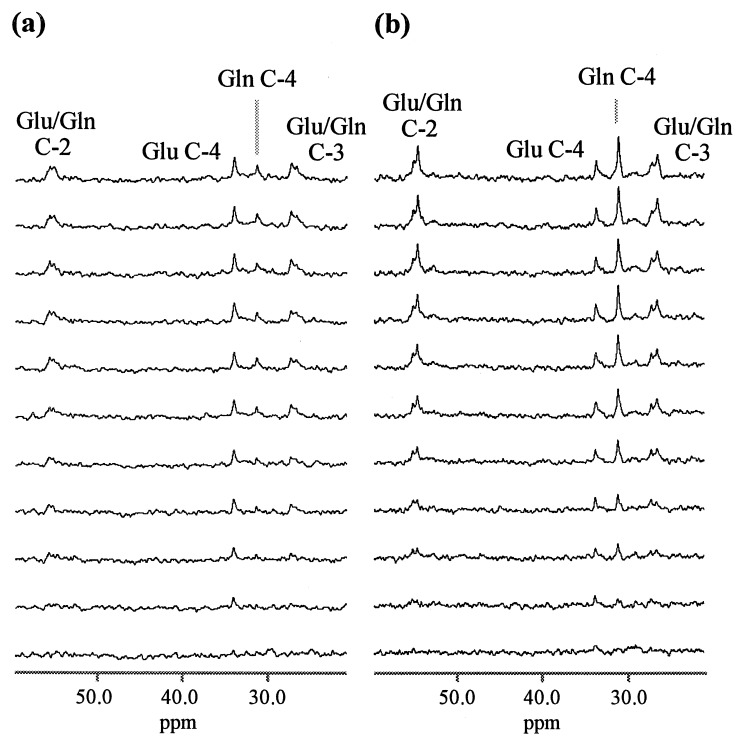
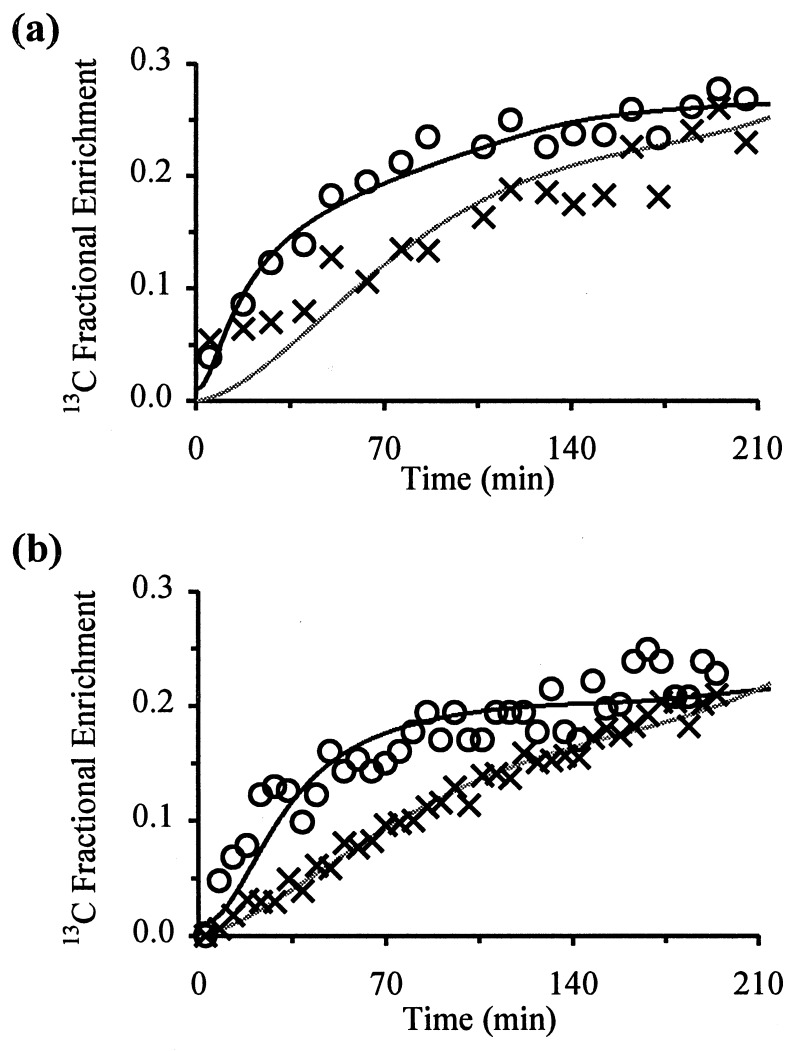
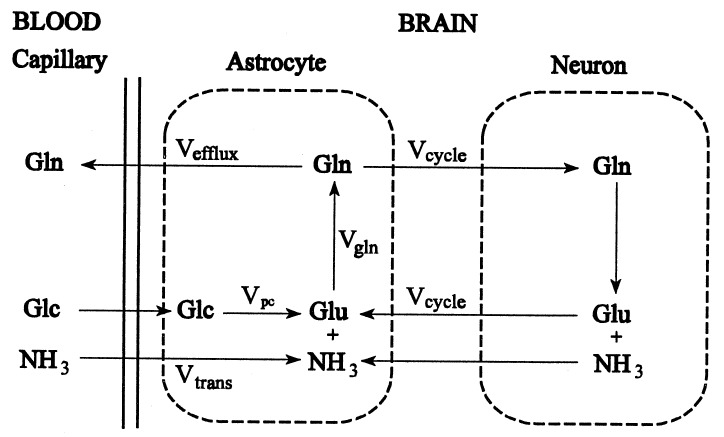
The cerebral tricarboxylic acid (TCA) cycle rate and the rate of glutamine synthesis were measured in rats in vivo under normal physiological and hyperammonemic conditions using 13C NMR spectroscopy. In the hyperammonemic animals, blood ammonia levels were raised from control values of approximately 0.05 mM to approximately 0.35 mM by an intravenous ammonium acetate infusion. Once a steady-state of cerebral metabolites was established, a [1-13C]glucose infusion was initiated, and 13C NMR spectra acquired continuously on a 7-tesla spectrometer to monitor 13C labeling of cerebral metabolites. The time courses of glutamate and glutamine C-4 labeling were fitted to a mathematical model to yield TCA cycle rate (V(TCA)) and the flux from glutamate to glutamine through the glutamine synthetase pathway (V(gln)). Under hyperammonemia the value of V(TCA) was 0.57 +/- 0.16 micromol/min per g (mean +/- SD, n = 6) and was not significantly different (unpaired t test; P > 0.10) from that measured in the control animals (0.46 +/- 0.12 micromol/min per g, n = 5). Therefore, the TCA cycle rate was not significantly altered by hyperammonemia. The measured rate of glutamine synthesis under hyperammonemia was 0.43 +/- 0.14 micromol/min per g (mean +/- SD, n = 6), which was significantly higher (unpaired t test; P < 0.01) than that measured in the control group (0.21 +/- 0.04 micromol/ min per g, n = 5). We propose that the majority of the glutamine synthetase flux under normal physiological conditions results from neurotransmitter substrate cycling between neurons and glia. Under hyperammonemia the observed increase in glutamine synthesis is comparable to the expected increase in ammonia transport into the brain and reported measurements of glutamine efflux under such conditions. Thus, under conditions of elevated plasma ammonia an increase in the rate of glutamine synthesis occurs as a means of ammonia detoxification, and this is superimposed on the constant rate of neurotransmitter cycling through glutamine synthetase.
Figures
Similar articles
-
In vivo (13)C NMR measurement of neurotransmitter glutamate cycling, anaplerosis and TCA cycle flux in rat brain during.J Neurochem. 2001 Feb;76(4):975-89. doi: 10.1046/j.1471-4159.2001.00074.x. J Neurochem. 2001. PMID: 11181817
-
Effects of ammonia on the anaplerotic pathway and amino acid metabolism in the brain: an ex vivo 13C NMR spectroscopic study of rats after administering [2-13C]] glucose with or without ammonium acetate.Brain Res. 1999 Sep 11;841(1-2):11-9. doi: 10.1016/s0006-8993(99)01772-2. Brain Res. 1999. PMID: 10546983
-
Determination of the rate of the glutamate/glutamine cycle in the human brain by in vivo 13C NMR.Proc Natl Acad Sci U S A. 1999 Jul 6;96(14):8235-40. doi: 10.1073/pnas.96.14.8235. Proc Natl Acad Sci U S A. 1999. PMID: 10393978 Free PMC article.
-
Functional energy metabolism: in vivo 13C-NMR spectroscopy evidence for coupling of cerebral glucose consumption and glutamatergic neuronalactivity.Dev Neurosci. 1998;20(4-5):321-30. doi: 10.1159/000017327. Dev Neurosci. 1998. PMID: 9778568 Review.
-
Cerebral metabolic studies in vivo by combined 1H/31P and 1H/13C NMR spectroscopic methods.Acta Neurochir Suppl (Wien). 1993;57:9-20. doi: 10.1007/978-3-7091-9266-5_2. Acta Neurochir Suppl (Wien). 1993. PMID: 8421959 Review.
Cited by
-
Divergent Cellular Energetics, Glutamate Metabolism, and Mitochondrial Function Between Human and Mouse Cerebral Cortex.Mol Neurobiol. 2022 Dec;59(12):7495-7512. doi: 10.1007/s12035-022-03053-5. Epub 2022 Oct 6. Mol Neurobiol. 2022. PMID: 36201140
-
Measurement of cerebral oxidative glucose consumption in patients with type 1 diabetes mellitus and hypoglycemia unawareness using (13)C nuclear magnetic resonance spectroscopy.Metabolism. 2010 Jan;59(1):100-6. doi: 10.1016/j.metabol.2009.07.012. Epub 2009 Sep 18. Metabolism. 2010. PMID: 19766263 Free PMC article.
-
Biological embedding of early trauma: the role of higher prefrontal synaptic strength.Eur J Psychotraumatol. 2023;14(2):2246338. doi: 10.1080/20008066.2023.2246338. Eur J Psychotraumatol. 2023. PMID: 37642398 Free PMC article.
-
Comparison of Glutamate Turnover in Nerve Terminals and Brain Tissue During [1,6-13C2]Glucose Metabolism in Anesthetized Rats.Neurochem Res. 2017 Jan;42(1):173-190. doi: 10.1007/s11064-016-2103-x. Epub 2016 Dec 26. Neurochem Res. 2017. PMID: 28025798 Free PMC article.
-
Identification of SLC38A7 (SNAT7) protein as a glutamine transporter expressed in neurons.J Biol Chem. 2011 Jun 10;286(23):20500-11. doi: 10.1074/jbc.M110.162404. Epub 2011 Apr 21. J Biol Chem. 2011. PMID: 21511949 Free PMC article.
References
-
- Ereciñska M, Silver I A. Prog Neurobiol. 1990;35:245–296. - PubMed
-
- Cooper A J L, Plum F. Physiol Rev. 1987;67:440–519. - PubMed
-
- Gruetter R, Novotny E J, Boulware S D, Mason G F, Rothman D L, Shulman G I, Prichard J W, Shulman R G. J Neurochem. 1994;63:1377–1385. - PubMed
-
- Mason G F, Rothman D L, Behar K L, Shulman R G. J Cereb Blood Flow Metab. 1992;12:434–447. - PubMed
Publication types
MeSH terms
Substances
Grants and funding
LinkOut - more resources
Full Text Sources
Miscellaneous
