Comparative Study
. 1996 Dec 1;16(23):7513-25.
doi: 10.1523/JNEUROSCI.16-23-07513.1996.

Expression of presenilin 1 and 2 (PS1 and PS2) in human and murine tissues

Affiliations
Comparative Study

Expression of presenilin 1 and 2 (PS1 and PS2) in human and murine tissues

M K Lee et al. J Neurosci. .

Abstract

Mutations in genes encoding related proteins, termed presenilin 1 (PS1) and presenilin 2 (PS2), are linked to the majority of cases with early-onset familial Alzheimer's disease (FAD). To clarify potential function(s) of presenilins and relationships of presenilin expression to pathogenesis of AD, we examined the expression of PS1 and PS2 mRNA and PS1 protein in human and mouse. Semi-quantitative PCR of reverse-transcribed RNA (RT-PCR) analysis revealed that PS1 and PS2 mRNA are expressed ubiquitously and at comparable levels in most human and mouse tissues, including adult brain. However, PS1 mRNA is expressed at significantly higher levels in developing brain. In situ hybridization studies of mouse embryos revealed widespread expression of PS1 mRNA with a neural expression pattern that, in part, overlaps that reported for mRNA encoding specific Notch homologs. In situ hybridization analysis in adult mouse brain revealed that PS1 and PS2 mRNAs are enriched in neurons of the hippocampal formation and entorhinal cortex. Although PS1 and PS2 mRNA are expressed most prominently in neurons, lower but significant levels of PS1 and PS2 transcripts are also detected in white matter glial cells. Moreover, cultured neurons and astrocytes express PS1 and PS2 mRNAs. Using PS1-specific antibodies in immunoblot analysis, we demonstrate that PS1 accumulates as approximately 28 kDa N-terminal and approximately 18 kDa C-terminal fragments in brain. Immunocytochemical studies of mouse brain reveal that PS1 protein accumulates in a variety of neuronal populations with enrichment in somatodendritic and neuropil compartments.


Figures

Fig. 1.
Fig. 1.
Quantitative PCR amplification of PS1 and PS2 cDNAs from human brain and mouse spinal cord. A, EtBr-stained gel of PflMI/NcoI double-digested PCR products from human fetal brain and adult mouse spinal cord cDNA after 22, 24, 26, 28, and 30 cycles of amplification. Also shown are PCR products obtained by using PS1 and PS2 cDNA as templates. The marker DNA fragments are indicated in bp.B, Autoradiogram of the gel shown in A.C, D, Semilog plots of radioactivity (density) versus cycle number for the human (C) and mouse (D) PS1 and PS2 fragments shown in B. The linear regression equation for each plot is shown in theinset.
Fig. 2.
Fig. 2.
RT-PCR analysis of PS1 and PS2 mRNA in human and mouse tissues. A, EtBr-stained gel ofPflMI/NcoI double-digested PCR product generated by RT-PCR amplification of RNAs from human fetal tissues (adrenal, kidney, liver, lung, skeletal muscle, and spleen), brains from fetus and adults [cortex from a fetus (f-Ctx), a 19 yr old (Ctx-19), a 66 yr old (Ctx-66), and a 75 yr old (Ctx-75)], cortical white matter (WM-1and WM-2), and cortical gray matter (GM-1and GM-2). B, EtBr-stained gel ofPflMI/NcoI double-digested PCR products generated by RT-PCR amplification of RNAs from mouse embryos [embryonic days 8.5 (E8.5), 10.5 (E10.5), 12.5 (E12.5), and 14.5 (E14.5)], brain [neonatal cortex (P1 Ctx) and adult cortex (Ad Ctx)], and adult tissues [heart, kidney, liver, lung, small intestine (Sm Int), spleen, and testis]. C, D, Autoradiogram of the gels shown in A and B, respectively. The ratio of PS1 to PS2 cDNA products, averaged from two independent PCR reactions, is shown at the bottom. The amount of template (reverse-transcribed RNA) was equated for its actin mRNA content (data not shown).
Fig. 3.
Fig. 3.
In situ localization of PS1 mRNA in mouse embryos. Paraffin-embedded sections of mouse embryos were processed for in situ hybridization by PS1-specific riboprobes. The silver grains over the sections, representing specific hybridization, were visualized by dark-field microscopy. The sections hybridized with antisense and control sense probes were photographed and reproduced using identical conditions. A, B, PS1 mRNA expression in E10 mouse embryos. Sections from E10 mouse embryos probed with antisense (A) and sense (B) mouse PS1 riboprobes reveal the presence of PS1 mRNA throughout the embryo. A, Aorta; C, spinal cord;H, heart; M, mesencephalon;O, optic vesicle; S, somite;ST, septum transversum; T, telencephalon.C, D, Detailed view of the spinal neural tube from sections shown in A and B. The antisense-probed section (C) shows higher grain density throughout the neural epithelium, as compared with the section probed with sense probe (D). DRG, Dorsal root ganglion; M, marginal zone; V, ventricular zone; VH, ventral horn. E, F, Sagittal sections of E12.5 mouse embryo hybridized with antisense (E) and sense (F) mouse PS1 riboprobe show PS1 mRNA expression throughout the nervous system and peripheral tissues. B, Brachial arch; C, spinal cord; H, heart; HB, hindbrain;L, liver; M, mesencephalon;T, telencephalon. G, H, Sections of E16.5 mouse embryo show high levels of PS1 mRNA expression in epithelial cells of small intestine (G) and skin (H). Scale bars: C, D, 150 μm;G, H, 300 μm.
Fig. 4.
Fig. 4.
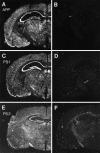
Expression of APP, PS1, and PS2 transcripts in mouse brain. Coronal sections of adult mouse brain at the level of dorsal hippocampus hybridized with antisense riboprobes specific for APP (A), PS1 (C), and PS2 (E). Adjacent sections were hybridized with sense probe (B, D, F) to show the specificity of antisense probes. The silver grains associated with specific transcripts were visualized with dark-field microscopy. The antisense and respective sense control sections were photographed and reproduced under identical conditions. A, B, APP mRNA is highly expressed in most brain regions, with particularly high levels in hippocampal CA fields (CA1, CA2) and primary olfactory cortex (POC). The APP sections were exposed to emulsion for 3 d. PS1 (C, D) and PS2 (E, F) mRNA are widely distributed, but the distribution of cells expressing high (Figure legend continues)levels of each transcript is restricted. The PS1 and PS2 sections were exposed on emulsion for 3 weeks. Longer exposure times were required for photography of sections hybridized with PS2 probes (E, F) because of lower signal levels of the section shown in E. The longer exposure times under dark-field illumination led to higher levels of nonspecific signal associated with the white matter tracts in both antisense (E) and sense (F)-probed sections.CA1, CA2, D, Hippocampal CA-fields and dentate gyrus; POC, primary olfactory cortex;Th, thalamus; a, b, c, lateral, medial, and cortical amygdala; d, arcuate nucleus; e, subthalamic nucleus; f, zona inserta; g, corpus callosum; h, habenulae.
Fig. 5.
Fig. 5.
Neuronal and glial expression of PS1 mRNA in brain. A, B, Bright-field image of CA2 region of hippocampus from sections hybridized with antisense (A) or sense (B) PS1 riboprobes. High levels of PS1 mRNA-associated silver grains are most evident in pyramidal neurons.C, D, Corpus callosum from brain sections hybridized with antisense (C) or sense (D) riboprobes shows expression of PS1 mRNA in glial cells of white matter tracts. The silver grains were visualized by differential interference contrast microscopy and are shown as white dots. All of the sections were lightly counterstained with hematoxylin/eosin. Scale bars: A, B, 75 μm; C, D, 150 μm.
Fig. 9.
Fig. 9.
Expression of PS1 and PS2 in mouse neurons and glia in culture. A, EtBr-stained gels of PS1 and PS2 products amplified from mouse neuronal or glial RNA. PS1 was distinguished from PS2 by digestion with PflMI.Lane 1, PS1 plasmid; lane 2, PS2 plasmid;lane 3, mouse neocortex; lane 4, primary neuronal culture; lane 5, primary glial culture. Marker fragments (M) are indicated in bps.B, Immunoblot analysis of total SDS-extracts (50 μg) from mouse cortex (Ctx), cultured neurons (N), and cultured glia (G) using Ab14 and αPS1Loop antibodies; for analysis of β3-tubulin and GFAP, 5 μg of total SDS-extracts was assayed. Blots probed with antibodies to PS1 N-terminal fragment (Ab14) or PS1 C-terminal fragment (αPS1Loop) show that expressed PS1 protein accumulates as processed fragments in cultured neurons and glia. Immunoblot analysis of parallel extracts using antibodies to either neuron-specific β-tubulin (β3-tubulin) or GFAP (GFAP) demonstrates the purity of each culture. Molecular weight standards are indicated in kDa.
Fig. 6.
Fig. 6.
Distribution of APP, PS1, and PS2 mRNA expression at the level of caudate and entorhinal cortex. A–C, Coronal sections through the caudate putamen at the level anterior to hippocampus hybridized with antisense riboprobes specific for APP (A), PS1 (B), or PS2 (C) mRNA. In lateral amygdyla, APP mRNA is expressed at high levels relative to PS1 and PS2 transcripts. Also note that, whereas the level of PS1 mRNA in caudate putamen is qualitatively similar to other cortical regions in this section, PS2 mRNA is much more prominent in the CP relative to neighboring cortical regions. CP, Caudate putamen; HT, hypothalamus; LA, lateral amygdyla, POC, primary olfactory cortex;Th, thalamus. D–F, Coronal section through caudal hippocampus at the level of entorhinal cortex (EC) and substantia nigra (SN) hybridized with antisense riboprobes specific for APP (D), PS1 (E), and PS2 (F). All three transcripts are distributed throughout this coronal section with significant expression of APP, PS1, and PS2 mRNAs in hippocampus, entorhinal cortex, and amygdyla. APP mRNA level is very high in SN neurons, whereas PS1 and PS2 mRNAs are expressed at similar levels in SN and regions adjacent to it.A, Amygdyla; CA1, CA3, the CA-fields of hippocampus; D, dentate gyrus;M, mamillary body.
Fig. 7.
Fig. 7.
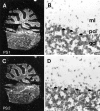
Expression of PS1 and PS2 mRNAs in cerebellum.A, C, Dark-field microscopy images of sagittal section through cerebellum and pons hybridized with antisense riboprobe for PS1 (A) and PS2 (B). B, D, High power view of cerebellar cortex showing PS1 (B) and PS2 (D) mRNA-associated silver grains over granule cell layer (gcl) and Purkinje cells (arrows) in Purkinje cell layer (pcl). Note that grains inpcl are not restricted to Purkinje cells, and the cells in the molecular layer (ml) also show specific hybridization. Scale bar, B, D, 75 μm.
Fig. 8.
Fig. 8.
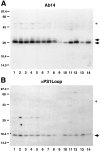
Accumulation of processed PS1 fragments in mouse tissues. SDS-soluble extracts from mouse neural (olfactory bulb,lane 1; caudate putamen, lane 2; thalamus, lane 3; neocortex, lane 4; hippocampus, lane 5; cerebellum, lane 6; brain stem, lane 7; optic nerve, lane 8) and non-neural (heart, lane 9; kidney, lane 10; liver, lane 11; lung, lane 12; small intestine, lane 13; spleen,lane 14) tissues were immunoblotted and probed with PS1-specific Ab14 (A) or αPS1Loop (B) antibodies. Arrows denote specific immunoreactive species, which were competible with peptide (Ab14) or GST fusion protein (PS1Loop; Thinakaran et al., 1996) (data not shown). The predicted mobility of the full-length PS1 is indicated by the asterisk. The molecular mass standards are indicated at left in kDa.A, Ab14 reacts with the N-terminal PS1 fragment at ∼28–30 kDa. Note that, in neural tissues (lanes 1–8), the PS1 N-terminal fragment resolves as a major doublet and a minor species with retarded migration (arrows). With exception of lung (lane 12), only a single Ab14-reactive PS1 fragment is detected in non-neural tissues (lanes 9–14). B, αPS1Loop antibody specifically reacts with an ∼18 kDa PS1 fragment in all tissues.
Fig. 10.
Fig. 10.
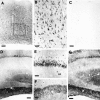
Immunohistochemical localization of PS1 in mouse brain. A, αPS1Loop staining in neocortex. PS1-IR is present in all layers of neocortex. Box delineates area shown at higher magnification in B. Scale bar, 160 μm.B, High power view of αPS1Loop staining in neocortex. PS1-IR is enriched in somatodendritic compartments in neurons, with lighter staining in the neuropil. Scale bar, 53 μm.C, Somatodendritic and neuropil PS1-IR are fully competed by preadsorption of αPS1Loop antibody with GST-PS1 loop fusion protein. Scale bar, 160 μm. D, αPS1Loop staining in the hippocampal formation. PS1-IR is present inCA1, CA3, and dentate gyrus (DG). The cell bodies of pyramidal neurons inCA1 and CA3 and those of granule cells of the DG are intensely PS1-IR. In addition, the stratum lucidum (SL) of CA3, corresponding to the terminal fields of mossy fibers originating from granule cells in theDG, is also intensely PS1-IR. Scale bar, 320 μm.E, Higher magnification of αPS1Loop staining inCA1. PS1-IR is prominent in neuronal cell bodies in the stratum pyramidale (SP) and to proximal dendrites in the stratum radiatum (SR). Scale bar, 64 μm.F, Higher magnification of αPS1Loop staining inCA3. PS1-IR is present in neuronal cell bodies of theSP and prominent in the SL. Scale bar, 160 μm. G, Ab14 staining in the hippocampal formation. PS1-IR is similar to that using αPS1Loop antibody. Scale bar, 280 μm.

Similar articles

Cited by

References

    1. Alzheimer’s Disease Collaborative Group. The structure of the presenilin 1 (S182) gene and identification of six novel mutations in early onset AD families. Nat Genet. 1995;11:219–222. - PubMed
    1. Bendotti C, Forloni GL, Morgan RA, O’Hara BF, Oster-Granite ML, Reeves RH, Gearhart JD, Coyle JT. Neuroanatomical localization and quantification of amyloid precursor protein mRNA by in situ hybridization in the brains of normal, aneuploid, and lesioned mice. Proc Natl Acad Sci USA. 1988;85:3628–3632. - PMC - PubMed
    1. Boteva K, Vitek M, Mitsuda H, de Silva H, Xu P-T, Small G, Gilbert JR. Mutation analysis of presenilin 1 gene in Alzheimer’s disease. Lancet. 1996;347:130–131. - PubMed
    1. Campion D, Flaman JM, Brice A, Hannequin D, Dubois B, Martin C, Moreau V, Charbonnier F, Didierjean O, Tardieu S, Penet C, Puel M, Pasquier F, Ledoze F, Bellis G, Calenda A, Heilig R, Martinez M, Mallet J, Bellis M, Clergetdarpoux F, Agid Y, Frebourg T. Mutations of the presenilin 1 gene in families with early-onset Alzheimer’s disease. Hum Mol Genet. 1995;4:2373–2377. - PubMed
    1. Chapman J, Asherov A, Wang N, Treves TA, Korczyn AD, Goldfarb LG. Familial Alzheimer’s disease associated with S182 codon 286 mutation. Lancet. 1995;346:1040. - PubMed

Publication types