The E5 gene product of rhesus papillomavirus is an activator of endogenous Ras and phosphatidylinositol-3'-kinase in NIH 3T3 cells
- PMID: 8917513
- PMCID: PMC24014
- DOI: 10.1073/pnas.93.23.12879
The E5 gene product of rhesus papillomavirus is an activator of endogenous Ras and phosphatidylinositol-3'-kinase in NIH 3T3 cells
Abstract
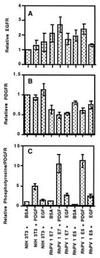
We examined the effect of two rhesus papillomavirus 1 (RhPV) oncogenes on cytokine-induced signal transduction pathways leading to the possible activation of Ras protein (p21ras) and phosphatidylinositol kinase. p21ras in both the activated (GTP-bound) and inactivated (GDP-bound) states were quantitated. NIH 3T3 cell lines expressing the RhPV 1 E5 gene or epidermal growth factor receptor cDNA had about a sixfold higher ratio of p21ras-bound GTP to p21ras-bound GDP as compared with parental NIH 3T3 cells or a cell line expressing the RhPV 1 E7 gene under normal culture conditions, yet expressed similar levels of p21ras. Quiescent cells had dramatically reduced levels of activated p21ras, except those containing RhPV 1 E7. Levels were restored by stimulation with epidermal growth factor or platelet-derived growth factor. Both epidermal growth factor and platelet-derived growth factor receptor of RhPV 1 E5- and E7-containing cells responded to cytokine stimulation. Endogenous phosphatidylinositol-3'-kinase was up-regulated in NIH 3T3 cells transformed with the E5 genes of RhPV 1 and bovine papillomavirus 1. These results suggest that E5 genes of papillomaviruses play a major role in the regulation of transduction pathways.
Figures


Similar articles
-
Accumulation of p21ras.GTP in response to stimulation with epidermal growth factor and oncogene products with tyrosine kinase activity.Proc Natl Acad Sci U S A. 1990 Oct;87(20):7926-9. doi: 10.1073/pnas.87.20.7926. Proc Natl Acad Sci U S A. 1990. PMID: 2146678 Free PMC article.
-
The products of the E5, E6, or E7 open reading frames of RhPV 1 can individually transform NIH 3T3 cells or in cotransfections with activated ras can transform primary rodent epithelial cells.Virology. 1993 Oct;196(2):861-7. doi: 10.1006/viro.1993.1547. Virology. 1993. PMID: 8396814
-
Platelet-derived growth factor stimulation of GTPase-activating protein tyrosine phosphorylation in control and c-H-ras-expressing NIH 3T3 cells correlates with p21ras activation.Mol Cell Biol. 1992 Sep;12(9):3903-9. doi: 10.1128/mcb.12.9.3903-3909.1992. Mol Cell Biol. 1992. PMID: 1508192 Free PMC article.
-
p21ras: an oncoprotein functioning in growth factor-induced signal transduction.Eur J Cancer. 1995 Jul-Aug;31A(7-8):1051-4. doi: 10.1016/0959-8049(95)00168-i. Eur J Cancer. 1995. PMID: 7576990 Review.
-
Role of p21ras in growth factor signal transduction.Biochem Soc Trans. 1993 Nov;21(4):888-94. doi: 10.1042/bst0210888. Biochem Soc Trans. 1993. PMID: 8132088 Review. No abstract available.
Cited by
-
Caveolin 1-mediated regulation of receptor tyrosine kinase-associated phosphatidylinositol 3-kinase activity by ceramide.Mol Cell Biol. 2000 Mar;20(5):1507-14. doi: 10.1128/MCB.20.5.1507-1514.2000. Mol Cell Biol. 2000. PMID: 10669728 Free PMC article.
-
HPV-Based Screening, Triage, Treatment, and Followup Strategies in the Management of Cervical Intraepithelial Neoplasia.Obstet Gynecol Int. 2013;2013:912780. doi: 10.1155/2013/912780. Epub 2013 Apr 14. Obstet Gynecol Int. 2013. PMID: 23690785 Free PMC article.
-
Analysis of activated platelet-derived growth factor β receptor and Ras-MAP kinase pathway in equine sarcoid fibroblasts.Biomed Res Int. 2013;2013:283985. doi: 10.1155/2013/283985. Epub 2013 Jul 11. Biomed Res Int. 2013. PMID: 23936786 Free PMC article.
-
Herpesvirus ateles gene product Tio interacts with nonreceptor protein tyrosine kinases.J Virol. 1999 Jun;73(6):4631-9. doi: 10.1128/JVI.73.6.4631-4639.1999. J Virol. 1999. PMID: 10233922 Free PMC article.
-
Differential effects of the splice acceptor at nucleotide 3295 of human papillomavirus type 31 on stable and transient viral replication.J Virol. 1997 Nov;71(11):8186-94. doi: 10.1128/JVI.71.11.8186-8194.1997. J Virol. 1997. PMID: 9343169 Free PMC article.
References
Publication types
MeSH terms
Substances
Grants and funding
LinkOut - more resources
Full Text Sources
Research Materials
Miscellaneous

