. 1996 Oct 15;16(20):6331-41.
doi: 10.1523/JNEUROSCI.16-20-06331.1996.

Immunohistochemical distribution and electron microscopic subcellular localization of the proteasome in the rat CNS

Affiliations

Immunohistochemical distribution and electron microscopic subcellular localization of the proteasome in the rat CNS

E Mengual et al. J Neurosci. .

Abstract

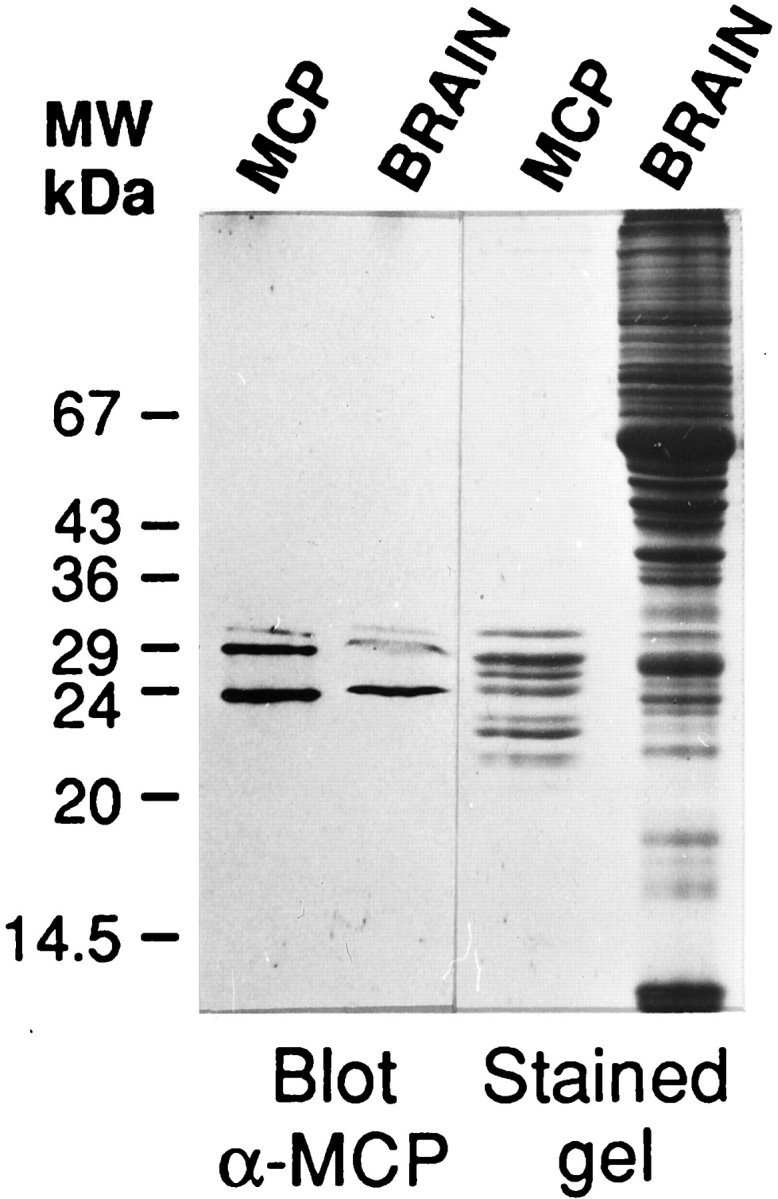
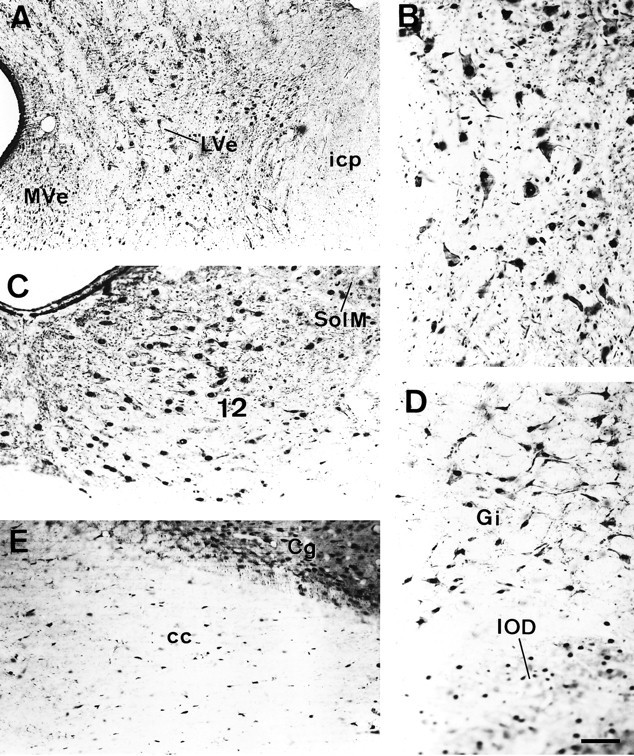
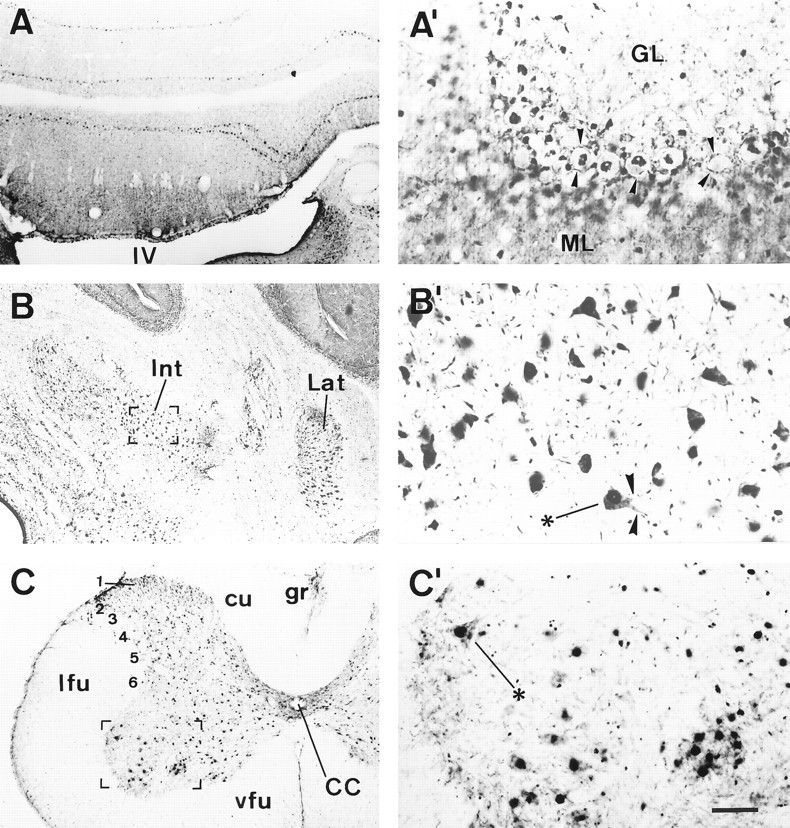
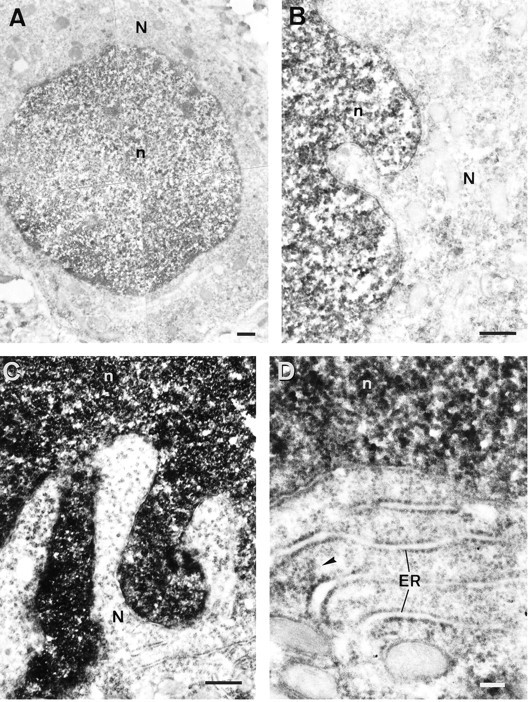
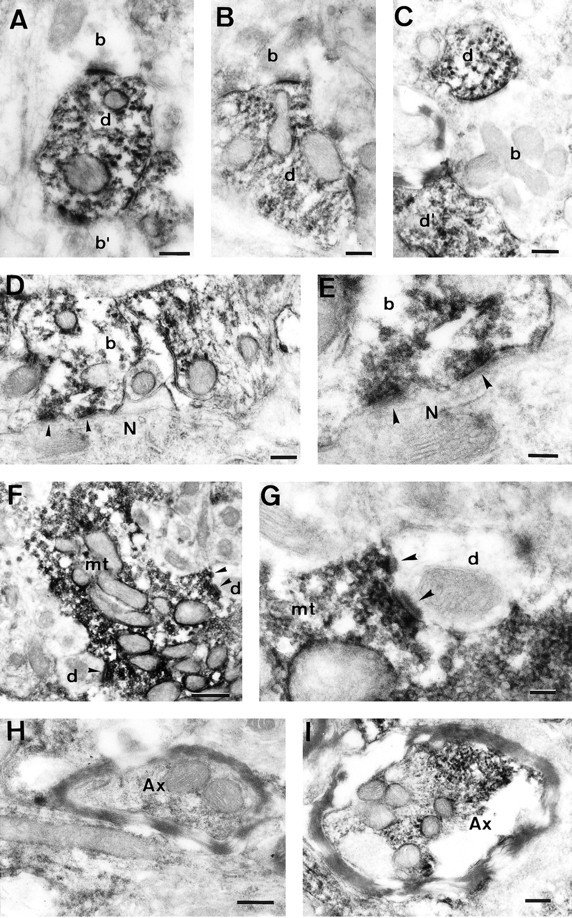
The proteasome multicatalytic proteinase (MCP) is a 20S complex that plays a major role in nonlysosomal pathways of intracellular protein degradation. A polyclonal antibody against rat liver MCP was used to investigate the distribution of MCP in the CNS of the rat and its subcellular localization within the neurons. As expected, MCP immunoreactivity (MCP-IR) was distributed ubiquitously in the rat CNS but not homogeneously. The most intensely stained neurons were the pyramidal cortical neurons of layer 5 and the motor neurons of the ventral horn in the spinal cord, which show an intense nuclear and cytoplasmatic MCP-IR and clearly stained processes. Additionally, some populations of large neurons in the mesencephalon and brainstem also displayed a moderate MCP-IR in their perikarya. The vast majority of neurons in the remaining structures did not show a strong cytoplasmatic MCP-IR, but their nuclei displayed an intense MCP-IR. The subcellular localization also was studied by immunoelectron microscopy. MCP-IR was intense in the neuronal nuclei, and significant staining also was found in the cytoplasm, dendritic, and axonic processes (including some myelinated axons) and in synaptic boutons, as illustrated in the cerebellar cortex. The distribution of MCP in the rat CNS and its subcellular localization are discussed in relation to (1) the distribution of calpain, the other major nonlysosomal cellular protease, and (2) the possible role of MCP in the degradation of regulatory proteins and key transcription factors that are essential in many neuronal responses.


Figures

Fig. 1.
Fig. 1.
Immunoblot analysis of purified MCP and total brain homogenate with anti-MCP polyclonal antibody. Proteins, purified rat brain MCP (MCP), and total brain homogenate (BRAIN) were separated in 14% SDS-polyacrylamide gels and either stained with Coomassie blue R-250 (stained gel) or blotted to nitrocellulose and probed with the anti-MCP polyclonal antibody at 1:200 dilution (Blotα-MCP). A drawing of the complete gel with the migration of appropriate molecular weight standards is shown.
Fig. 2.
Fig. 2.
Coronal sections showing MCP-IR in cortical and prosencephalic structures of the rat CNS. A, MCP-IR in the cingular cortex. The six cortical layers are defined at theleft, and the asterisk marks the white matter; the arrowheads point to the pial surface.B, Section through the rostroventral portions of the rat’s brain showing intense MCP-IR in the piriform cortex and the olfactory tubercle (Tu). The asteriskindicates the heterogeneous distribution of MCP-IR in the Tu. Thearrowheads point to the pyramidal layer of the piriform cortex. C, MCP-IR in the hippocampal formation. Note the dense MCP-IR in the granule cells of the dentate gyrus and in the pyramidal cells in fields CA1–3 of Ammon’s horn. The area inbrackets in CA1 is shown at a higher magnification inD. E, Hippocampal formation in a control section incubated with preimmune serum as primary antibody.F, Intense MCP-IR in the bed nucleus of the stria terminalis. Abbreviations for Figures 2, 3, 4, 5, 6, 7: ac, anterior commissure; Ax, axon; b, terminal bouton;BST, bed nucleus of the stria terminalis;CA1, CA2, CA3, fields CA1–3 of Ammon’s horn; CC, central canal;cc, corpus callosum; Cg, cingular cortex;CPu, caudate–putamen complex; cu, cuneate fasciculus; d, dendrite; ER, endoplasmic reticulum; Gi, gigantocellular reticular nucleus; GL, granule cell layer of the cerebellum;gr, gracile fasciculus; icp, inferior cerebellar peduncle; Int, interposed cerebellar nucleus;IOD, dorsal nucleus of the inferior olive;lfu, lateral funiculus of the spinal cord;Lat, lateral cerebellar nucleus; LV, lateral ventricle; LVe, lateral vestibular nucleus;MG, medial geniculate nucleus; ML, molecular layer of the cerebellum; mt, mossy fiber terminal; MVe, medial vestibular nucleus;N, neuron; n, nucleus;Pir, piriform cortex; RSG, retrosplenial granular cortex; S, septum; Sol M, medial nucleus of the solitary tract; vfu, ventral funiculus of the spinal cord; 16, spinal cord layers; IV, fourth ventricle; 12, hippoglossal nucleus. Scale bar (shown in D):AC, E, 1 mm;D, F, 250 μm.
Fig. 3.
Fig. 3.
Detailed MCP-IR localization in selected cortical and hippocampal regions. A, MCP-IR in the pyramidal cells from layer 5 of the retrosplenial granular cortex. Note the MCP-IR displayed by the majority of the cortical neurons and by the fine apical dendrites ascending toward the pial surface.A′, The same cortical field as in A, shown at a higher magnification. Note the nonimmunoreactive nucleoli within several of the immunoreactive nuclei and the MCP-IR of the perikarya in the larger neurons. The arrowheads point to MCP-IR in the initial segments of apical dendrites; the small arrows mark an apical dendrite traversing the cortical field.B, MCP-IR in the pyramidal neurons of the CA3 hippocampal region. B′, The same field as inB, shown at a higher magnification. MCP-IR is localized primarily in the nuclei of the pyramidal neurons; again, negative nucleoli are clearly distinguishable in some of these neurons. MCP-IR also is seen in the apical dendrites within the stratum radiatum. Scale bar (shown in B): A, B: 60 μm; A′, B′, 100 μm.
Fig. 4.
Fig. 4.
MCP-IR in different areas of the brainstem.A, Coronal section through the lateral vestibular nucleus. B, The same field as in A, shown at a higher magnification. Note the intense MCP-IR displayed by these large neurons in both the nucleus and cytoplasm and, occasionally, in the neuronal processes. C, MCP-IR in the motor nucleus of the 12th cranial nerve and in some neurons of the medial nucleus of the solitary tract. D, Neurons of the gigantocellular reticular formation. The cellular contours are clearly depicted because of the dense MCP-IR in the cytoplasm. The neurons, most of which appear out of focus at the lower portion of the micrograph, correspond to the dorsal nucleus of the inferior olive. E, Coronal section through the corpus callosum. Note the abundant MCP-IR of the cells in the white matter that mostly correspond to glial cells. Scale bar (shown in D): 120 μm.
Fig. 5.
Fig. 5.
MCP-IR in the cerebellum and spinal cord.Left, Coronal sections showing MCP-IR in different structures at low magnification. The areas in bracketsin B and C are shown in B′and C′, respectively, shown at a higher magnification.A, Cerebellar cortex; note the dense MCP-IR displayed by the Purkinje cells. A′, Cerebellar cortex shown at a higher magnification. Several Purkinje cells displaying intense MCP-IR in the nucleus are shown in the center. Note the nonimmunoreactive nucleoli as well as the lightly labeled perikarya. The arrowheads point to immunoreactive structures outlining the Purkinje cell somata, and below them, another row of Purkinje cells appears out of focus. The molecular layer displays a moderate MCP-IR in which scattered MCP-positive cell nuclei are prominent. The granule cell layer is faintly immunoreactive, whereas intensely immunoreactive cells, likely Golgi cells, are scattered in this layer. B, Deep cerebellar nuclei;B′, higher magnification of neurons in the interposed cerebellar nucleus with intense MCP-IR in their perikarya and, in some cases, in the neuronal processes (arrowheads).C, Spinal cord; C′, neurons from the anterior horn shown at a higher magnification. Scale bar (shown inC′): AC, 1 mm;A′C′, 250 μm.
Fig. 6.
Fig. 6.
Electron micrographs showing the subcellular distribution of MCP-IR. A, Medium-size neuron from the parietal cortex displaying an intense MCP-IR in the nucleus and a light immunoreactivity in the cytoplasm. B, Detail of another cortical neuron showing the dense clusters of reaction product in the nucleus. The external nuclear membrane is almost free of labeling, whereas a light and heterogeneously distributed immunoreactivity is visible in the cytoplasm. Mitochondria in the perikarya appear devoid of MCP-IR. C, Purkinje cell from the cerebellum. Again, note the dense MCP-IR in the nucleus in contrast to the low immunoreactivity in the perikarya. D, Another Purkinje cell shown at a higher magnification. Note how MCP-IR in the cytoplasm is closely associated with the endoplasmic reticulum. Thearrowhead points to a cluster of reaction product between two cisternae of endoplasmic reticulum. Scale bars:AC, 500 nm; D, 100 nm.
Fig. 7.
Fig. 7.
Electron micrographs showing MCP-IR within neuronal processes. AC, MCP-IR in several dendritic processes from the molecular layer of the cerebellum. Nonimmunoreactive terminal bouton profiles (A, B) are making asymmetric synaptic contacts with the dendritic processes. C shows a nonimmunoreactive preterminal nerve fiber closely related to immunoreactive dendritic processes. D, MCP-IR in a basket cell terminal bouton making a symmetric synaptic contact with the soma of a Purkinje cell. The arrowheads mark the points of synaptic contact. E, The same synaptic contacts as in D, but at a higher magnification.F, MCP-IR in a mossy terminal bouton within the granule cell layer of the cerebellum making asymmetric synaptic contacts with several nonimmunoreactive dendritic processes. Thearrowheads mark the points of synaptic contact.G, Higher magnification of two of the synaptic contacts shown in F. H and Iillustrate MCP-IR in two myelinated axons from the cerebral cortex and the granule cell layer of the cerebellum, respectively. Scale bars:AD, H, I, 200 nm; E, G, 100 nm; F, 500 nm.

Similar articles

Cited by

References

    1. Arribas J, Arizti P, Castaño JG. Antibodies against the C2 COOH-terminal region discriminate the active and latent forms of the multicatalytic proteinase complex. J Biol Chem. 1994;269:12858–12864. - PubMed
    1. Arribas J, Castaño JG. Kinetic studies of the differential effect of detergents on the peptidase activities of the multicatalytic proteinase from rat liver. J Biol Chem. 1990;265:13969–13973. - PubMed
    1. Arribas J, Luz-Rodriguez M, Alvarez-Do-Forno R, Castaño JG. Autoantibodies against the multicatalytic proteinase in patients with systemic lupus erythematosus. J Exp Med. 1991;173:423–427. - PMC - PubMed
    1. Arizti P, Arribas J, Castaño J G. Modulation of the multicatalytic proteinase complex by lipids, interconversion and proteolytic processing. Enzyme Protein. 1993;47:285–295. - PubMed
    1. Chain DG, Hegde AN, Yamamoto N, Liu-Marsh B, Schwartz JH. Persistent activation of cAMP dependent protein kinase by regulated proteolysis suggests a neuron-specific function of the ubiquitin system in Aplysia. J Neurosci. 1995;15:7592–7603. - PMC - PubMed

Publication types

MeSH terms

Substances