. 1996 Sep 1;16(17):5523-35.
doi: 10.1523/JNEUROSCI.16-17-05523.1996.

Expression of normal and mutant huntingtin in the developing brain

Affiliations

Expression of normal and mutant huntingtin in the developing brain

P G Bhide et al. J Neurosci. .

Abstract

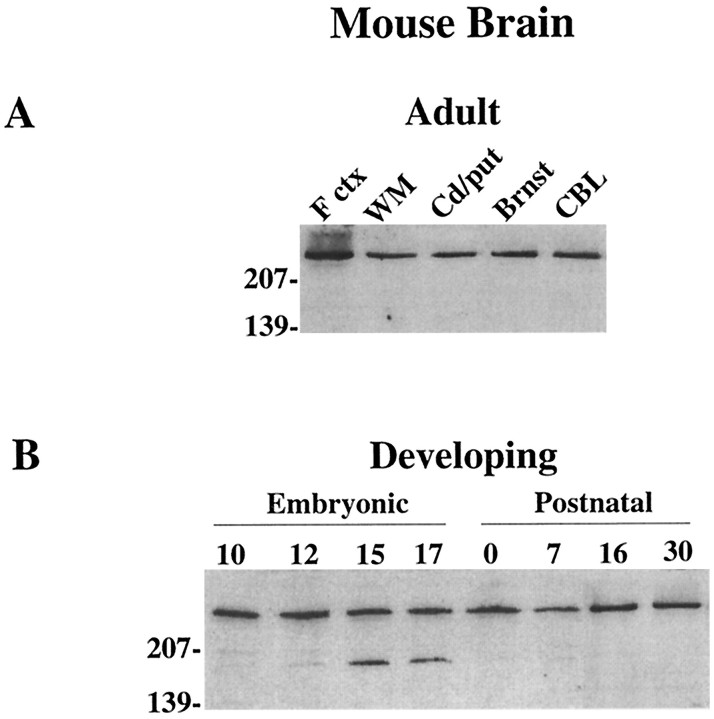
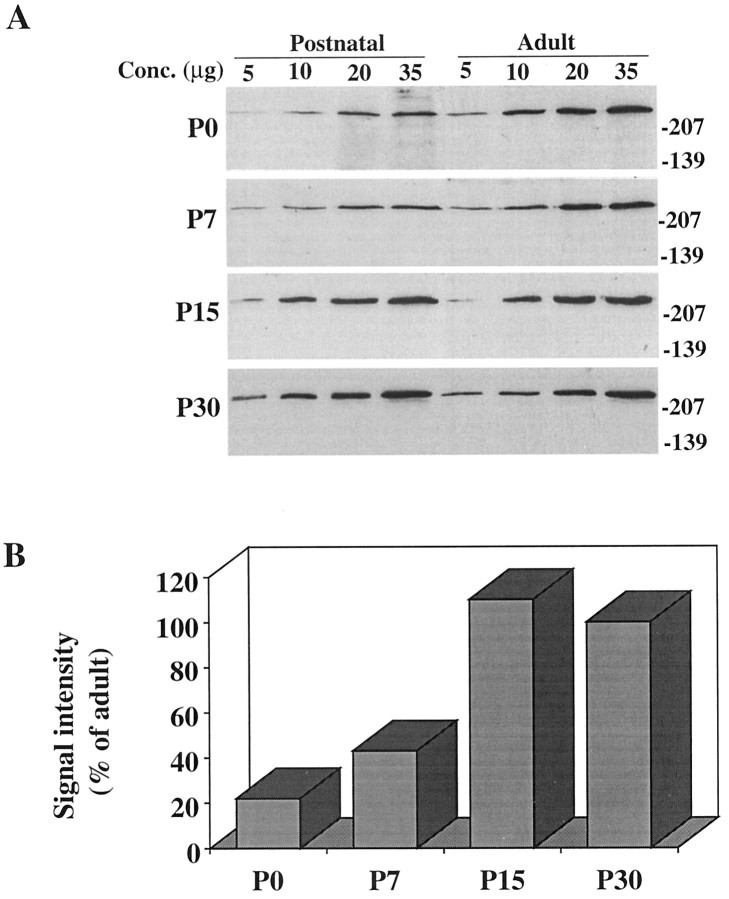
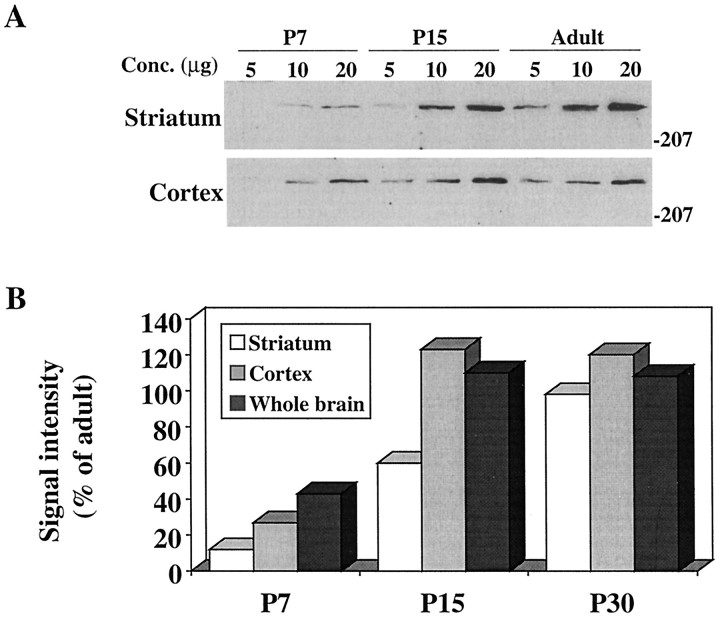
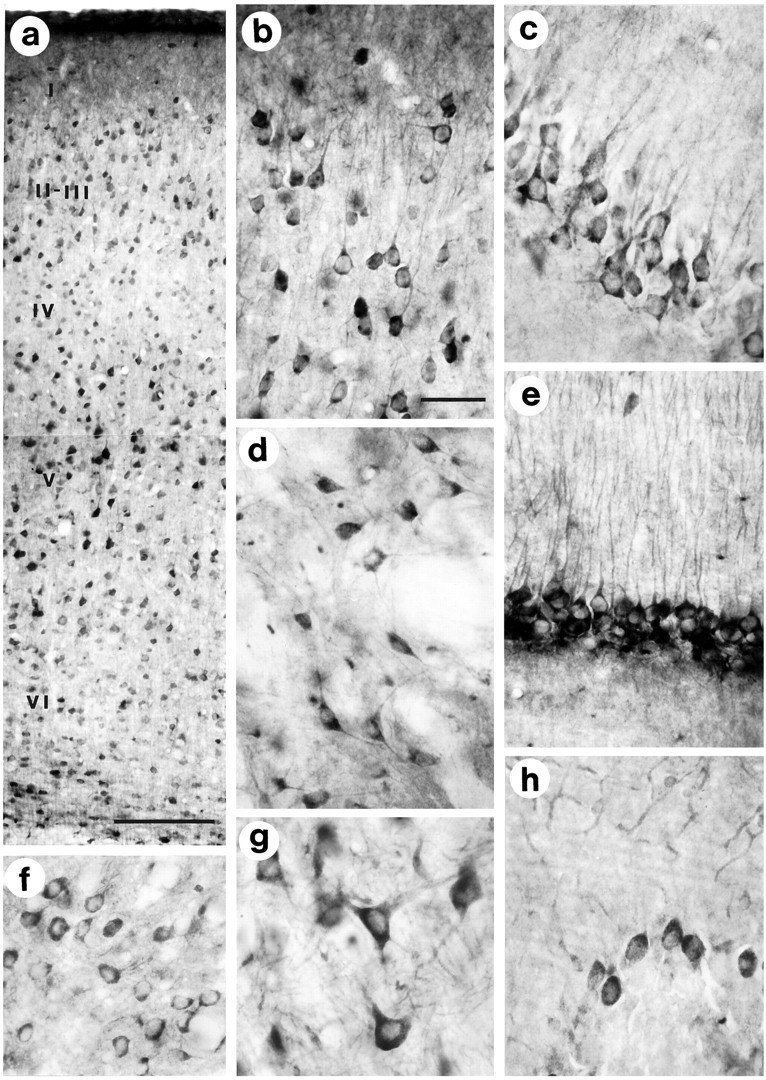
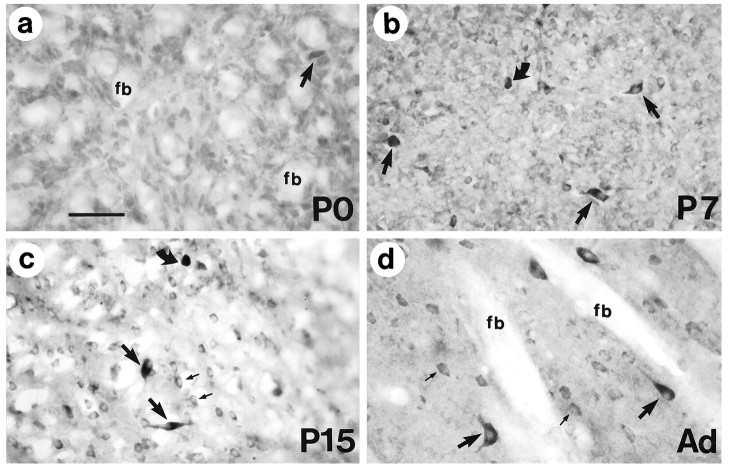
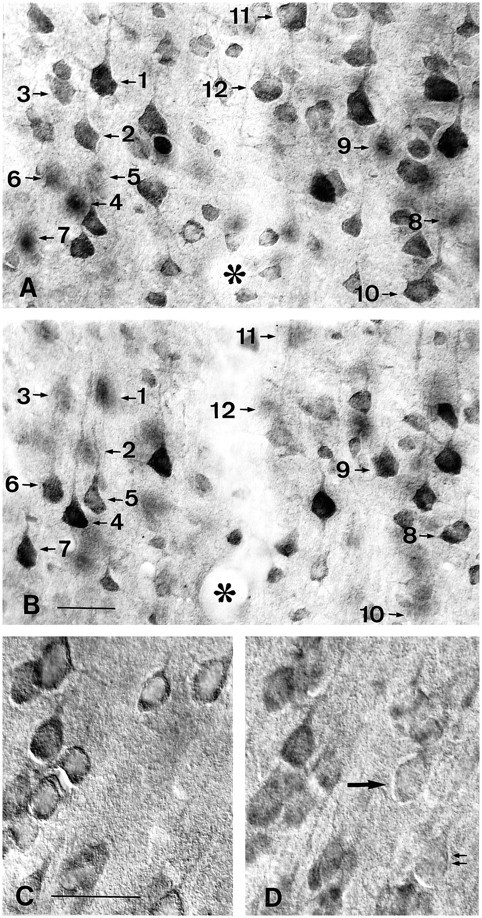
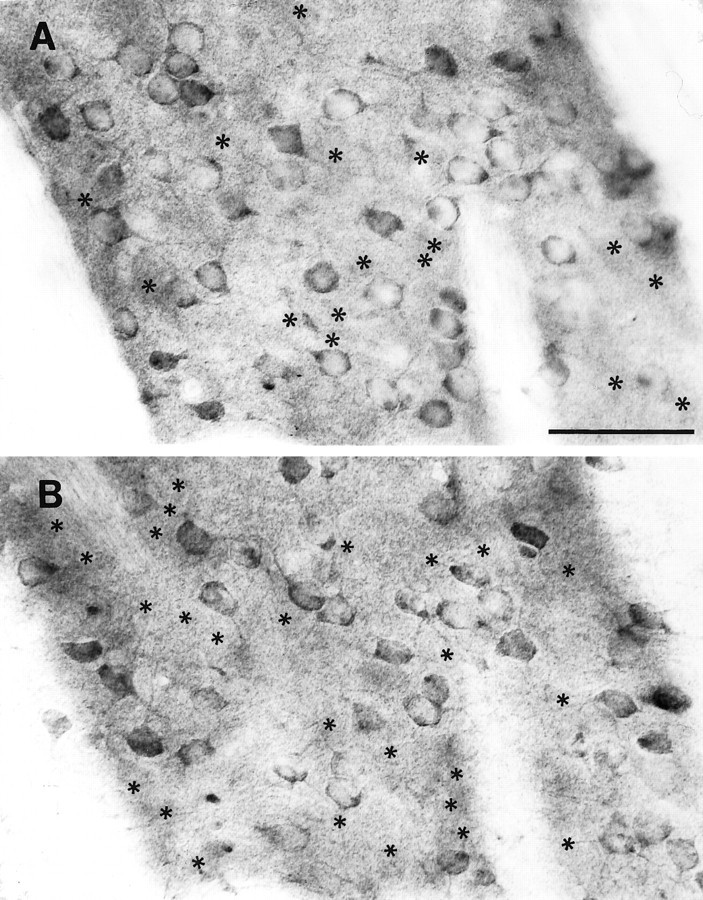
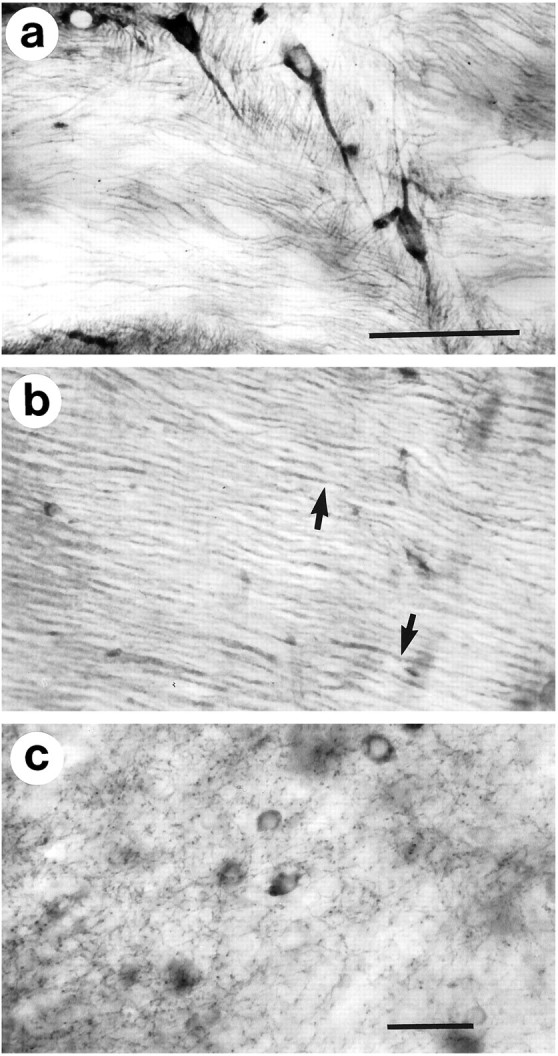
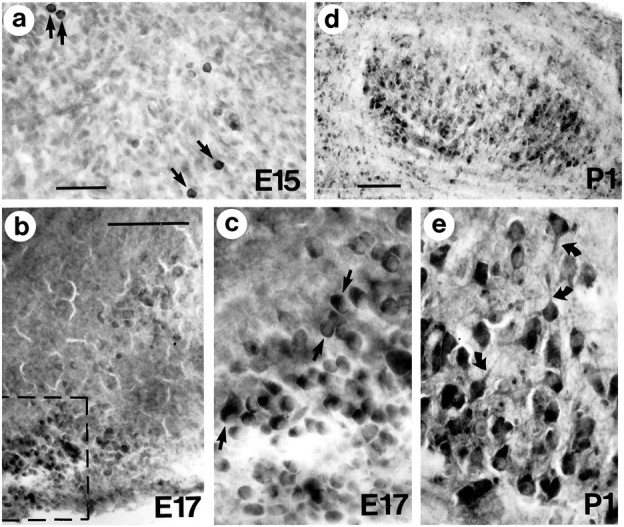
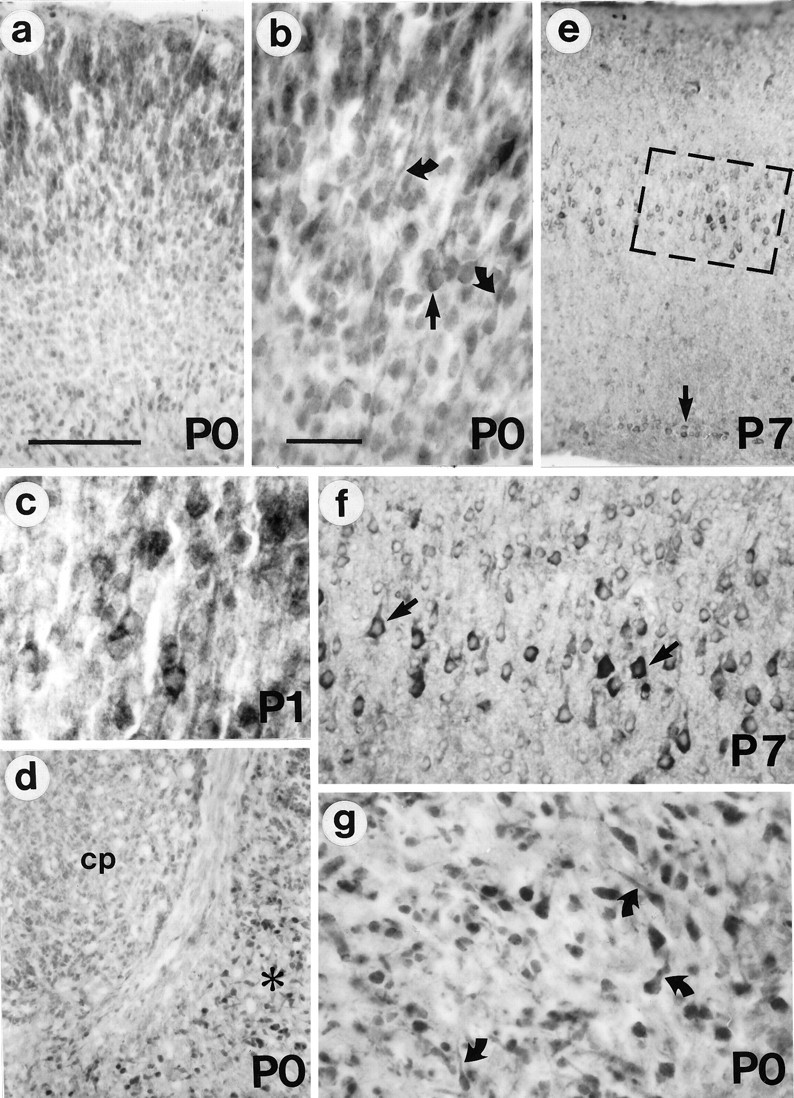
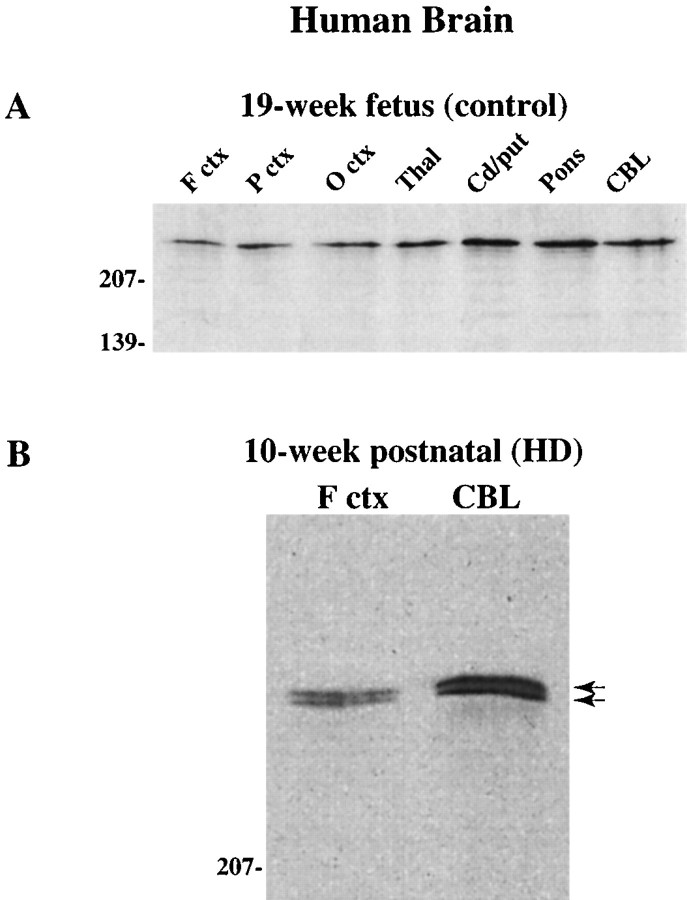
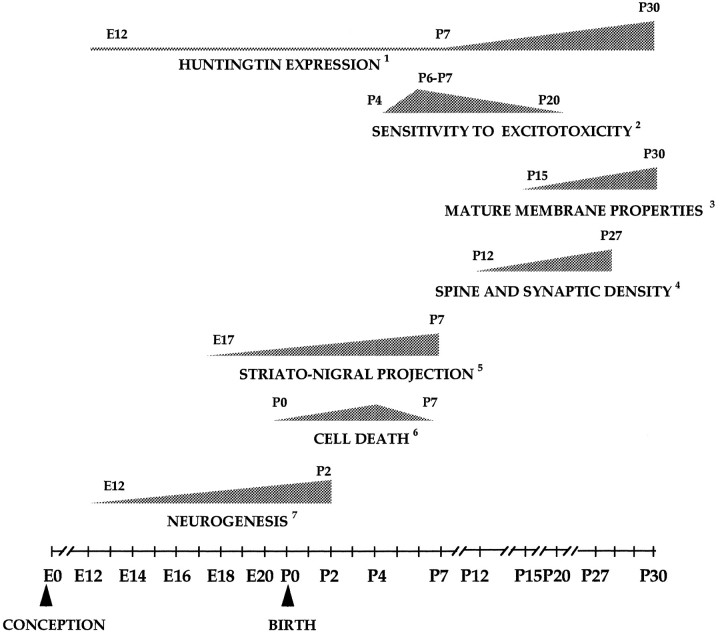
Huntington's disease (HD) is caused by a genetic mutation that results in a polyglutamine expansion in huntingtin. The time course of neuronal loss in the HD striatum and other affected brain regions before the onset of symptoms is unknown. To determine the potential influence of huntingtin on brain development, we examined its expression in the developing mouse and in human control and HD brain. By Western blot, huntingtin was detected throughout the adult mouse brain and at all stages of embryonic and postnatal brain development. The protein increased significantly between postnatal day 7 (P7) and P15, which marks a period of active neuronal differentiation and enhanced sensitivity to excitotoxic injury in the rodent striatum. Immunoreactivity was found in neurons throughout the brain and localized mostly to the somatodendritic cytoplasm and to axons in fiber bundles. Staining was variable in different groups of neurons and within the same cell population. In developing brain, huntingtin was limited primarily to neuronal perikarya. Increased immunoreactivity in large neurons followed the gradient of neurogenesis and appeared in the basal forebrain and brainstem by embryonic days 15-17, in regions of cortex by P0-P1, and in the striatum by P7. In human brain at midgestation (19-21 weeks), huntingtin was detected in all regions. The brain of a 10-week-old infant with the expanded HD allele expressed a higher molecular weight mutant form of huntingtin at levels comparable to those of the wild-type protein. Thus, mutant huntingtin is expressed before neuronal maturation is complete. Results suggest that huntingtin has an important constitutive role in neurons during brain development, that heterogeneity in neuronal expression of the protein is developmentally regulated, and that the intraneuronal distribution of huntingtin increases in parallel with neuronal maturation. The presence of mutant huntingtin in the immature HD brain raises the possibility that neurons may be affected during brain development and possibly in the postnatal period when vulnerability to excitotoxic injury is at its peak.


Figures

Fig. 4.
Fig. 4.
Huntingtin immunoreactivity in the adult mouse brain. a, Sagittal section shows huntingtin labeling throughout the brain and more prominently in the gray matter than the white matter because of the preferential staining of neuronal somata and dendrites. Some folds are present in the cortex of the cerebellum.Arrow identifies the area of cortex shown in band c. Magnification, 4×. b, Huntingtin immunoreactivity is seen in neurons throughout the cortical gray matter. c, Preadsorption control: neuronal staining in cortex is reduced significantly when peptide antigen is added to the anti-huntingtin antisera. Residual huntingtin labeling, which is faintly observed in some perikarya, is probably in neurons that normally express the highest levels of the protein.
Fig. 1.
Fig. 1.
Western blot analysis of huntingtin in adult and developing mouse brain. A, Protein extracts (15 μg/lane) from different areas of the adult mouse brain show that all regions express the huntingtin protein. F ctx, Cortex;WM, subcortical white matter; Cd/put, caudate/putamen; Brnst, brainstem; CBL, cerebellum. B, Protein extracts from whole brain at E10–E17 (Embryonic) and P0–P30 (Postnatal) show the presence of huntingtin at all stages of brain development. The lower molecular weight band that appears in lanes for E15 and E17 may be a degraded product of huntingtin proteolysis. Molecular weight markers are shown on the left.
Fig. 2.
Fig. 2.
Comparison of huntingtin expression in whole-brain extracts of the postnatal and adult mouse. A, Each Western blot compares huntingtin immunoreactivity in a P0–P30 (Postnatal) and an adult animal. Different adult mice were used in each blot. Note the lower signal intensity at each protein concentration in the P0 and P7 animals relative to the adults.B, Signal intensity of huntingtin immunoreactivity in postnatal animals relative to adult. Each bar represents the median score of all ratio values obtained in comparisons of four young animals with four adult animals. Huntingtin immunoreactivity increases between P0 and P15 and shows the most marked rise between P7 and P15. P0 and P7 less than adult at p < 0.001. Molecular weight markers are shown on the right.
Fig. 3.
Fig. 3.
Comparison of huntingtin expression in the postnatal cortex and striatum. A, Western blots of striatum (top panel) and cortex (bottom panel) from P7, P15, and adult mice. Note that signal intensity is significantly lower at P7 than in the adult brain in both regions. B, Signal intensity (median score of ratio values for each protein concentration) for huntingtin expression in P7, P15, and P30 striatum, cortex, and whole brain relative to the adult. Note that huntingtin expression increases markedly between P7 and P15 in both the striatum and the cortex in parallel with the increases seen in whole brain. Huntingtin expression reaches adult levels in cortex by P15 and in striatum by P30. Mann–Whitney nonparametric analysis: P7 cortex less than adult cortex at p < 0.01. P7 and P15 striatum less than adult striatum at p < 0.01. Molecular weight markers are shown on the right.
Fig. 5.
Fig. 5.
Huntingtin immunoreactivity in the adult mouse brain is localized to the cytoplasm of neurons. Neuronal perikarya and dendrites are labeled in all regions of the brain.a, b, The cerebral cortex: neurons throughout layers II–VI are labeled, and the perikarya and proximal dendrites of layer II/III (shown in b) and layer V pyramidal neurons show especially strong immunoreactivity. c, e, The hippocampal region: pyramidal cells in the CA1 region (c) and perikarya and dendrites of granule cells in the dentate gyrus (e) are strongly immunoreactive. A similar pattern of immunoreactivity of neuronal perikarya and dendrites is present in the thalamus (f), globus pallidus (d), brainstem (g), and cerebellar Purkinje cell layer (h). In the cerebellum cortex, Purkinje cells are stained more prominently than other neurons. All photographs were taken from the same vibratome-cut tissue section. Scale bars: a, 100 μm; b (for b–h), 50 μm.
Fig. 11.
Fig. 11.
Ontogeny of huntingtin immunoreactivity in the mouse corpus striatum. a, On the day of birth (P0), immunoreactivity in the striatum is uniformly weak, and fiber bundles (fb) appear unlabeled. A few large cells are slightly more labeled (arrow).b, By P7, the labeling of most cell bodies is more distinct than at P0 (compare a withb). The cell bodies and proximal processes of some large cells (arrows) and small cells (curved arrow) become intensely immunoreactive. c, A pattern of heterogeneous immunoreactivity, wherein large cells (arrows) show intense immunoreactivity of the perikarya and proximal processes and smaller cells are less intensely immunoreactive (small arrows), is seen on P15. Note that some of the cells with intense staining have not reached a large size (curved arrow). d, Adult striatum (Ad) shows the marked difference in expression of huntingtin in medium (small arrows) and large neurons (large arrows). Primary antibody was diluted fourfold compared with sections shown ina–c. Fiber bundles (fb) are unlabeled because of the low concentration of the primary antibody used in the immunohistochemistry. Scale bar: a, 50 μm, and applies tob–d.
Fig. 6.
Fig. 6.
Demonstration of the extent and variability of huntingtin staining in adult cortical neurons with Nomarski imaging.a, b, The same cortical field photographed at the surfaces of the upper and lower focal planes of the section. Note that different neurons are labeled in each focal plane. For example, neurons 1–3 and 10–12 are visible in a but not in b, and neurons 4–6 and 8 and 9 are visible in b but not in a. Staining is also variable in neurons within the focal plane (compare1, 2, and 3 in a andand 5 in b). c, d, The same field photographed at the upper surface in c and deeper in the section (d) to show the effect of antibody penetration on neuronal labeling. Note that in the superficial plane (c) all cells are immunoreactive, whereas in the intermediate focal plane faintly labeled (single arrow) and unlabeled (double arrow) cells are seen. Asteriskidentifies the lumen of a capillary passing through the center of the field. Scale bars: b, 50 μm, and also applies toa; c, 50 μm, and also applies tod.
Fig. 7.
Fig. 7.
Demonstration of the extent of huntingtin labeling in medium-sized striatal neurons of the adult mouse.A, B, The upper and lower focal planes of the same field. Asterisks in A identify the position of labeled neurons seen only in B, and asterisksin B identify the position of labeled neurons seen only inA. Not all cells are identified. Many more neurons are labeled when both planes of section are taken into account. The intensity of staining is also variable. Scale bar (shown inA): 50 μm, also applies to B.
Fig. 8.
Fig. 8.
Huntingtin immunoreactivity in axon trunks and terminals in the adult mouse brain. Axon trunks are labeled in the internal capsule (a) and the cerebellar peduncle (b). Individual axons can be distinguished in the cerebellar peduncle (arrows in b). Immunoreactive puncta interpreted to be axon terminals appear in the thalamus when minimally fixed frozen sections are pretreated with methanol (see Materials and Methods). c, Neuronal cell bodies are also labeled. Scale bars: a, 50 μm, and applies to b; c, 50 μm.
Fig. 9.
Fig. 9.
Huntingtin immunoreactivity in embryonic and early postnatal mouse brain. a, By E15, the perikarya of some basal forebrain neurons acquire intense immunoreactivity (arrows in a). Note that cells of comparable or smaller size located near the intensely labeled cells are still weakly immunoreactive. b, Clusters of brainstem neurons show increased labeling in E17 mouse brain. c, Enlargement of framed area in b. Note the intense staining of the cytoplasm (arrows) but the absence of labeling in processes.d, By P1, huntingtin-positive neurons contribute to the segregated clusters of brainstem nuclei. e, Brainstem neurons at higher magnification show robust labeling in perikarya and emerging processes (curved arrows). Scale bars:a, 50 μm, and applies to c and e;b, 100 μm; d, 200 μm.
Fig. 10.
Fig. 10.
Huntingtin immunoreactivity in neonatal mouse brain. a, By P0, the cerebral cortex exhibits immunoreactivity in all neurons. b, In the upper cortical layers, the somata (arrow) and leading processes of some of the labeled cells show the characteristic morphology of migrating neurons (curved arrows). c, P1 pyramidal neurons become more intensely labeled than other cortical cells. d, Some cells in the P0 pyriform cortex (asterisk) are intensely stained, but the caudate/putamen (cp) is stained more weakly. e, f, In the P7 cortex, the labeling of layer V pyramidal neurons is striking (boxed area is enlarged inf). At this age, some layer VI neurons are also intensely labeled (arrow in e). g, P0 pyriform cortex. Note the increased staining in pyramidal somata and emerging processes (curved arrows). Scale bars:a, 100 μm, and also applies to d ande; b, 50 μm, and also applies to c,f, g.
Fig. 12.
Fig. 12.
Huntingtin expression in human control and HD brain. A, Western blot of 19-week fetal human control brain probed with Ab1 shows expression in all brain regions. For identification of regions, see legend to Figure 1. B, Brain of 10-week-old infant genotyped for a normal allele of 17 CAG repeats and an expanded HD allele of 39 repeats. Note that normal and mutant huntingtin (arrows) are detected in the cortex and cerebellum of this patient.
Fig. 13.
Fig. 13.
Temporal relationship between huntingtin expression and other developmental events in the rodent corpus striatum between embryonic day 0 (E0, the day of conception) and postnatal day 30 (P30). The temporal progression of a given event is depicted by the stippled triangular icons. For each icon, the days of onset and completion of the particular event are indicated. The slope of an icon is an approximation and not an accurate representation of the rate of progression of the corresponding event. Where possible, the peak incidence of a given event is also indicated.1The depiction of increasing huntingtin expression in the postnatal striatum is based on observations in this study obtained from Western blots and immunohistochemistry in mice. All other data are from studies on rats and were obtained from the following sources:2MacDonald et al., 1988; Ikonomidou et al., 1989; Trescher et al., 1994; 3Tepper and Trent, 1993; 4Tepper and Trent, 1993;5Fishell and Van der Kooy, 1987, ;6Fentress et al., 1981; Fishell and Van der Kooy, 1991; 7Bayer, 1984; Van der Kooy and Fishell, 1986; Bayer and Altman, 1987; Fishell and Van der Kooy, 1991.

Similar articles

Cited by

References

    1. Albin R, Greenmayre JT. Alternative excitotoxic hypotheses. Neurology. 1992;42:733–738. - PubMed
    1. Albin RL, Reiner A, Anderson KD, Dure LS, IV, Handelin B, Balfour R, Whetsell WO, Jr, Penney JB, Young AB. Preferential loss of striato-external pallidal projection neurons in presymptomatic Huntington’s disease. Ann Neurol. 1992;31:425–430. - PubMed
    1. Andrew SE, Goldberg YP, Kremer B, Telenius H, Theilmann J, Adam S, Starr E, Squitieri F, Lin B, Kalchman MA, Graham RK, Hayden MR. The relationship between trinucleotide (CAG) repeat length and clinical features of Huntington’s disease. Nature Genet. 1993;4:398–403. - PubMed
    1. Aronin N, Chase K, Christine Y, Sapp E, Schwarz C, Matta N, Kornreich R, Landwehrmeyer B, Bird E, Beal MF, Vonsattel JP, Smith T, Carraway R, Boyce FM, Young AB, Penney JB, DiFiglia M. CAG expansion affects the expression of mutant huntingtin in the Huntington’s disease brain. Neuron. 1995;15:1193–1201. - PubMed
    1. Bayer SA. Neurogenesis in the rat neostriatum. Int J Dev Neurosci. 1984;2:163–175. - PubMed

Publication types