. 2025 Feb;44(3):781-800.
doi: 10.1038/s44318-024-00355-3. Epub 2025 Jan 3.

Partitioning of fatty acids between membrane and storage lipids controls ER membrane expansion

Affiliations

Partitioning of fatty acids between membrane and storage lipids controls ER membrane expansion

Pawel K Lysyganicz et al. EMBO J. 2025 Feb.

Abstract

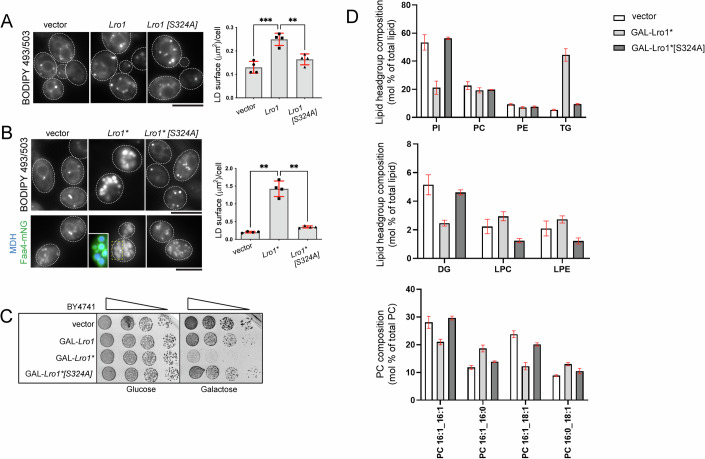
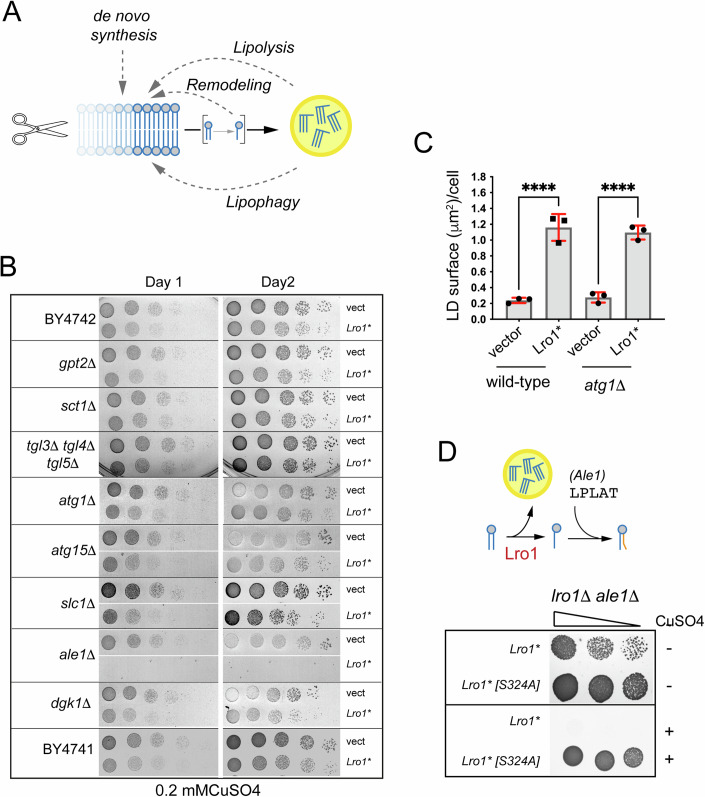
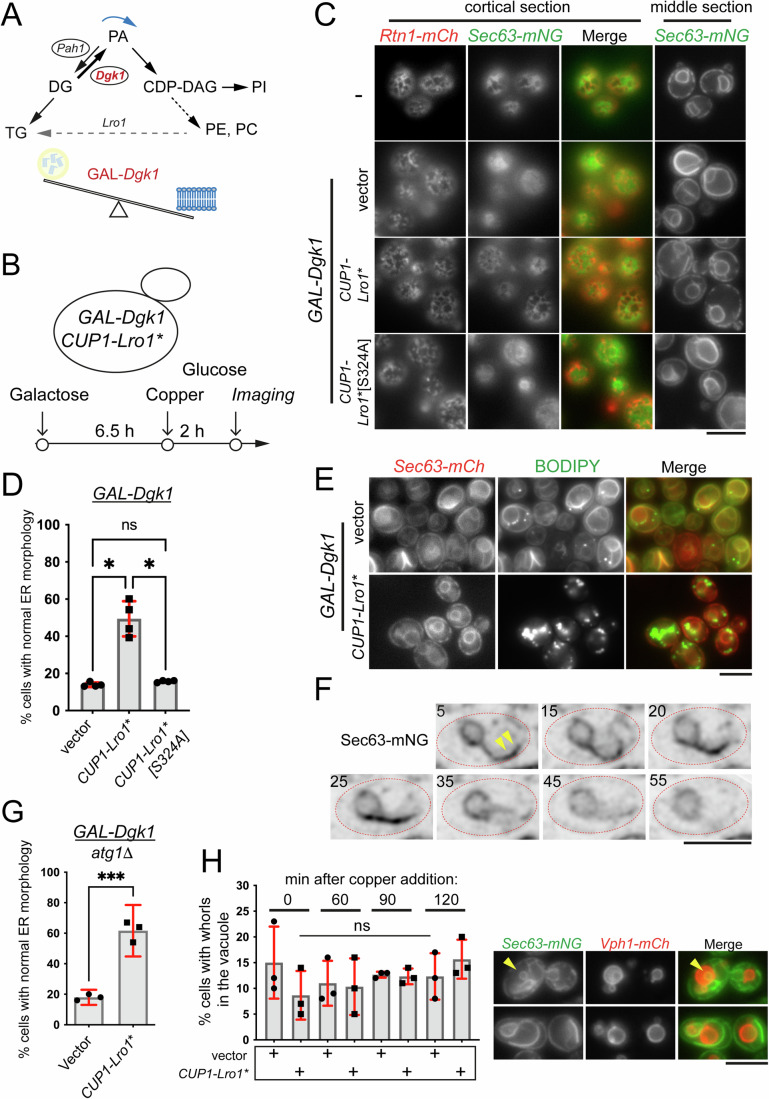
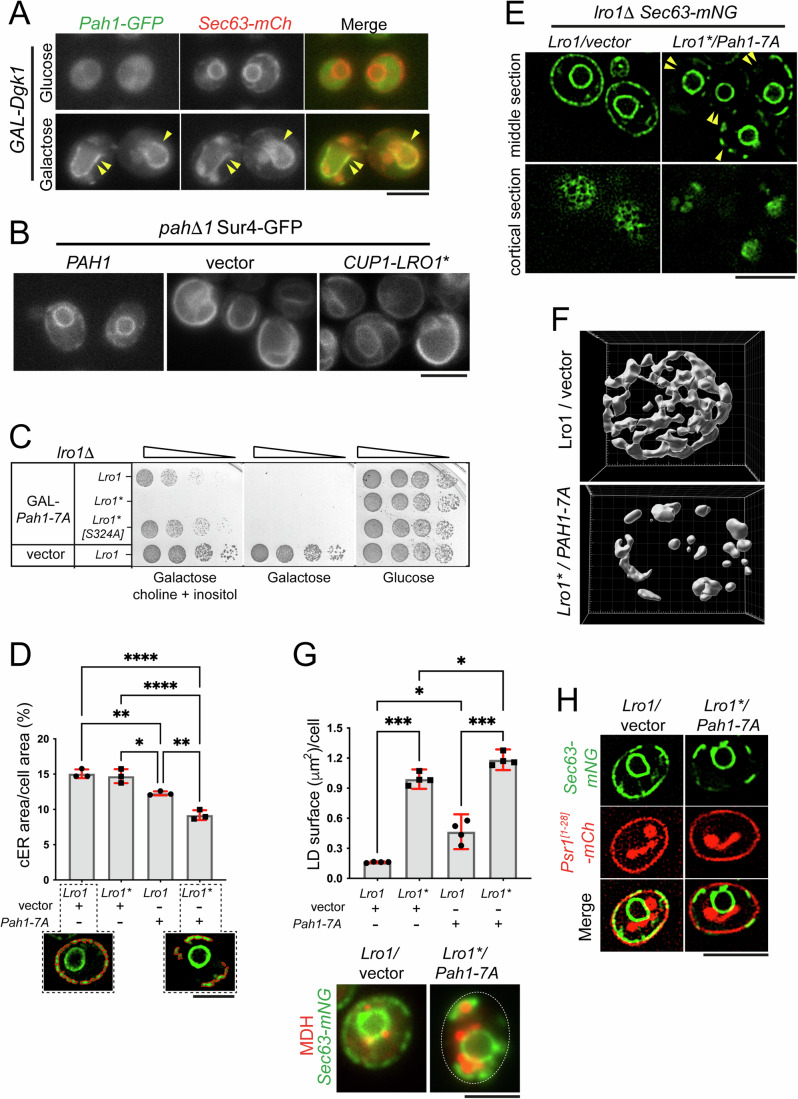
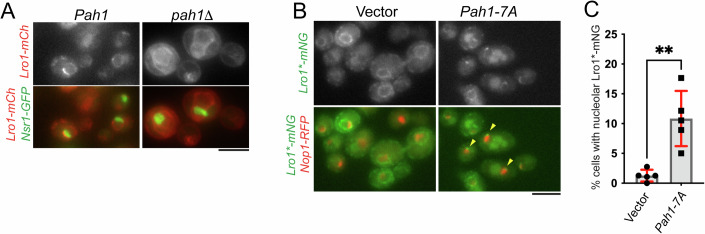
Biogenesis of membrane-bound organelles involves the synthesis, remodeling, and degradation of their constituent phospholipids. How these pathways regulate organelle size remains poorly understood. Here we demonstrate that a lipid-degradation pathway inhibits expansion of the endoplasmic reticulum (ER) membrane. Phospholipid diacylglycerol acyltransferases (PDATs) use endogenous phospholipids as fatty-acyl donors to generate triglyceride stored in lipid droplets. The significance of this non-canonical triglyceride biosynthesis pathway has remained elusive. We find that the activity of the yeast PDAT Lro1 is regulated by a membrane-proximal helical segment facing the luminal side of the ER bilayer. To reveal the biological roles of PDATs, we engineered an Lro1 variant with derepressed activity. We show that active Lro1 mediates retraction of ER membrane expansion driven by phospholipid synthesis. Furthermore, subcellular distribution and membrane turnover activity of Lro1 are controlled by diacylglycerol produced by the activity of Pah1, a conserved member of the lipin family. Collectively, our findings reveal a lipid-metabolic network that regulates endoplasmic reticulum biogenesis by converting phospholipids into storage lipids.

Keywords: Endoplasmic Reticulum; Lipid Droplet; Membrane; Phospholipid; Yeast.


Conflict of interest statement

Disclosure and competing interests statement. The authors declare no competing interests.

Figures

Figure 1
Figure 1. A predicted membrane-proximal helical segment in the yeast PDAT Lro1.
(A) Schematic depicting the major lipid metabolic pathways in yeast and the activity of Lro1; PA phosphatidate, DG diacylglycerol, TG triacylglycerol, FA-CoA fatty-acyl-CoA, LPE lysophosphatidylethanolamine, LPC lysophosphatidylcholine, PE phosphatidylethanolamine, PC phosphatidylcholine, PI phosphatidylinositol. (B) Schematic of the topology of Lro1 with respect to the nuclear/ER membrane. The catalytic triad within the PDAT domain is indicated. The various secondary structure prediction results for the sequence that links the transmembrane helix to the PDAT domain are shown. The boxed sequence denotes residues Ser104 to Asp152. H, alpha helix; E, beta strand; M, transmembrane domain. Data are from the HHpred Quick2D tool (Zimmermann et al, 2018). (C) Models of wild-type Lro1 (left) and Lro1* (right). The Ser104–Asp152 domain is colored red and the residues of the active site are shown as purple spheres. The bottom panels depict the same models rotated by 90 degrees. The transmembrane helices are colored blue. The dashed lines indicate the position of the lipid bilayer. The models were built from residue R71 to M661.
Figure 2
Figure 2. Removal of a luminal helical segment generates a hyperactive Lro1 enzyme.
(A) Schematic of Lro1 mutants and their topology with respect to the nuclear/ER membrane. The INM targeting sequence (Heh1-NLS) is indicated. (B) Exponentially growing 4Δ cells carrying an empty vector or the indicated Lro1 constructs were stained with BODIPY 493/503 to label LDs; the dotted lines indicate the cell contours. (C) Quantification of the BODIPY 493/503 labeling shown in (B); data are shown as means ± SD from five experiments with at least 140 cells measured per strain per experiment. Statistical analysis was performed by Forsythe and Welch ANOVA test with Dunnett’s T3 correction; ***P < 0.001 (Lro1-mCh vs Lro1*-mCh P = 0.001; Lro1-mCh vs H1-Lro1*-mCh P = 0.0005). (D) Lipid composition of the indicated strains in the exponential phase of growth. Cells were grown in the presence of [2-14C]acetate, and lipids were extracted, separated, and quantified by one-dimensional TLC as described in Methods; each data point represents the mean ± SD from at least three experiments. DG diacylglycerol, Erg ergosterol, ErgE ergosterol ester, FA fatty acid, PL phospholipid, TG triacylglycerol. (E) Cells were grown in selective media and spotted serially on YEPD plates in the absence or presence of two different concentrations of oleate. Plates were grown at 30 °C and scanned after one or 2 days. (F) lro1Δ cells expressing a chromosomally integrated nucleolar reporter (Nsr1-GFP) and the denoted Lro1-mCh proteins were visualized at the exponential (EXP) or PDS phases of growth. Scale bars in all micrographs, 5 μm. Source data are available online for this figure.
Figure 3
Figure 3. Elevated PDAT activity disrupts phospholipid and cell homeostasis.
(A) Wild-type cells carrying an empty vector or the indicated Gal-Lro1 constructs were grown in galactose-containing media for five hours and stained with BODIPY 493/503; data are shown as means ± SD from four experiments with at least 250 cells measured per strain per experiment. Statistical analysis was performed by one-way ANOVA with Šidák correction; **P < 0.01, ***P < 0.001 (vector vs Lro1 P = 0.0003; Lro1 vs Lro1[S324A] P = 0.0029). (B) Same as in A but expressing the denoted Gal-Lro1* constructs; lower panels: maximum intensity projections of cells expressing Faa4-mNG; inset shows cells co-stained with monodansylpentane (MDH) to stain LDs; data are shown as means ± SD from four experiments with at least 190 cells measured per strain per experiment. Statistical analysis was performed by Forsythe and Welch ANOVA with Dunnett’s T3 correction; **P < 0.01 (vector vs Lro1* P = 0.0037; Lro1* vs Lro1*[S324A] P = 0.0055). (C) Cells carrying the indicated constructs were spotted serially on synthetic plates containing glucose or galactose. Cells were grown at 30 °C and scanned after 2 days. (D) Wild-type cells (BY4741) carrying the indicated constructs were grown in galactose as in (A) and processed for lipidomics analysis as described in Methods. Data are means ± SD from three experiments. Scale bars in all micrographs, 5 μm. Source data are available online for this figure.
Figure 4
Figure 4. Molecular dynamics simulations of Lro1*.
(A) Schematic and topology of Lro1, Lro1* and Lro1 GS string mutant. (B) 4Δ cells carrying an empty vector or the indicated constructs were grown in selective media and spotted serially on YEPD plates in the absence or presence of two different concentrations of oleate. Cells were grown at 30 °C for 2 days. (C) 4Δ cells, expressing Lro1 or Lro1 GS string, were stained with BODIPY 493/503 in the exponential or stationary phases and the LD size was quantified. Data shown as mean ± SD of five (exponential) or seven (stationary) experiments with at least 200 cells measured per strain per experiment and per growth phase. Welch’s t test was performed for cells in exponential growth while unpaired t-test was performed for cells in stationary phase; ns, not significant; right panels: representative cells labeled by BODIPY 493/503 are shown; scale bar, 5 μm. (D) Coarse-grained molecular dynamics simulations in model phospholipid membrane. Changes in membrane distortions are observed when comparing Lro1 and Lro1*, which are shown as a gray surface representation. In Lro1, the lipid bilayer remains planar while in Lro1* the lipid headgroups access the active site. (E) Membrane and solvent interactions of Lro1 and Lro1* shown as color representations. Lro1* shows more contacts with the membrane. Source data are available online for this figure.
Figure 5
Figure 5. A targeted screen for genetic interactors of Lro1*.
(A) Schematic of pathways that could compensate elevated PDAT activity in yeast. (B) Wild-type (BY4741 or BY4742) or the denoted mutants, carrying an empty vector or a high-copy plasmid expressing Lro1* under the control of the Cup1 promoter were spotted on synthetic plates containing copper sulphate and scanned after one or 2 days. (C) Quantification of the BODIPY 493/503 labeling of the denoted strains. Data are means ± SD from three experiments with at least 160 cells measured per strain per experiment. Statistical analysis was performed by one-way ANOVA with Šidák correction; ****P < 0.0001. (D) Upper panel: schematic of the activities of Lro1 and Ale1; lower panel: the lro1Δ ale1Δ mutant carrying low-copy plasmids expressing the denoted Lro1* alleles under the control of the Cup1 promoter, was spotted on plates with or without copper sulphate. Source data are available online for this figure.
Figure 6
Figure 6. PDAT activity counteracts ER membrane expansion.
(A) Role of Pah1 and Dgk1 activity in phospholipid synthesis. (B) Schematic of the experimental setup used; yeast cells expressing (a) an ER reporter (Sec63-mCh, Sec63-mNG or Sec63-mNG together with Rtn1-mCh), (b) a Gal1/10-inducible Dgk1, or an empty vector, and (c) a Cup1-inducible Lro1*, or Lro1*[S324A] or an empty vector, were grown in galactose-containing media for 6.5 h to induce ER membrane expansion and then transferred to medium containing glucose and 0.2 mM copper sulphate to induce Lro1*. (C) Representative ER morphology at the end point of the assay as described in (B) (“Imaging”); both cortical and middle sections of wild-type (top panels) or Gal-Dgk1-overexpressing cells (lower panels) carrying the indicated plasmids are shown. (D) Quantification of Sec63-mCh-expressing cells with normal ER morphology at the end point of the assay; data are means from four experiments ± SD with at least 130 cells measured per strain per experiment. Statistical analysis was performed by Forsythe and Welch ANOVA with Dunnett’s T3 correction; * for P < 0.05 (vector vs Cup1-Lro1* P = 0.012; Cup1-Lro1* vs Cup1-Lro1*[S324A] P = 0.0136). (E) Cells at the end point of the assay were stained with BODIPY to label LDs. (F) Time-lapse imaging of cells grown as detailed in (B), to express sequentially Gal-Dgk1 and Cup1-Lro1*. The sequence starts after cells were growing for 50 min in glucose/copper sulphate-containing media, corresponding to time point 0 of the time-lapse. Individual frames and the time points (in min) when they were captured are shown; arrowheads point to the expanded ER; the dotted lines indicate the cell contours. (G) atg1Δ cells expressing Sec63-mCh were processed as described in B and the percentage of cells with normal ER morphology at the end point of the assay was calculated. Data are means ± SD from three experiments with at least 90 cells were measured per strain per experiment. Statistical analysis was performed by an unpaired t test; ***P < 0.001 (vector vs Cup1-Lro1* P = 0.0004). (H) Cells co-expressing Sec63-nNG and Vph1-mCh were processed as shown in B and the percentage of Sec63-mNG-containing whorls inside the vacuole during the time-course was quantified. Data are means ± SD from three experiments with at least 70 cells measured per strain per experiment. Statistical analysis was performed by one-way ANOVA; ns, not significant; right panel: representative cells with (top panels) or without (lower panels) vacuolar ER whorls; the arrowhead points to an example of a vacuolar ER whorl. Scale bars in all micrographs, 5 μm. Source data are available online for this figure.
Figure 7
Figure 7. DG levels control PDAT activity and promote ER membrane degradation.
(A) Cells co-expressing Pah1-GFP and Sec63-mCh and carrying a Gal-Dgk1 plasmid were grown in glucose or galactose-containing media for 6.5 h; arrowheads point to Pah1-GFP recruited onto the expanded ER membrane. (B) pah1Δ cells expressing Sur4-GFP to visualize ER morphology and the indicated plasmids, were grown for 8 h in the presence of 0.2 mM copper to induce Lro1*. (C) lro1Δ cells carrying the indicated plasmids were spotted serially on glucose or galactose-containing plates with or without inositol and choline and grown for 3 days at 30 °C. (D) lro1Δ cells expressing Sec63-mNG and complemented by Lro1 or Lro1* were transformed with either an empty vector of Gal-Pah1-7A; cells were grown in galactose-containing media for 5 h and imaged by super-resolution microscopy. Quantification of cortical ER area was done as described in “Methods”. Data are means ± SD from three experiments with at least 38 cells measured per strain per experiment. Statistical analysis was performed by one-way ANOVA with Šidák correction; *P < 0.05, **P < 0.01, ****P < 0.0001 (vector/Lro1 vs Pah1-7A/Lro1 P = 0.0032; vector/Lro1 vs Pah1-7A/Lro1* P < 0.0001; vector/Lro1* vs Pah1-7A/Lro1 P = 0.0127; vector/Lro1* vs Pah1-7A/Lro1* P < 0.0001; Pah1-7A/Lro1 vs Pah1-7A/Lro1* P = 0.0018); lower panels: representative examples of cells with segmented cortical ER for area quantification. (E) Representative middle or cortical confocal sections depicting ER morphology of lro1Δ cells quantified in (D); arrowheads point to cortical areas lacking ER membrane. (F) Cortical ER membrane morphology of cells expressing Sec63-mNG reconstructed from confocal sections obtained as described in Methods. (G) lro1Δ cells complemented by Lro1 or Lro1* and carrying an empty vector of Gal-Pah1-7A were grown as in (D), labeled with BODIPY and LDs were quantified. Data are means ± SD from four experiments with at least 140 cells measured per strain per experiment. Statistical analysis was performed by Forsythe and Welch ANOVA with Dunnett’s T3 correction; *P < 0.05, *** for P < 0.001 (vector/Lro1 vs vector/Lro1* P = 0.0004; vector/Lro1 vs Pah1-7A/Lro1 p = 0.0423; vector/Lro1* vs Pah1-7A/Lro1* P = 0.0234; Pah1-7A/Lro1 vs Pah1-7A/Lro1* P = 0.0005); lower panels: lro1Δ cells expressing Sec63-mNG and the denoted plasmids were grown as in (D) and labeled with MDH; the dotted line indicates the cell contour. (H) Wild-type cells expressing Sec63-mNG and the 28 amino-terminal residues of Psr1 fused to mCherry to visualize the plasma membrane (Siniossoglou et al, 2000) and the denoted plasmids, were grown and imaged as in (D); note that Psr1[1-28]-mCh accumulates also in the vacuole. Scale bars in (A, B, E, H), 5 μm; in (D, G), 3 μm. Source data are available online for this figure.
Figure 8
Figure 8. The distribution of Lro1 within the ER membrane is controlled by DG levels.
(A) Distribution of Lro1-mCh in wild-type (Pah1) or pah1Δ cells expressing a chromosomally integrated Nsr1-GFP to visualize the nucleolus. (B) Distribution of Lro1*-mNG in lro1Δ cells expressing Nop1-RFP to visualize the nucleolus and the denoted plasmids; cells were grown in galactose-containing media for 3 h; arrowheads point to Lro1*-mNG in close proximity to the nucleolus. (C) Percentage of cells that show the association of Lro1*-mNG with the nucleolus following the expression of Pah1-7A; data are means of five experiments ± SDs with at least 140 cells measured per strain per experiment. Statistical analysis was performed by Welch’s t test; **P < 0.01 (vector vs Pah1-7A P = 0.0087). Scale bars in all micrographs, 5 μm. Source data are available online for this figure.
Figure EV1
Figure EV1. Wild-type cells (BY4741) carrying the indicated constructs were grown in galactose as in Fig. 3A and processed for lipidomics analysis as described under Methods; data are means ± SD from three experiments.
(A) Analysis of the major PE species. (B) Analysis of PI species; PI data are shown both as nmoles/gr (top panel) and mol% of total PI (bottom panel).

Update of

Similar articles

References

    1. Abraham MJ, Murtola T, Schulz R, Páll S, Smith JC, Hess B, Lindahl E (2015) GROMACS: high performance molecular simulations through multi-level parallelism from laptops to supercomputers. SoftwareX 1–2:19–25
    1. Bahja J, Stewart NA, Dymond MK (2022) Oxidative stress is inhibited by plant-based supplements: a quantitative lipidomic analysis of antioxidant activity and lipid compositional change. Adv Redox Res 6:100054 - PMC - PubMed
    1. Barbosa AD, Lim K, Mari M, Edgar JR, Gal L, Sterk P, Jenkins BJ, Koulman A, Savage DB, Schuldiner M et al (2019) Compartmentalized synthesis of triacylglycerol at the inner nuclear membrane regulates nuclear organization. Dev Cell 50:755–766.e756 - PMC - PubMed
    1. Benghezal M, Roubaty C, Veepuri V, Knudsen J, Conzelmann A (2007) SLC1 and SLC4 encode partially redundant acyl-coenzyme A 1-acylglycerol-3-phosphate O-acyltransferases of budding yeast. J Biol Chem 282:30845–30855 - PubMed
    1. Bernetti M, Bussi G (2020) Pressure control using stochastic cell rescaling. J Chem Phys 153:114107 - PubMed

MeSH terms

LinkOut - more resources