The dynamics of capillary flow in an open-channel system featuring trigger valves
- PMID: 39738276
- PMCID: PMC11686082
- DOI: 10.1038/s41598-024-82329-3
The dynamics of capillary flow in an open-channel system featuring trigger valves
Abstract
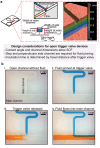
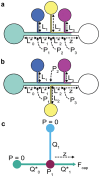
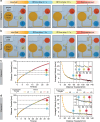
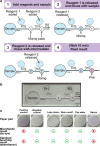
Trigger valves are fundamental features in capillary-driven microfluidic systems that stop fluid at an abrupt geometric expansion and release fluid when there is flow in an orthogonal channel connected to the valve. The concept was originally demonstrated in closed-channel capillary circuits. We show here that trigger valves can be successfully implemented in open channels. We also show that a series of open-channel trigger valves can be placed alongside or opposite a main channel resulting in a layered capillary flow. We developed a closed form model for the dynamics of the flow at trigger valves based on the concept of average friction length and successfully validated the model against experiments. For the main channel, we discuss layered flow behavior in the light of the Taylor-Aris dispersion theory and in the channel turns by considering Dean theory of mixing. This work has potential applications in autonomous microfluidics systems for biosensing, at-home or point-of-care sample preparation devices, hydrogel patterning for 3D cell culture and organ-on-a-chip models.
Keywords: Capillary microfluidics; Fluid dynamics; Friction length; Open microfluidics; Stop valves; Trigger valves.
© 2024. The Author(s).
Conflict of interest statement
Declarations. Competing interests: A.B.T. reports filing multiple patents through the University of Washington and A.B.T. received a gift to support research outside the submitted work from Ionis Pharmaceuticals. E.B. is an inventor on multiple patents filed by Tasso, Inc., the University of Washington, and the University of Wisconsin-Madison. T.M.N. has ownership in Tasso, Inc.; E.B. has ownership in Tasso, Inc., Salus Discovery, LLC, and Seabright, LLC and is employed by Tasso, Inc.; and A.B.T. has ownership in Seabright, LLC; however, this research is not related to these companies. The terms of this arrangement have been reviewed and approved by the University of Washington in accordance with its policies governing outside work and financial conflicts of interest in research. The other authors declare that they have no known competing financial interests or personal relationships that could have appeared to influence the work reported in this paper.
Figures


Update of
-
The dynamics of capillary flow in an open-channel system featuring trigger valves.bioRxiv [Preprint]. 2024 Nov 30:2024.09.17.613325. doi: 10.1101/2024.09.17.613325. bioRxiv. 2024. Update in: Sci Rep. 2024 Dec 30;14(1):31732. doi: 10.1038/s41598-024-82329-3 PMID: 39345588 Free PMC article. Updated. Preprint.
Similar articles
-
The dynamics of capillary flow in an open-channel system featuring trigger valves.bioRxiv [Preprint]. 2024 Nov 30:2024.09.17.613325. doi: 10.1101/2024.09.17.613325. bioRxiv. 2024. Update in: Sci Rep. 2024 Dec 30;14(1):31732. doi: 10.1038/s41598-024-82329-3 PMID: 39345588 Free PMC article. Updated. Preprint.
-
Depressing time: Waiting, melancholia, and the psychoanalytic practice of care.In: Kirtsoglou E, Simpson B, editors. The Time of Anthropology: Studies of Contemporary Chronopolitics. Abingdon: Routledge; 2020. Chapter 5. In: Kirtsoglou E, Simpson B, editors. The Time of Anthropology: Studies of Contemporary Chronopolitics. Abingdon: Routledge; 2020. Chapter 5. PMID: 36137063 Free Books & Documents. Review.
-
Healthcare workers' informal uses of mobile phones and other mobile devices to support their work: a qualitative evidence synthesis.Cochrane Database Syst Rev. 2024 Aug 27;8(8):CD015705. doi: 10.1002/14651858.CD015705.pub2. Cochrane Database Syst Rev. 2024. PMID: 39189465 Free PMC article.
-
Defining the optimum strategy for identifying adults and children with coeliac disease: systematic review and economic modelling.Health Technol Assess. 2022 Oct;26(44):1-310. doi: 10.3310/ZUCE8371. Health Technol Assess. 2022. PMID: 36321689 Free PMC article.
-
The effectiveness of abstinence-based and harm reduction-based interventions in reducing problematic substance use in adults who are experiencing homelessness in high income countries: A systematic review and meta-analysis: A systematic review.Campbell Syst Rev. 2024 Apr 21;20(2):e1396. doi: 10.1002/cl2.1396. eCollection 2024 Jun. Campbell Syst Rev. 2024. PMID: 38645303 Free PMC article. Review.
References
-
- Berthier, J., Brakke, K. A. & Berthier, E. Open Microfluidics (Scrivener-Wiley Publishing, 2016).
-
- Oliveira, N. M., Vilabril, S., Oliveira, M. B., Reis, R. L. & Mano, J. F. Recent advances on open fluidic systems for biomedical applications: A review. Mater. Sci. Eng. C97, 851–863 (2019). - PubMed
-
- Kaigala, G. V. & Delamarche, E. Open-Space Microfluidics: Concepts, Implementations, Applications (Wiley Publishing, 2018).
MeSH terms
Grants and funding
- R35GM128648/U.S. Department of Health & Human Services | NIH | National Institute of General Medical Sciences (NIGMS)
- TL1TR002318/U.S. Department of Health & Human Services | NIH | National Center for Advancing Translational Sciences (NCATS)
- KL2TR002317/U.S. Department of Health & Human Services | NIH | National Center for Advancing Translational Sciences (NCATS)
- TL1 TR002318/TR/NCATS NIH HHS/United States
- R35 GM128648/GM/NIGMS NIH HHS/United States
LinkOut - more resources
Full Text Sources

