. 2024 Dec 30;15(1):10796.
doi: 10.1038/s41467-024-55055-7.

Localized molecular chaperone synthesis maintains neuronal dendrite proteostasis

Affiliations

Localized molecular chaperone synthesis maintains neuronal dendrite proteostasis

Célia Alecki et al. Nat Commun. .

Abstract

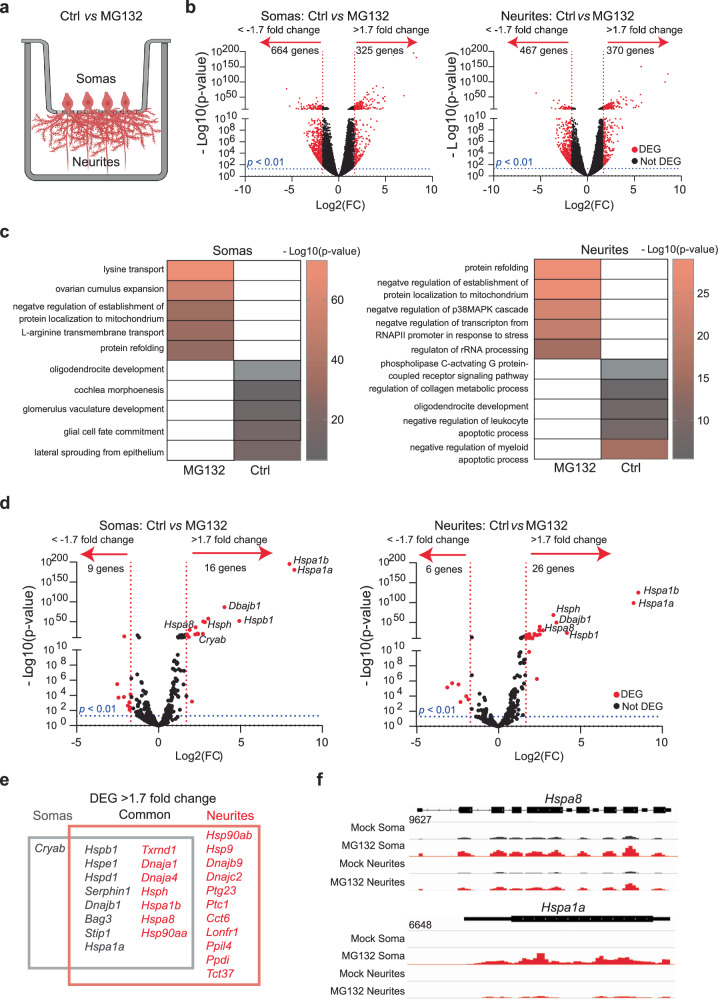
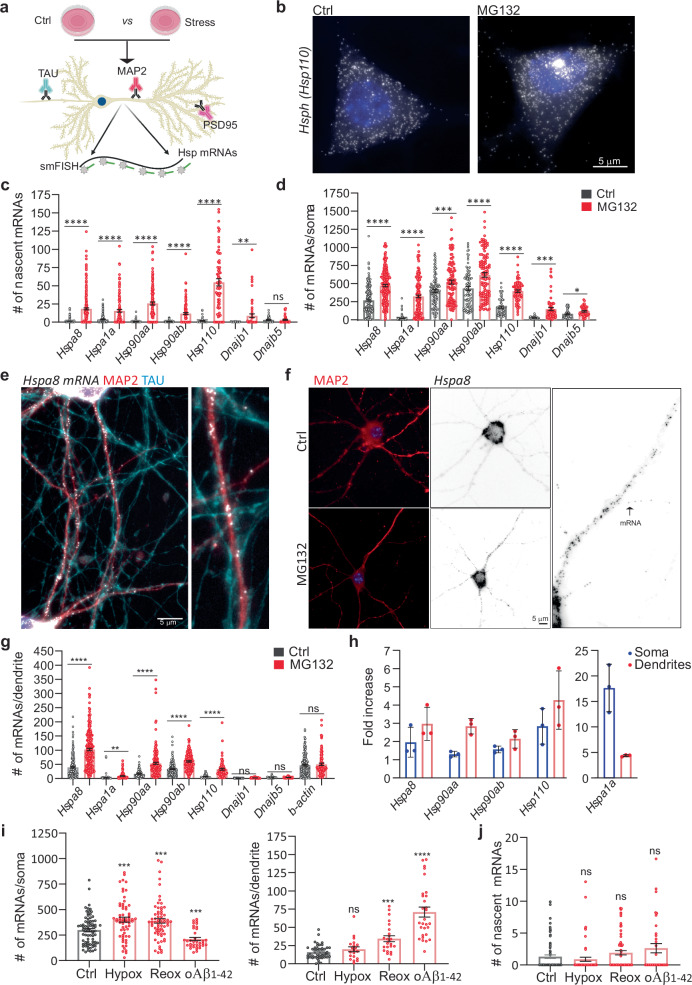
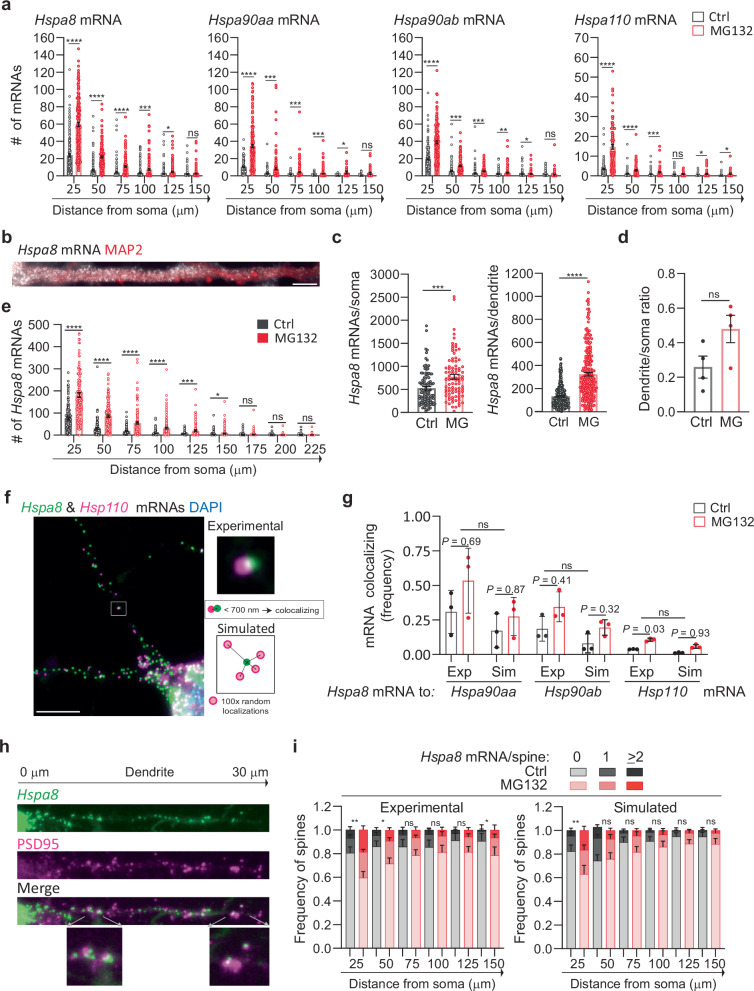
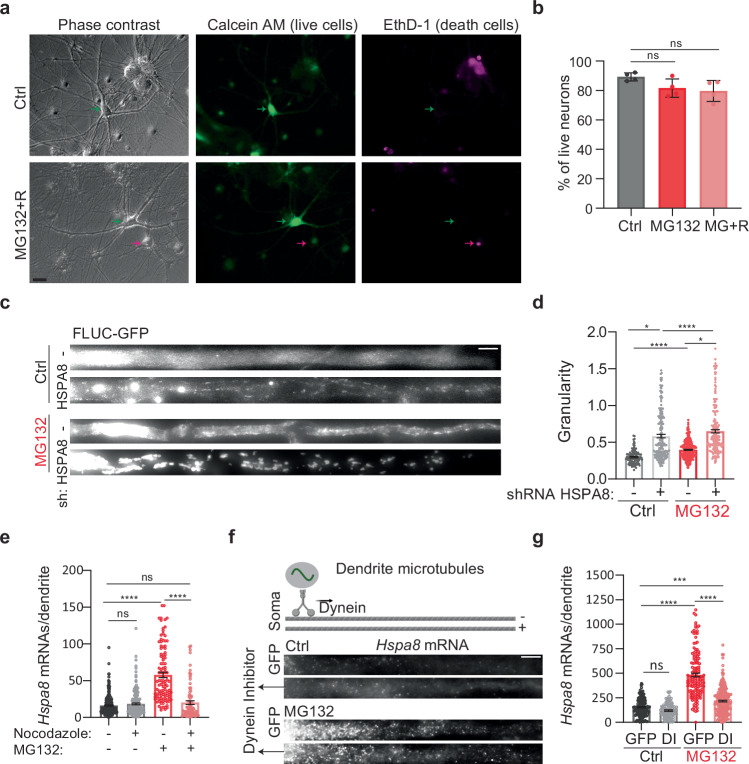
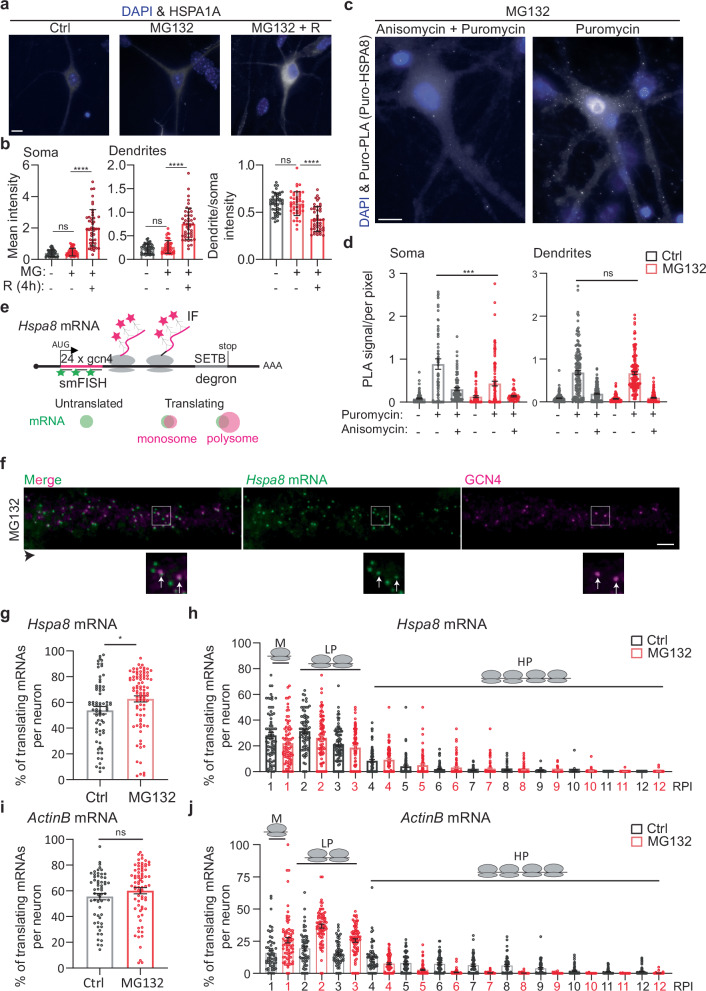
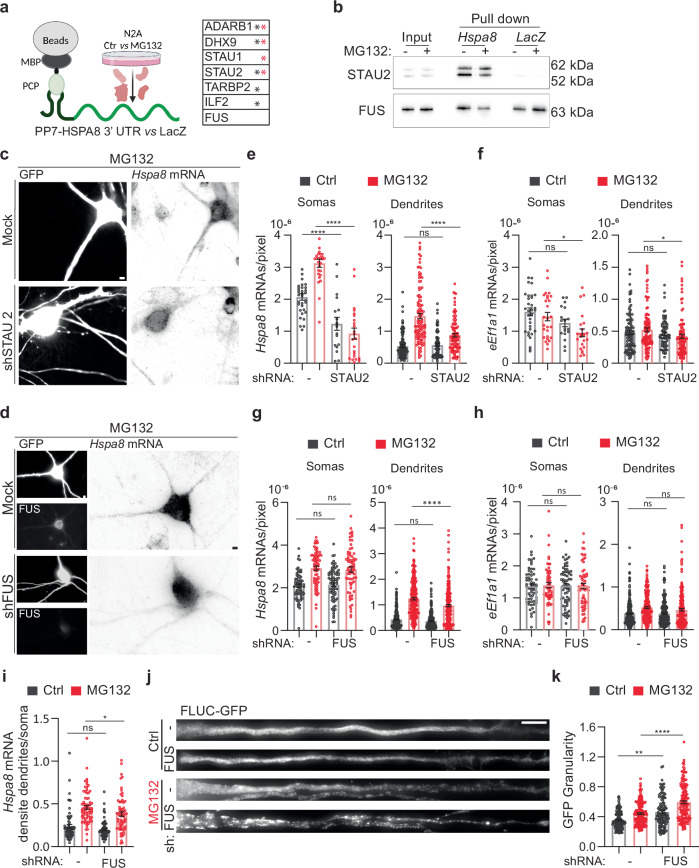
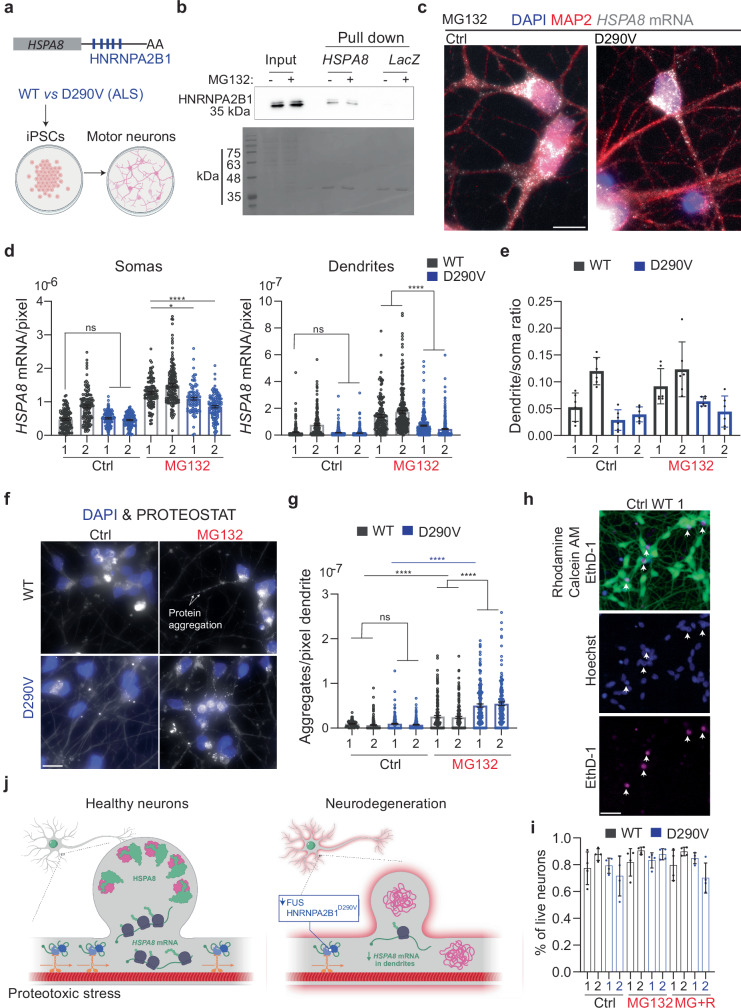
Proteostasis is maintained through regulated protein synthesis and degradation and chaperone-assisted protein folding. However, this is challenging in neuronal projections because of their polarized morphology and constant synaptic proteome remodeling. Using high-resolution fluorescence microscopy, we discover that hippocampal and spinal cord motor neurons of mouse and human origin localize a subset of chaperone mRNAs to their dendrites and use microtubule-based transport to increase this asymmetric localization following proteotoxic stress. The most abundant dendritic chaperone mRNA encodes a constitutive heat shock protein 70 family member (HSPA8). Proteotoxic stress also enhances HSPA8 mRNA translation efficiency in dendrites. Stress-mediated HSPA8 mRNA localization to the dendrites is impaired by depleting fused in sarcoma-an amyotrophic lateral sclerosis-related protein-in cultured spinal cord mouse motor neurons or by expressing a pathogenic variant of heterogenous nuclear ribonucleoprotein A2/B1 in neurons derived from human induced pluripotent stem cells. These results reveal a neuronal stress response in which RNA-binding proteins increase the dendritic localization of HSPA8 mRNA to maintain proteostasis and prevent neurodegeneration.


Conflict of interest statement

Competing interests: G.W.Y. is a Scientific Advisory Board member of Jumpcode Genomics and a co-founder, Board of Directors, and Scientific Advisory Board member, equity holder, and paid consultant for Locanabio and Eclipse BioInnovations. G.W.Y. is a visiting professor at the National University of Singapore. G.W.Y.’s interests have been reviewed and approved by the University of California, San Diego in accordance with its conflict-of-interest policies. The remaining authors declare no competing interests.

Figures

Fig. 1
Fig. 1. Specific mRNAs are preferentially enriched in the soma or projections of hippocampal neurons after proteostatic stress.
a Schematic of primary mouse hippocampal neurons cultured in Transwell membranes to physically separate the soma and neurites for RNA extraction. Neurons were exposed to MG132 (10 μM for 7 h) or DMSO (Ctrl). Created in BioRender. ALAGAR, L. (2024) k11d900. b Volcano plot of differentially expressed genes (DEGs) using DESeq2 in the soma or neurites (n = 3). Genes up- or down-regulated by >1.7 log2(FC) after MG132 treatment and P-values < 0.01 are indicated in red. c Gene ontology enrichment analysis. Gene ontology categories of the top five biological processes enriched in DEGs in the somas and neurites after MG132 exposure. The color of the bands denotes the extent of upregulation. d Volcano plot of known chaperone-related genes using DESeq2. Genes up- or down-regulated by >1.7 log2(FC) after MG132 treatment and P-values < 0.01 are indicated in red. e Venn diagram listing the differentially enriched molecular chaperone-related genes in the somas (gray square) and neurites (red square). f RNA-seq distributions of the Hspa8 and Hspa1a1 loci in the soma and neurites of control and MG132-exposed neurons. Source data are provided as Supplementary Data 1.
Fig. 2
Fig. 2. Subcellular distributions of HSP mRNAs in hippocampal neurons upon stress.
a Schematic of the combined immunofluorescence (IF) and single-molecule fluorescence in situ hybridization (smFISH) protocol used on fixed primary hippocampal neurons (Created in BioRender. ALAGAR, L. (2024) https://BioRender.com/y26d827). b smFISH detection of Hsp110 mRNAs in the soma and nucleus (blue) of control (Ctrl) and MG132-stressed neurons. Arrows in the Ctrl and MG132 images indicate a single mRNA and a transcription site (TS), respectively. c, d Quantification of nascent transcripts (c) and somatic (d) HSP mRNAs in Ctrl and MG132-stressed neurons. Data are the mean ± standard error of the mean (SEM) of three independent experiments ((c) Hspa8 control n = 241. Hspa8 MG132 n = 244, Hspa1a control n = 187, Hspa1a MG132 n = 131, Hsp90aa control n = 128, Hsp90aa MG132 n = 133, Hsp90ab control n = 114, Hsp90ab MG132 n = 128, Hsp110 control n = 56, Hsp110 MG132 n = 70, Dnajb1 control n = 37, Dnajb1 MG132 n = 61, Dnajb5 control n = 45, Dnajb5 MG132 n = 43 neurons. d Hspa8 control n = 212. Hspa8 MG132 n = 221, Hspa1a control n = 302, Hspa1a MG132 n = 197, Hsp90aa control n = 109, Hsp90aa MG132 n = 110, Hsp90ab control n = 90, Hsp90ab MG132 n = 104, Hsp110 control n = 56, Hsp110 MG132 n = 70, Dnajb1 control n = 37, Dnajb1 MG132 n = 61, Dnajb5 control n = 45, Dnajb5 MG132 n = 43.); dots indicate individual values). ****P < 0.0001; ***P < 0.001; **P = 0.0089 (Dnajb1); *P = 0.012 (Dnajb5); ns no significant (P = 0.715 (Dnajb5)) (by unpaired t-test, two-sided). e Localization of Hspa8 mRNA (smFISH, white) in the dendrites (IF: MAP2, red) and axons (IF: TAU, blue) of hippocampal neurons. Scale bar = 5 μm. The square depicts the magnified region. f Detection of Hspa8 mRNA (smFISH, black) in dendrites (IF: MAP2, red) in Ctrl and MG132 stressed neurons. The square depicts the magnified region. g Quantification of dendritic HSP mRNAs in the Ctrl and MG132-stressed neurons in (c, d). Data are the mean ± SEM of three independent experiments (Hspa8 control n = 250. Hspa8 MG132 n = 239, Hspa1a control n = 114, Hspa1a MG132 n = 125, Hsp90aa control n = 116, Hsp90aa MG132 n = 184, Hsp90ab control n = 182, Hsp90ab MG132 n = 145, Hsp110 control n = 143, Hsp110 MG132 n = 88, Dnajb1 control n = 58, Dnajb1 MG132 n = 45, Dnajb5 control n = 85, Dnajb5 MG132 n = 51, ActinB control n = 179, ActinB MG132 n = 96 dendrites). ****P < 0.0001; **P = 0.0033 (Hspa1a); ns no significant (Dnajb1 (P = 0.19), Dnajb5 (P = 0.38), ActinB (P = 0.59) (by unpaired multiple t-test, two-sided). h Fold enrichment of HSP mRNAs in the soma and dendrites of MG132-stressed (MG) and Ctrl neurons from the quantifications in (c, d, and g). Data are the mean ± standard deviation (SD) of three independent experiments (i) Quantification of somatic and dendritic Hspa8 mRNAs in Ctrl hippocampal neurons and those stressed by hypoxia (Hypox), hypoxia followed by reoxygenation (Reox), or incubation with amyloid beta (1–42) oligomers (oAβ1-42). Data are the mean ± SEM of three independent experiments (neurons control n = 76, hypoxia n = 62, reoxygenation n = 66, oAβ1-42 n = 35; dendrites control n = 48, hypoxia n = 20, reoxygenation n = 24, oAβ1-42 n = 29). (P = 0.008 (Hypox), 0.0017 (Reox), 0.003 (oAB) in dendrites and P = 0.02814 (Hypox), 0.0002 (reox), 0.044 (oAB) (by unpaired t-test Wltsch’s correction, two-sided). j Quantification of nascent Hspa8 mRNA of (I). Data are the mean ± SEM of two independent experiments (control n = 77, hypoxia n = 62, reoxygenation n = 69, oAβ1-42 n = 35 neurons; dots indicate individual values). P = 0.33 (Hypox), 0.16 (Reox), 0.09 (oAB). ns no significant (by unpaired t-test, two-sided). Source data are provided as a Source Data file.
Fig. 3
Fig. 3. Stress-induced changes in dendritic HSP mRNA localization in primary neurons.
a Quantification of the dendritic mRNAs located in 25-μm bins based on their distance from the soma. Data are the mean ± SEM of three independent experiments (Hspa8 control n = 185, Hspa8 MG132 n = 181, Hsp90aa control n = 116, Hsp90aa MG132 n = 184, Hsp90ab control n = 182, Hps90ab MG132 n = 146, Hsp110 control n = 143, Hsp110 MG132 n = 88 dendrites); dots indicate individual dendrites. ****P < 0.0001, ***P < 0.001, **P < 0.01 (P = 0.0019 (Hsp90ab), *P < 0.05 (P = 0.021 (Hspa8) 0.024 (Hsp90aa), 0.021 and 0.011 (Hsp110), ns no significant (P = 0.28 (Hspa8) 0.29 (Hsp90aa) 0.54 and 0.64 (Hsp90ab) 0.097 (Hsp110) (by multiple unpaired t-tests, two-sided). b smFISH detection of Hspa8 mRNAs in the dendrites of an MG132-stressed primary mouse motor neuron stained with MAP2. Scale bar = 5 μm. c Quantification of somatic and dendritic Hspa8 mRNAs in Ctrl and MG132-stressed motor neurons. Data are the mean ± SEM of four independent experiments (control n = 100 neurons, MG132 n = 87 neurons, control n = 280 dendrites, MG132 n = 237 dendrites). ****P < 0.0001, ***P < 0.001 (by unpaired t-test, two-tailed). d Ratio of Hspa8 mRNA per area of dendrite or soma (in pixels) in Ctrl and MG132-stressed motor neurons. Data are the mean ± SD of data analyzed in (c). ns no significant P = 0.079 (by unpared t-test, two-tailed). e Quantification of Hspa8 mRNAs per 25-μm bin. Data are the mean ± SEM of the experiment in (c). ****P < 0.0001, ***P < 0.001, *P < 0.05 (P = 0.014), ns no significant (P = 0.41 (175) 0.52 (200) and 0.30 (225) (by multiple unpaired t-tests, two-sided). f Two-color smFISH detection of Hspa8 and Hsp110 mRNAs in a primary hippocampal neuron stressed with 10 μM MG132 for 7 h. The square shows a magnified view of two colocalizing mRNAs and the scheme represents the calculation of colocalization (<700 nm away) in the experimental data and random simulations. Scale bar = 5 μm. g Frequency of colocalization between Hspa8 mRNA and Hsp90aa, Hsp90ab, or Hsp110 mRNAs per dendrite in Ctrl and MG132-stressed primary hippocampal neurons. Exp indicates experimental data. Sim indicates simulated data that is the average of 100 random simulations of the positions of each detected Hspa90aa, Hspa90ab, or Hsp110 mRNA in a specific dendrite. Data are the mean ± SD of three independent experiments from (a). P values to compare Ctrl to MG132 in Exp to Sim data by multiple two-tailed unpaired t-test are indicated and Exp to Sim data comparison is ns no-significant (P = 0.25) (by Wilcoxon matched-pairs signed rank, two-tailed). h Detection of Hspa8 mRNAs in relation to the dendritic spines, identified by anti-PSD95 IF. The distances shown are in relation to the soma. The lower images show magnifications of mRNAs localizing to the dendritic spines in the areas indicated by the arrows. i Frequency of dendrites with 0, 1, and 2 or more Hspa8 mRNAs localizing within 600 nm of the center of the PSD95 IF signal in Ctrl and MG132-stressed primary hippocampal neurons from panel (a). Dendritic spines were assigned to 25-μm bins based on their distance from the soma. Data are the mean ± SEM of six independent experiments. Simulated data are the average of 100 random simulations of the positions of each detected Hspa8 mRNA in the specific dendritic bin. **P < 0.01 (Exp P = 0.0041 (25), Sim P = 0.0033 (25); *P < 0.05 (Exp P = 0.013 (50) and 0.048 (150); ns, no significant (Exp P = 0.41 (75) 0.18 (100) 0.093 (125), Sim P = 0.18 (50) 0.23 (75) 0.45 (100) 0.13 (125 and 150) (by chi-squared test). Comparison between Exp and Sim was ns in Ctrl and MG132 (P = 0.84 and 0.90 (25), 0.05 and 0.79 (50), 0.66 and 0.29 (75), 0.81 and 0.63 (100), 0.56 and 0.30 (125) and 0.68 and 0.14 (150) (by chi-squared test). Source data are provided as a Source Data file.
Fig. 4
Fig. 4. Function and transport of dendritic HSP mRNAs.
a Representative neurons from Ctrl and MG132-stress spinal cord motor neurons double-stained to identify live (Calcein, green) and dead (EthD-1, magenta) neurons, position indicated with arrows. Scale bar = 10 μm. b Quantification of the live neurons in Ctrl, MG132-stress (10 μM for 7 h), and recovery ((MG + R) 10 μM MG132 for 7 h and 4 h after MG132 washout). Data are the mean ± SD of four independent experiments (n = 83 (Ctrl), 99 (MG132), and 121 (MG132 + R) neurons). ns; no significant (P = 0.125 by Wilcoxon-matched pairs test, two-sided). c Representative dendrites from Ctrl and MG132-stressed spinal cord motor neurons expressing the proteostasis reporter plasmid FLUC-GFP with and without HSPA8 knockdown. GFP aggregation is proportional to proteostasis loss. Scale bar = 10 μm. d Quantification of the GFP signal granularity (the coefficient of variation) in each dendrite in C. Data are the mean ± SEM of three independent experiments (no shRNA control n = 116 dendrites, HSPA8 shRNA control n = 190 dendrites, no shRNA MG132 n = 334 dendrites, HSPA8 shRNA MG132 n = 213 dendrites). ****P < 0.0001; *P < 0.05 (P = 0.013(Ctrl) and 0.014 (MG132) by ordinary 1-way ANOVA). e Quantification of dendritic Hspa8 mRNAs in Ctrl neurons and MG132-stressed neurons with and without nocodazole exposure. Data are the median ± SD of three independent experiments. Three independent experiments were performed (control n = 287, Nocodazole n = 226, MG132 n = 111, Nocodazole + MG132 n = 85 dendrites; dots indicate individual dendrite values). ****P < 0.0001; ns no significant (P = 0.59 (MG132−) and 0.94 (Nocodazole+) by ordinary 1-way ANOVA). f Schematic of microtubule orientation and dynein transport in dendrites. smFISH detection of Hspa8 mRNAs in the dendrites of Ctrl and MG132-stressed neurons. Scale bar = 5 μm. Created in BioRender. ALAGAR, L. (2024) l35j827. g Quantification of somatic and dendritic Hspa8 mRNAs in Ctrl and MG132-stressed motor neurons microinjected with a plasmid expressing GFP or a Dynein Inhibitor (DI). Data are the mean ± SEM of three independent experiments (GFP control n = 148, Dynein control n = 144, GFP MG132 n = 101, Dynein MG132 = 249 dendrites). ****P < 0.0001, ***P < 0.001; ns no significant (P = 0.40) (by ordinary 1-way ANOVA). Source data are provided as a Source Data file.
Fig. 5
Fig. 5. Localized HSP mRNA translation in primary neurons.
a Representative IF detection of HSPA1A in Ctrl, MG132-stressed (10 μM for 7 h), and MG132-recovered (10 μM MG132 for 7 h and washout for 8 h) primary spinal cord motor neurons. Scale bar = 10 μm. b The plot shows the mean ± SEM of HSPA1A quantifications in three independent experiments (n = 45 total neurons). ****P < 0.0001, ns no significant (P = 0.91 (Soma) 0.74 (Dendrites) 0.95 (intensity) by 1 way ANOVA). c Representative images of puro-PLA detection of newly synthesized HSPA8 peptides. Scale bar = 10 μm. d Quantification of the number of puro-PLA signals detected per area of soma and dendrite in three independent experiments (neurons control n = 93, Puromycin n = 92, Puromycin + Anisomycin n = 79, MG132 n = 71, MG132 + Puromycin n = 109, MG132 + Puromycin + Anisomycin n = 51; dendrites control n = 155, Puromycin n = 143, Puromycin + Anisomycin n = 163, MG132 n = 130, MG132 + Puromycin n = 152, MG132 + Puromycin + Anisomycin n = 123; dots indicate individual soma and dendrite values). ***P < 0.001, ns no significant, P = 0.62 (by 1 way ANOVA). e Schematic of the Hspa8 single-molecule translational reporter and the IF-smFISH signals expected for untranslated mRNAs and those being translated by a monosome or polyribosomes. Distention among them was based on the intensity of the IF signal colocalizing with the mRNA, which is proportional to the number of nascent peptides produced from an mRNA. f Representative IF-smFISH image of dendrites of an MG132-stressed primary spinal cord motor neuron expressing the Hspa8 single-molecule translational reporter (e). The black arrowhead indicates the direction of the dendrite from the soma. Squares depict the magnified regions. White arrows indicate translating mRNAs. Scale bar = 5 μm. g, i Quantification of the percentage of Hspa8 and ActinB translated mRNAs per dendrite. Data are the mean ± SD of (g) seven independent experiments (n = 70–88 dendrites) and (i) three independent experiments (n = 58–74 dendrites). g *P < 0.05, P = 0.036; (i) ns no significant, P = 0.20 (by Weltch corrected t-test, two-sided). h, j Quantification of the relative nascent peptides intensity (RPI) colocalizing with a translating Hspa8 and ActinB mRNAs from (g) and (i). Media and SEM of translating mRNAs. M monosomes, LP light polyribosomes, and HP heavy polyribosomes. Source data are provided as a Source Data file.
Fig. 6
Fig. 6. FUS regulates dendritic Hspa8 mRNA localization and neuronal proteostasis in mouse motor neurons.
a Schematic of the pulldown strategy used to identify RBPs binding to the Hspa8 3′ UTR, and a table of the RBPs identified as specifically bound to the Hspa8 3′ UTR in extracts from Ctrl (black *) and MG132-stressed (red *) N2A cells by MS (Created in BioRender. ALAGAR, L. (2024) https://BioRender.com/f90a722). Proteomics data is provided in Source data. b Pulldown experiments to validate the binding of STAU2 and FUS to the Hspa8 3′ UTR were analyzed by western blot in two independent replicates. I input, PD pulldown. c, d Representative images of primary mouse motor neurons expressing GFP (Ctrl) or GFP and shRNAs against STAU2 (c) or FUS (d). Three days after microinjection, stress was induced with 10 μM MG132 for 7 h, and Hspa8 mRNA expression was detected by smFISH. Scale bars = 5 μm. eh Quantification of the densities of Hspa8 (e, g) and eEf1a1 (f, h) mRNAs per pixel of soma or dendrite area in Ctrl and MG132-stressed motor neurons expressing GFP with and without the indicated shRNA expression plasmids. For STAU2, the data are the mean ± SEM of three independent experiments (neurons GFP control n = 33, GFP MG132 n = 27, STAU2 shRNA control n = 18, STAU2 shRNA MG132 n = 23; dendrites GFP control n = 105, GFP MG132 n = 111, STAU2 shRNA control n = 72, STAU2 shRNA MG132 n = 98; dots indicate individual soma and dendrite values). P values for Hspa8 mRNA (****P < 0.0001, ns no significant (P = 0.99)) and for eEf1a1 mRNA (Soma: **P < 0.01 (0.031), ns no significant (P = 0.26), Dendrites: *P < 0.05 (0.076), ns no significant (P = 0.98). For FUS, five independent experiments (neurons GFP control n = 69, GFP MG132 n = 72, FUS shRNA control n = 75, FUS shRNA MG132 n = 69; dendrites GFP control n = 246, GFP MG132 n = 232, FUS shRNA control n = 255, FUS shRNA MG132 n = 224). P values for Hspa8 mRNA (Soma: ns no significant (P = 0.88 in Ctrl and 0.1 in MG132), Dendrites: ***P < 0.001; ns no significant (P = 0.905)) and for eEf1a1 mRNA (Soma: ns no significant (P = 0.99 in Ctrl and MG132), Dendrites: ns no significant (P = 0.99 in Ctrl and 0.34 in MG132)) (by 1-way ANOVA). i Ratio of the dendrite to soma Hspa8 mRNA density calculated by averaging the number of mRNAs/pixel of all dendrites of a neuron and dividing it by the number of mRNA/pixel of soma. The data are the mean ± SEM of three independent experiments (GFP control n = 70, GFP MG132 n = 72, FUS shRNA control n = 75, FUS shRNA MG132 n = 69 neurons) from G. *P < 0.05 (P = 0.021); ns no significant (P = 0.13) (by 1 way ANOVA). j Representative dendrites from Ctrl and MG132-stressed motor neurons expressing the proteostasis reporter plasmid FLUC-GFP with and without FUS knockdown. GFP aggregation is proportional to proteostasis loss. Scale bar = 10 μm. k Quantification of the GFP signal granularity (the coefficient of variation) in each dendrite in I. The data are the mean ± SEM of four independent experiments (GFP control n = 97, GFP MG132 n = 138, FUS shRNA control n = 88, FUS shRNA MG132 n = 115 dendrites). ****P < 0.0001;**P < 0.01 (P = 0.0021) (by 1 way ANOVA). Source data are provided as a Source Data file.
Fig. 7
Fig. 7. An ALS-associated HNRNPA2B1 mutation D290V impairs dendritic HSPA8 mRNA localization in human motor neurons.
a Schematic of human HSPA8 mRNAs and the differentiation of iPSCs from healthy and D190V donors into motor neurons (Created in BioRender. ALAGAR, L. (2024) b98d129). b Representative immunoblot of two independent pulldown experiments to validate the binding of HNRNPA2B1 to the HSPA8 3′ UTR. Scale bar = 10 μm. c IF-smFISH to stain dendrites with an anti-MAP2 antibody and detect HSPA8 mRNAs in MG132-stressed motor neurons differentiated from healthy (WT) donors and patients with ALS carrying the HNRNPA2B1D290V mutation. Scale bar = 10 μm. d Quantification of somatic and dendritic HSPA8 mRNAs in Ctrl and MG132-stressed human-derived motor neurons from the experiments in C. Data are the mean ± SEM of six independent cultures per donor (control WT 1 n = 119, control WT 2 n = 128, MG132 WT 1 n = 116, MG132 WT 2 n = 155, control D290V 1 n = 121, control D290V 2 n = 113, MG132 D290V 1 n = 89, MG132 D290V 2 n = 119 neurons; control WT 1 n = 223, control WT 2 n = 193, MG132 WT 1 n = 150, MG132 WT 2 n = 241, control D290V 1 n = 316, control D290V 2 n = 304, MG132 D290V 1 n = 308, MG132 D290V 2 n = 331 dendrites individual soma and dendrite values indicated by a dot). Motor neurons differentiated from healthy donors WT and patients (P). ****P < 0.0001; **P < 0.01 (Soma MG132 P1 (P = 0.0068), ns no significant (P > 0.99) and Dendrites (P > 0.99)) (by 1 way ANOVA). e The ratio of HSPA8 mRNA per pixel of soma or dendrite area in the MG132-stressed motor neurons of the six independent cultures analyzed in C and represented as the mean ± SD. f Representative images of protein aggregates detection in WT and D290V HNRNPA2B derived motor neurons stress with 10 μM MG132 for 7 h. Scale bar = 10 μm. g Quantification of the aggregates detected by the PROTEOSTAT staining in dendrites in F. Data are the mean ± SEM of three independent experiments (control WT 1 n = 158, control WT 2 n = 165, MG132 WT 1 n = 159, MG132 WT 2 n = 162, control D290V 1 n = 154, control D290V 2 n = 156, MG132 D290V 1 n = 159, MG132 D290V 2 n = 147dendrites). ****P < 0.0001; ns no significant (P > 0.99) (by 1 way ANOVA). h Representative neurons from WT MG132-stress iPSCs-derived motor neurons double-stained to identify live (Calcein, green) and dead (EthD-1, magenta) neurons and nuclei (Hoechst, blue). Arrowheads indicate dead neurons in the three channels. Scale bar = 10 μm. i Quantification of the live neurons in Ctrl, MG132-stress (10 μM for 7 h), and recovery ((MG + R) 10 μM MG132 for 7 h and 4 h after MG132 washout). The data are the mean ± SD of four independent experiments (n = 10 fields of view). ns no significant (by Wilcoxon test, two-sided). j Summary of conclusions. Neurons sustain dendritic proteostasis in response to stress by increasing the localization of HSP mRNAs, mainly Hspa8, and their translation. The regulated transport of Hspa8 mRNA is mediated by two RBPs, FUS and HNRNPA2B1. Depletion of FUS or expression of the ALS mutation HNRNPA2B1D290V reduces the localization of Hspa8 mRNAs and promotes the accumulation of misfolded proteins upon stress. Dendritic attrition and loss of synaptogenesis are common signs of diverse neurodegenerative diseases, and defects in dendritic HSP mRNA localization offer a molecular explanation for these events. (Created by Margot Riggi.) Source data are provided as a Source Data file.

Update of

Similar articles

References

    1. Costa-Mattioli, M., Sossin, W. S., Klann, E. & Sonenberg, N. Translational control of long-lasting synaptic plasticity and memory. Neuron61, 10–26 (2009). - PMC - PubMed
    1. Costa-Mattioli, M. et al. Translational control of hippocampal synaptic plasticity and memory by the eIF2α kinase GCN2. Nature436, 1166–1170 (2005). - PMC - PubMed
    1. Huber, K. M., Kayser, M. S. & Bear, M. F. Role for rapid dendritic protein synthesis in hippocampal mGluR-dependent long-term depression. Science288, 1254–1256 (2000). - PubMed
    1. Kang, H. & Schuman, E. M. A requirement for local protein synthesis in neurotrophin-induced hippocampal synaptic plasticity. Science273, 1402–1406 (1996). - PubMed
    1. Miller, S. et al. Disruption of dendritic translation of CaMKIIα impairs stabilization of synaptic plasticity and memory consolidation. Neuron36, 507–519 (2002). - PubMed

MeSH terms

LinkOut - more resources