

Comparison of fine-scale malaria strata derived from population survey data collected using RDTs, microscopy and qPCR in South-Eastern Tanzania
- PMID: 39696325
- PMCID: PMC11657885
- DOI: 10.1186/s12936-024-05191-8
Comparison of fine-scale malaria strata derived from population survey data collected using RDTs, microscopy and qPCR in South-Eastern Tanzania
Abstract
Background: Malaria-endemic countries are increasingly adopting data-driven risk stratification, often at district or higher regional levels, to guide their intervention strategies. The data typically comes from population-level surveys collected by rapid diagnostic tests (RDTs), which unfortunately perform poorly in low transmission settings. Here, a high-resolution survey of Plasmodium falciparum prevalence rate (PfPR) was conducted in two Tanzanian districts using rapid diagnostic tests (RDTs), microscopy, and quantitative polymerase chain reaction (qPCR) assays, enabling the comparison of fine-scale strata derived from these different diagnostic methods.
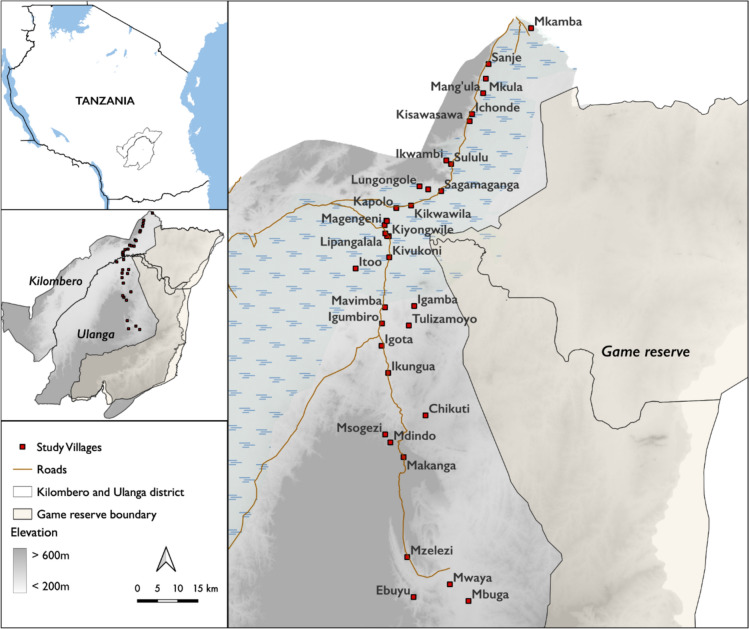
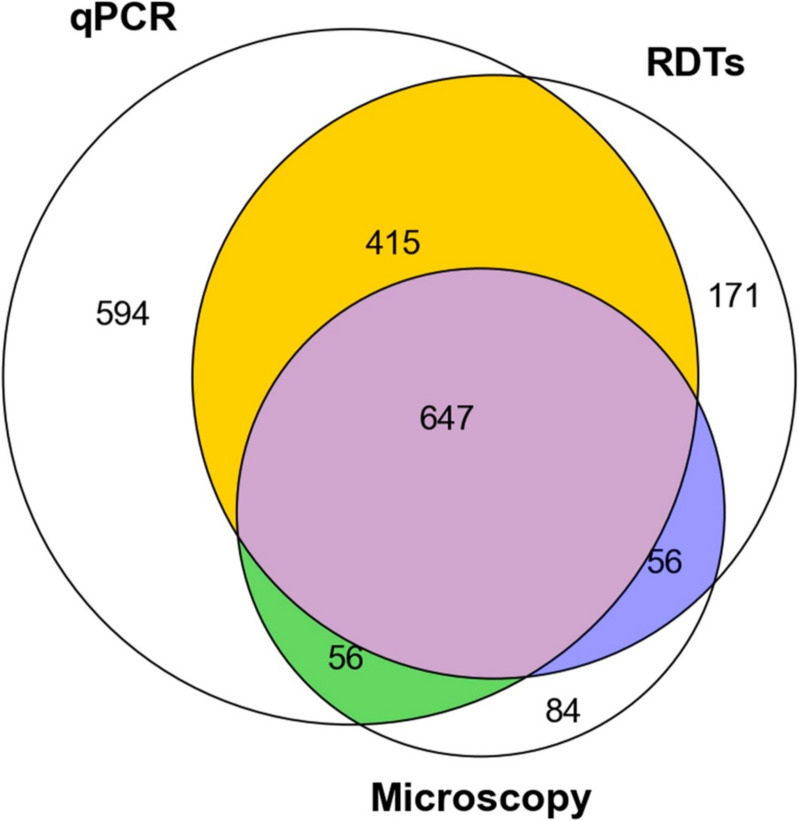
Methods: A cross-sectional survey was conducted in 35 villages in Ulanga and Kilombero districts, south-eastern Tanzania between 2022 and 2023. A total of 7,628 individuals were screened using RDTs (SD-BIOLINE) and microscopy, with two thirds of the samples further analysed by qPCR. The data was used to categorize each district and village as having very low (PfPR < 1%), low (1%≤PfPR < 5%), moderate (5%≤PfPR < 30%), or high (PfPR ≥ 30%) parasite prevalence. A generalized linear mixed model was used to analyse infection risk factors. Other metrics, including positive predictive value (PPV), sensitivity, specificity, parasite densities, and Kappa statistics were computed for RDTs or microscopy and compared to qPCR as reference.
Results: Significant fine-scale variations in malaria risk were observed within and between the districts, with village prevalence ranging from 0% to > 50%. Prevalence varied by testing method: Kilombero was low risk by RDTs (PfPR = 3%) and microscopy (PfPR = 2%) but moderate by qPCR (PfPR = 9%); Ulanga was high risk by RDTs (PfPR = 39%) and qPCR (PfPR = 54%) but moderate by microscopy (PfPR = 26%). RDTs and microscopy classified majority of the 35 villages as very low to low risk (18-21 villages). In contrast, qPCR classified most villages as moderate to high risk (29 villages). Using qPCR as the reference, PPV for RDTs and microscopy ranged from as low as < 20% in very low transmission villages to > 80% in moderate and high transmission villages. Sensitivity was 62% for RDTs and 41% for microscopy; specificity was 93% and 96%, respectively. Kappa values were 0.7 for RDTs and 0.5 for microscopy. School-age children (5-15 years) had higher malaria prevalence and parasite densities than adults (P < 0.001). High-prevalence villages also had higher parasite densities (Spearman r = 0.77, P < 0.001 for qPCR; r = 0.55, P = 0.003 for microscopy).
Conclusion: This study highlights significant fine-scale variability in malaria burden within and between the study districts and emphasizes the variable performance of the testing methods when stratifying risk at local scales. While RDTs and microscopy were effective in high-transmission areas, they performed poorly in low-transmission settings; and classified most villages as very low or low risk. In contrast, qPCR classified most villages as moderate or high risk. The findings emphasize that, where precise mapping and effective targeting of malaria are required in localized settings, tests must be both operationally feasible and highly sensitive. Furthermore, when planning microstratification efforts to guide local control measures, it is crucial to carefully consider both the strengths and limitations of the available data and the testing methods employed.
Keywords: Fine scale stratifications; Malaria; Malaria screening; Micro-stratification; Microscopy; Polymerase chain reaction (PCR); Population surveys; Prevalence rate; Rapid diagnostic tests (RDTs).
© 2024. The Author(s).
Conflict of interest statement
Declarations. Ethics approval and consent to participate: This work was approved under Ifakara Health Institute Review Board (Ref: IHI/IRB/No: 1 2021) and the National Institute for Medical Research-NIMR (NIMR/HQ/R.8a/Vol. 1X/3735). Permission to publish this work has been granted with reference No: BD. 242/437/01 C/6. Competing interests: The authors declare no competing interests.
Figures


Similar articles
-
Defining the optimum strategy for identifying adults and children with coeliac disease: systematic review and economic modelling.Health Technol Assess. 2022 Oct;26(44):1-310. doi: 10.3310/ZUCE8371. Health Technol Assess. 2022. PMID: 36321689 Free PMC article.
-
Falls prevention interventions for community-dwelling older adults: systematic review and meta-analysis of benefits, harms, and patient values and preferences.Syst Rev. 2024 Nov 26;13(1):289. doi: 10.1186/s13643-024-02681-3. Syst Rev. 2024. PMID: 39593159 Free PMC article.
-
Quantifying Plasmodium falciparum infections clustering within households to inform household-based intervention strategies for malaria control programs: An observational study and meta-analysis from 41 malaria-endemic countries.PLoS Med. 2020 Oct 29;17(10):e1003370. doi: 10.1371/journal.pmed.1003370. eCollection 2020 Oct. PLoS Med. 2020. PMID: 33119589 Free PMC article.
-
Topical fluoride as a cause of dental fluorosis in children.Cochrane Database Syst Rev. 2024 Jun 20;6(6):CD007693. doi: 10.1002/14651858.CD007693.pub3. Cochrane Database Syst Rev. 2024. PMID: 38899538 Review.
-
Impact of residual disease as a prognostic factor for survival in women with advanced epithelial ovarian cancer after primary surgery.Cochrane Database Syst Rev. 2022 Sep 26;9(9):CD015048. doi: 10.1002/14651858.CD015048.pub2. Cochrane Database Syst Rev. 2022. PMID: 36161421 Free PMC article. Review.
References
-
- WHO. Malaria policy advisory group (MPAG) meeting report. Geneva: World Health Organization; 2023.
Publication types
MeSH terms
Grants and funding
LinkOut - more resources
Full Text Sources
Medical
