

Integrated Analysis of Single-Cell and Bulk RNA Sequencing Reveals HSD3B7 as a Prognostic Biomarker and Potential Therapeutic Target in ccRCC
- PMID: 39684640
- PMCID: PMC11641532
- DOI: 10.3390/ijms252312929
Integrated Analysis of Single-Cell and Bulk RNA Sequencing Reveals HSD3B7 as a Prognostic Biomarker and Potential Therapeutic Target in ccRCC
Abstract
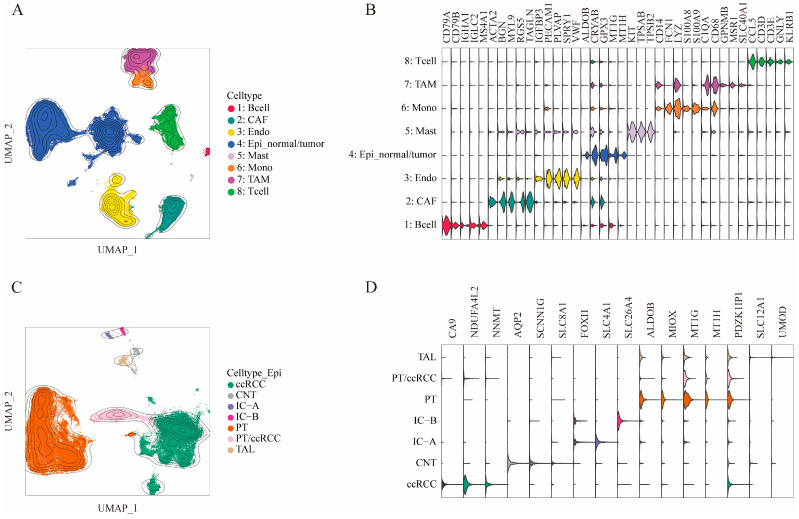
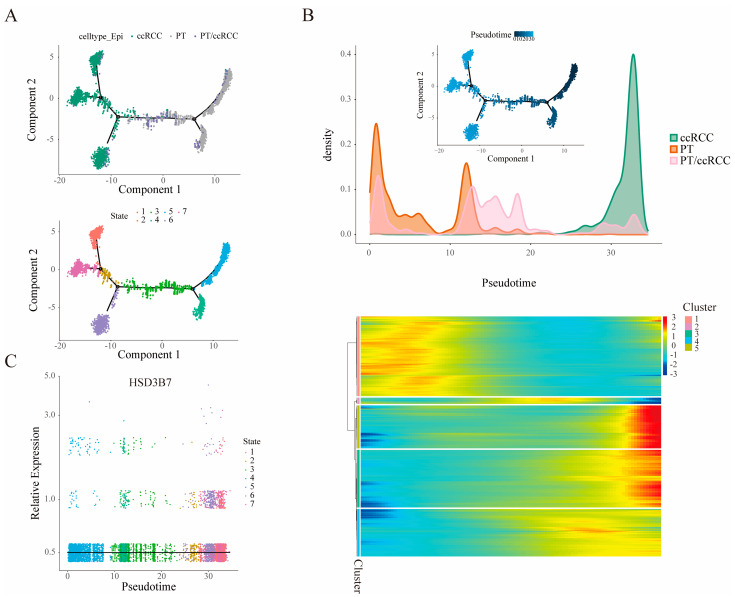
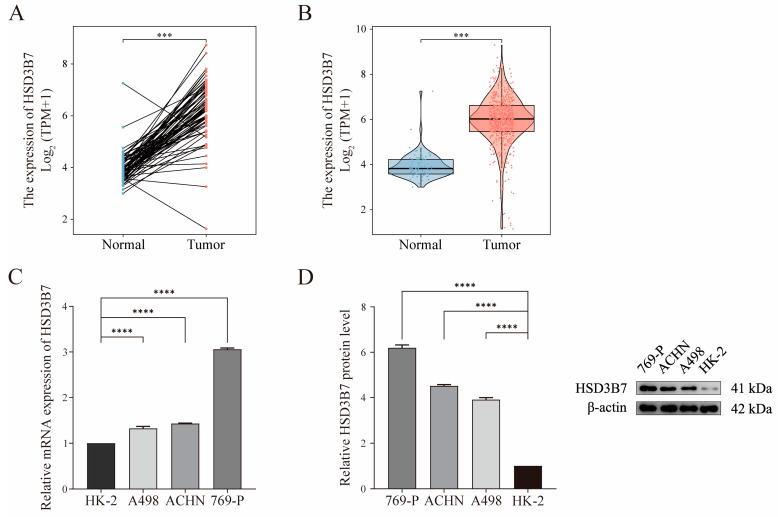
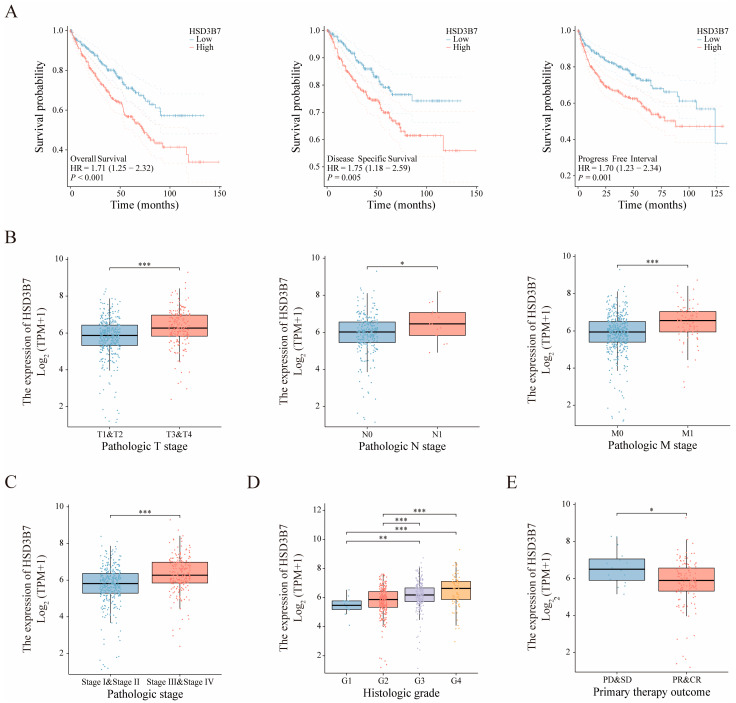
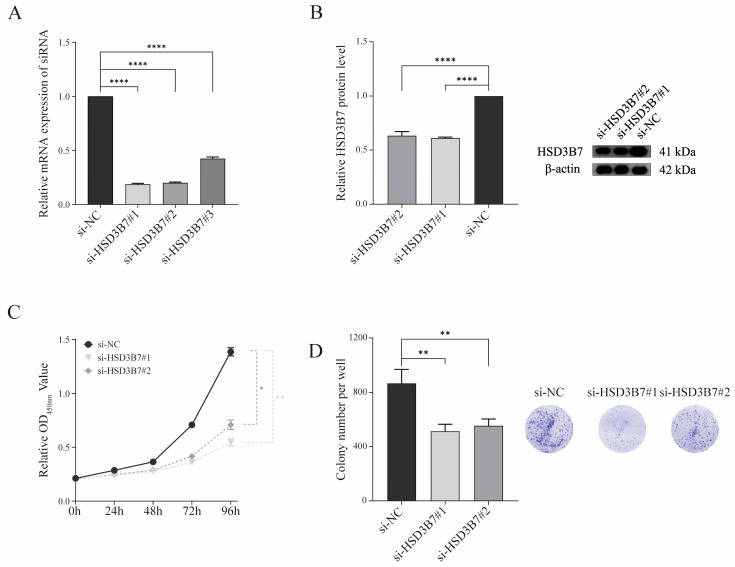
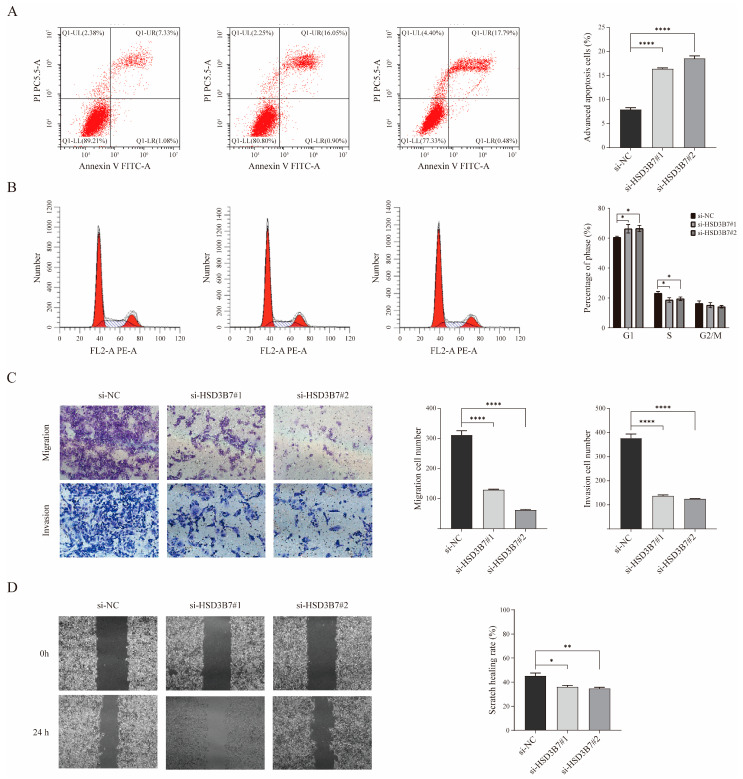
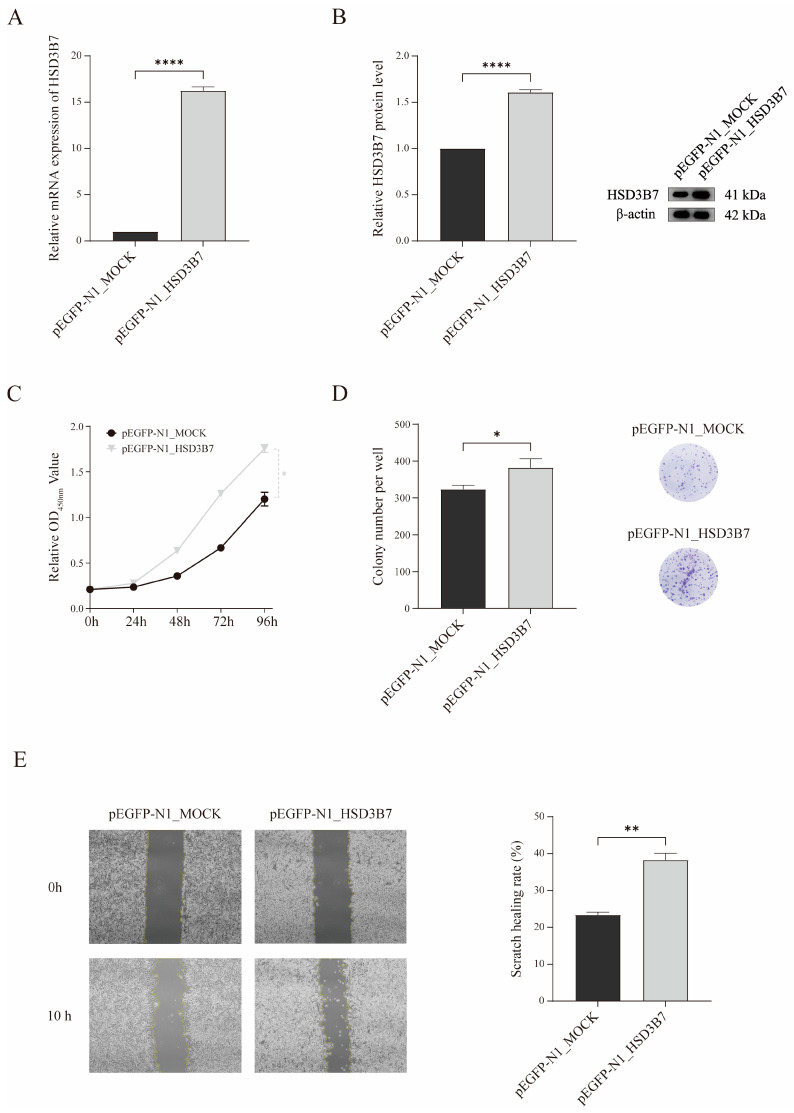
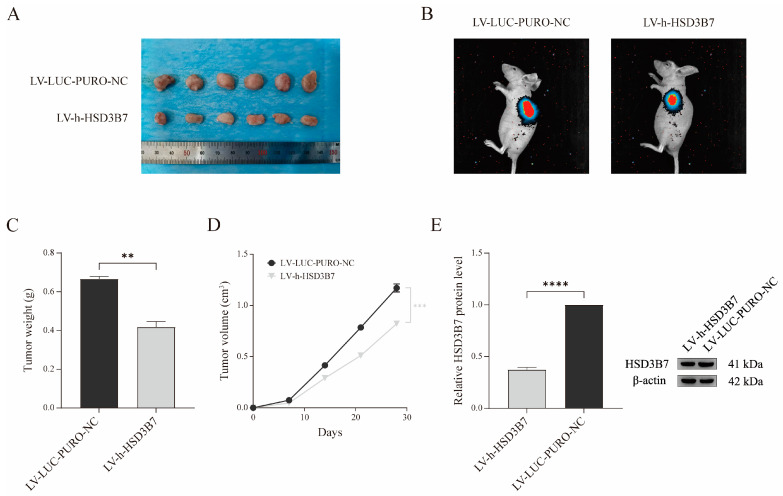
Clear cell renal cell carcinoma (ccRCC) is the most common kidney malignancy, with a poor prognosis for advanced-stage patients. Identifying key biomarkers involved in tumor progression is crucial for improving treatment outcomes. In this study, we employed an integrated approach combining single-cell RNA sequencing (scRNA-seq) and bulk RNA sequencing (bulk RNA-seq) to identify biomarkers associated with ccRCC progression and prognosis. Single-cell transcriptomic data were obtained from publicly available datasets, and genes related to tumor progression were screened using Monocle2. Bulk RNA-seq data for ccRCC were retrieved from The Cancer Genome Atlas (TCGA) and integrated with scRNA-seq data to explore tumor heterogeneity. We identified 3 beta-hydroxy steroid dehydrogenase type 7 (HSD3B7) as a candidate biomarker for ccRCC, associated with poor overall survival, disease-specific survival, and progression-free interval. Elevated HSD3B7 expression correlated with aggressive clinical features such as advanced TNM stages, histologic grades, and metastasis. Functional studies demonstrated that HSD3B7 promotes cell proliferation, migration, and invasion in vitro, while its silencing significantly inhibits tumor growth in vivo. Our findings reveal that HSD3B7 is a novel biomarker for ccRCC, providing insights into its role in tumor progression and potential as a target for therapy. This study highlights the value of integrating scRNA-seq and bulk RNA-seq data to uncover key regulators of tumor biology and lays the foundation for developing personalized therapeutic strategies for ccRCC patients.
Keywords: HSD3B7; bulk RNA-seq; ccRCC; scRNA-seq.
Conflict of interest statement
The authors declare no conflicts of interest.
Figures
Similar articles
-
Deciphering potential molecular mechanisms in clear cell renal cell carcinoma based on the ubiquitin-conjugating enzyme E2 related genes: Identifying UBE2C correlates to infiltration of regulatory T cells.Biofactors. 2025 Jan-Feb;51(1):e2143. doi: 10.1002/biof.2143. Epub 2024 Nov 29. Biofactors. 2025. PMID: 39614426
-
Research on the effect of LAMP1 in the development and progression of ccRCC and its potential mechanism with LC3C-mediated autophagy.Front Immunol. 2024 Nov 28;15:1494005. doi: 10.3389/fimmu.2024.1494005. eCollection 2024. Front Immunol. 2024. PMID: 39669571 Free PMC article.
-
Identifying an Inversin as a Novel Prognostic Marker in Patients with Clear-Cell Renal Cell Carcinoma.Int J Mol Sci. 2024 Nov 12;25(22):12120. doi: 10.3390/ijms252212120. Int J Mol Sci. 2024. PMID: 39596188 Free PMC article.
-
Impact of residual disease as a prognostic factor for survival in women with advanced epithelial ovarian cancer after primary surgery.Cochrane Database Syst Rev. 2022 Sep 26;9(9):CD015048. doi: 10.1002/14651858.CD015048.pub2. Cochrane Database Syst Rev. 2022. PMID: 36161421 Free PMC article. Review.
-
Exploring necrosis-associated mitochondrial gene signatures: revealing their role in prognosis and immunotherapy of renal clear cell carcinoma.Clin Exp Med. 2024 Jul 18;24(1):161. doi: 10.1007/s10238-024-01426-9. Clin Exp Med. 2024. PMID: 39023752 Free PMC article. Review.
References
-
- Trpkov K., Hes O., Williamson S.R., Adeniran A.J., Agaimy A., Alaghehbandan R., Amin M.B., Argani P., Chen Y.B., Cheng L., et al. New developments in existing WHO entities and evolving molecular concepts: The Genitourinary Pathology Society (GUPS) update on renal neoplasia. Mod. Pathol. 2021;34:1392–1424. doi: 10.1038/s41379-021-00779-w. - DOI - PubMed
-
- Zhao P., Zhu J., Wang L., Li N., Zhang X., Li J., Luo Y., Li Q. Comparative diagnostic performance of contrast-enhanced ultrasound and dynamic contrast-enhanced magnetic resonance imaging for differentiating clear cell and non-clear cell renal cell carcinoma. Eur. Radiol. 2023;33:3766–3774. doi: 10.1007/s00330-023-09391-9. - DOI - PubMed
MeSH terms
Substances
Grants and funding
LinkOut - more resources
Full Text Sources
Medical
