. 2024 Dec 6;5(1):66.
doi: 10.1186/s43556-024-00234-7.

Single-cell transcriptome profiling of m6A regulator-mediated methylation modification patterns in elderly acute myeloid leukemia patients

Affiliations

Single-cell transcriptome profiling of m6A regulator-mediated methylation modification patterns in elderly acute myeloid leukemia patients

Zhe Wang et al. Mol Biomed. .

Abstract

Millions of people worldwide die of acute myeloid leukaemia (AML) each year. Although N6-methyladenosine (m6A) modification has been reported to regulate the pathogenicity of AML, the mechanisms by which m6A induces dysfunctional hematopoietic differentiation in elderly AML patients remain elusive. This study elucidates the mechanisms of the m6A landscape and the specific roles of m6A regulators in hematopoietic cells of elderly AML patients. Notably, fat mass and obesity-associated protein (FTO) was found to be upregulated in hematopoietic stem cells (HSCs), myeloid cells, and T-cells, where it inhibits their differentiation via the WNT signaling pathway. Additionally, elevated YT521-B homology domain family proteins 2 (YTHDF2) expression in erythrocytes was observed to negatively regulate differentiation through oxidative phosphorylation, resulting in leukocyte activation. Moreover, IGF2BP2 was significantly upregulated in myeloid cells, contributing to an aberrant chromosomal region and disrupted oxidative phosphorylation. m6A regulators were shown to induce abnormal cell-cell communication within hematopoietic cells, mediating ligand-receptor interactions across various cell types through the HMGB1-mediated pathway, thereby promoting AML progression. External validation was conducted using an independent single-cell RNA sequencing (scRNA-Seq) dataset. The THP-1 and MV411 cell lines were utilized to corroborate the m6A regulator profile; in vitro experiments involving short hairpin RNA (shRNA) targeting FTO demonstrated inhibition of cell proliferation, migration, and oxidative phosphorylation, alongside induction of cell cycle arrest and apoptosis. In summary, these findings suggest that the upregulation of m6A regulators in HSCs, erythrocytes, myeloid cells, and T-cells may contribute to the malignant differentiation observed in AML patients. This research provides novel insights into the pathogenesis of AML in elderly patients and identifies potential therapeutic targets.

Keywords: Acute myeloid leukemia; M6A; Malignant differentiation; Single-cell RNA-seq; WNT signaling.


Conflict of interest statement

Declarations. Ethics approval and consent to participate: This study was performed in line with the principles of the Declaration of Helsinki. All procedures were approved by the Ethics Committee of Shanxi Bethune Hospital (IRB-number: SBQKL-2021-051). Consent for publication: Patients signed informed consent regarding publishing their data, including Table S1 and Table S3. Competing interests: The authors declare that the research was conducted in the absence of any commercial or financial relationships that could be construed as a potential conflict of interest.

Figures
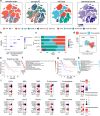
Fig. 1
Fig. 1
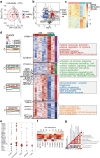
Diverse cell types in the AML delineated by Single-cell RNA-seq(scRNA-seq) analysis. a t-Distributed Stochastic Neighbor Embedding(tSNE) of the 54,809 cells profiled here, with each cell color coded for (left to right): its sample type of origin (malignant or non-malignant), the corresponding patient, the associated cell type and the unique molecular identifier (UMI) detected in that cell (log scale as defined in the inset). b The plot shows identified cell types and annotated using classical marker genes. c Data of the five cell clusters of 54,809 cells from 5 samples (from left to right): the fraction of cells originating from each patient. d Differential expression of genes in different cell types of AML patients compared with control samples. e and g Kaplan - Meier curves showing progression-free survival in GEPIA 2 in AML Cohort stratified according to high vs. low expression of NHP2 (e) and PLIN5 (g). f and h Heatmap showing the representative gene ontology enriched in upregulated (f) or downregulated (h) genes in each cell type (p < 0.05). i Differential expression of N6-methyladenosine (m6A) regulators in different cell types of AML patients compared with control samples from respective cell-type assignments; The size of the dots indicates the average multiple of difference, and the color of the dots indicates up-regulated (red) or down-regulated (purple)
Fig. 2
Fig. 2
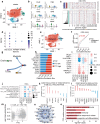
Expression patterns of m6A regulator in AML patients and healthy individuals. a Principal Component Analysis (PCA) was employed on 23 m6A regulators to differentiate between tumor and normal samples. b Volcano-plot representation of differentially expressed genes (DEGs). Red, up-regulation; blue, down-regulation. c Heatmap of the DEGs between the gene clusters and different clinical data was shown in the annotation. d Expression patterns of m6A regulators in AML patients and healthy individuals. Heatmap of DEGs between AML and control groups; the m6A regulators in each module were annotated; the line graph showed the trend in the gene module expression, the text on the right showed the enriched pathways for each module gene. e The DEGs patterns of m6A regulators of diverse cell types. f Gene set variation analysis (GSVA) enrichment analysis showing the association between m6A regulators and HSC differentiation in AML. g Spearman’s correlation was used to analyze the correlation between the m6A regulators and classical AML related pathways. Red, positive correlation; blue, negative correlation
Fig. 3
Fig. 3
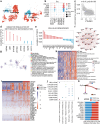
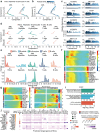
FTO upregulated caused impaired hemocyte differentiation in malignant haematopoietic stem cells (HSCs). a tSNE plot showing HSC subclusters. b Relative expression levels of the PCLAF, TYMS, TOP2A, ASPM, ATP8B4 and AHNAK gene across 5 HSC subclusters. c Inferred Copy Number Variants (CNV) levels in each HSC cluster across 22 chromosomes. d The correlation between the key genes(ATP8B4 and AHNAK) of HSC subclusters2 and m6A score signatures in HSCs. e tSNE plot showing the benign and malignant HSC subclusters. f Comparison of cumulative probability of m6A score signatures between benign and malignant in HSCs. (Wilcox test, p < 0.001). g and h According to the expression level of FTO in HSCs, the patients were divided into two groups; red lines represent stronger communication in FTO high expression group, and blue lines represent weaker communication in FTO high expression group (left), rank signaling networks based on the information flow or the number of interactions (right). i and j The correlation analysis between the key genes or pathways and m6A regulators expression in HSCs. k and l The genes of HSCs proliferation and negative regulation of cellular senescence had a significant correlation with FTO expression level; m Spearman correlation between FTO and HSCs proliferation. n Networks of weighted gene co-expression network analysis (WGCNA) module which included FTO in HSCs. o Enrichment analysis for FTO module by Gene Ontology (GO) enrichment
Fig. 4
Fig. 4
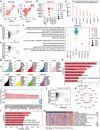
Specific upregulation of YTHDF2 in Erythrocytes resulted in negative regulation of erythrocyte differentiation. a Reclustering of erythrocytes and erythroblasts reveals different distribution of cells. b The correlation between the key genes and m6A regulators in erythrocytes. c Spearman correlation between YTHDF2 and erythrocyte homeostasis. d and e The genes of erythrocyte differentiation and cellular senescence had a significant correlation with YTHDF2 expression level. f Networks of WGCNA module which included YTHDF2 in Erythrocytes. g And enrichment analysis on YTHDF2 module by Metascape. h and i Metabolic pathway activities in Erythrocytes via YTHDF2 high and low expression. Glycolysis in Erythrocytes via YTHDF2 high and low expression. Statistically non-significant values are shown as blank. j Communication and ligand-receptor interaction between erythrocyte and neighboring cells showing in the dotplot (high YTHDF2 versus low YTHDF2). k and l According to the expression level of YTHDF2 in Erythrocytes, the patients were divided into two groups; red lines represent stronger communication in YTHDF2 high expression group, and blue lines represent weaker communication in YTHDF2 high expression group (left), rank signaling networks based on the information flow or the number of interactions (right)
Fig. 5
Fig. 5
FTO and IGF2BP2 promoted the increase of pathological myeloid differentiation. a Reclustering of Myeloids reveals different distributions of malignant and normal cells. b The correlation between the key genes and m6A regulators in Myeloids. c The genes of negative regulation of haematopoietic progenitor cell differentiation had a significant correlation with FTO expression level. d and e Spearman correlation between FTO and negative regulation of haematopoietic progenitor cell differentiation, negative regulation of apoptosis pathway. f The correlation analysis between the key pathways and m6A regulators expression in Myeloids. g WGCNA identifies brown modules with correlated gene expression patterns in Myeloids of AML patients. h Enrichment analysis for FTO module by GO enrichment. i The genes of chromosomal region had a significant correlation with IGF2BP2 expression level. j Spearman correlation between IGF2BP2 and chromosomal region. k Networks of PINK module which included IGF2BP2 in Myeloids. l And enrichment analysis for PINK module by GO enrichment. m Metabolic pathway activities in Myeloids via IGF2BP2 high and low expression
Fig. 6
Fig. 6
m6A regulators dysregulated cytopathologic differentiation in diverse cell types. a Pseudo-time trajectory of diverse cell type, b and Pseudo-time trajectory of cell of AML with gene expression profiles inferred by Monocle 2. Each point corresponds to a single cell. c Fitted curves showing dynamic expression changes in representative m6A genes in each gene group based on AML progressing time. d Pseudotime analysis of each cell type. HSCs, Myeloids, Erythrocytes, TCells and BCells were divided into relatively malignant (Pseudotime < 5) and benign (Pseudotime ≥ 5) groups. e The proportions of HSCs, Myeloids, Erythrocytes, TCells and BCells; pseudo-time was shown on the horizontal axis. f Heatmap of m6A regulator expression profiles based on pseudo-time trajectory of 3 cluster cells of AML. g Heatmap of key genes of 3 cluster cells profiles based on pseudo-time is indicated on the horizontal axis. h Heatmap representing the smoothed expression of pseudo-time-dependent genes along pseudo-timeline of AML cell fate branch; Pseudo-time-dependent genes were grouped into three clusters according to different expression patterns, and the m6A regulators included in each module were annotated. i Bar plot of key genes of HSCs module, Myeloids module, Erythrocytes module enriched pathways. j NicheNet was used to analyze the expression of ligands and receptors to identify the intercellular communication patterns between Erythrocytes and HSCs
Fig. 7
Fig. 7
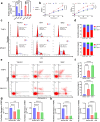
FTO regulated THP-1 and MV411 cells proliferation and oxidative phosphorylation, while inhibited cell cycle arrest and apoptosis. a Quantitative Real-Time Polymerase Chain Reaction (qRT–PCR) analysis of FTO expression in THP-1 and MV411 cells transfected with sh-NC and sh-FTO expression vector. b The growth curves of cells transfected with indicated vectors were evaluated by Cell Counting Kit-8 (CCK-8) assays. c and d The cell cycle progression was analyzed by flow cytometer after being transfected with indicated plasmids. e and f Apoptosis rate was analyzed by flow cytometer after being transfected with sh-NC and sh-FTO expression vector. g and h WNT1 and YTHDF2 expression in THP-1 and MV411 cells transfected with sh-NC and sh-FTO expression vector, ** and *** represent p < 0.01 and p < 0.001, respectively (THP-1 cell on the left and MV411 cell on the right of the bar graphs)

Similar articles

References

    1. Short NJ, Rytting ME, Cortes JE. Acute myeloid leukaemia. Lancet. 2018;392(10147):593–606. - PMC - PubMed
    1. Yi M, Li AP, Zhou LH, Chu Q, Song YP, Wu KM. The global burden and attributable risk factor analysis of acute myeloid leukemia in 195 countries and territories from 1990 to 2017: estimates based on the global burden of disease study 2017. J Hematol Oncol. 2020;13(1):72. 10.1186/s13045-020-00908-z. - PMC - PubMed
    1. Urbino I, Secreto C, Olivi M, Apolito V, D’Ardia S, Frairia C, et al. Evolving therapeutic approaches for older patients with Acute myeloid leukemia in 2021. Cancers. 2021;13(20): 5075. 10.3390/cancers13205075. - PMC - PubMed
    1. Webster JA, Pratz KW. Acute myeloid leukemia in the elderly: therapeutic options and choice. Leuk Lymphoma. 2018;59(2):274–87. 10.1080/10428194.2017.1330956. - PMC - PubMed
    1. Creutzig U, Zimmermann M, Reinhardt D, Rasche M, von Neuhoff C, Alpermann T, et al. Changes in Cytogenetics and Molecular Genetics in Acute Myeloid Leukemia from Childhood to Adult Age groups. Cancer. 2016;122(24):3821–30. 10.1002/cncr.30220. - PubMed

Publication types

MeSH terms

LinkOut - more resources