. 2024 Nov 12;15(48):20274-20291.
doi: 10.1039/d4sc05459h. eCollection 2024 Dec 11.

Rapid, potent, and persistent covalent chemical probes to deconvolute PI3Kα signaling

Affiliations

Rapid, potent, and persistent covalent chemical probes to deconvolute PI3Kα signaling

Lukas Bissegger et al. Chem Sci. .

Abstract

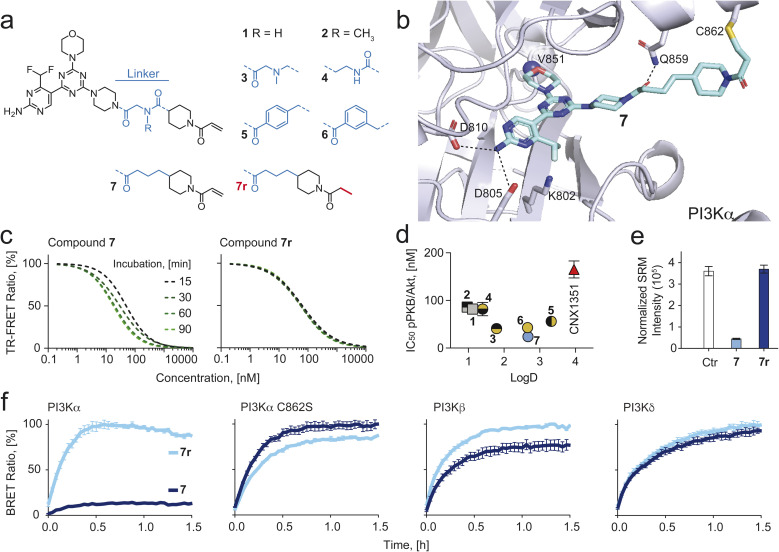
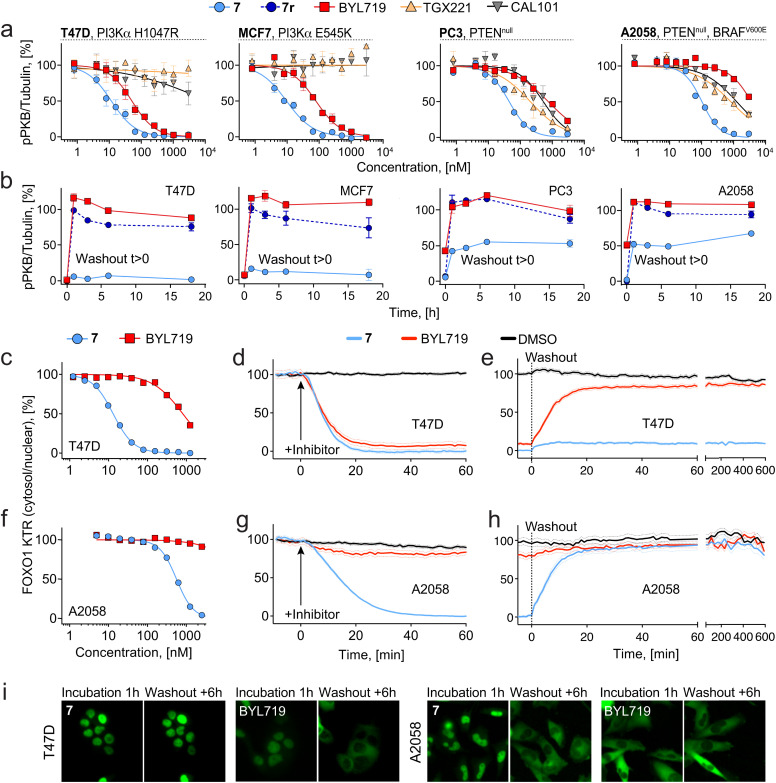
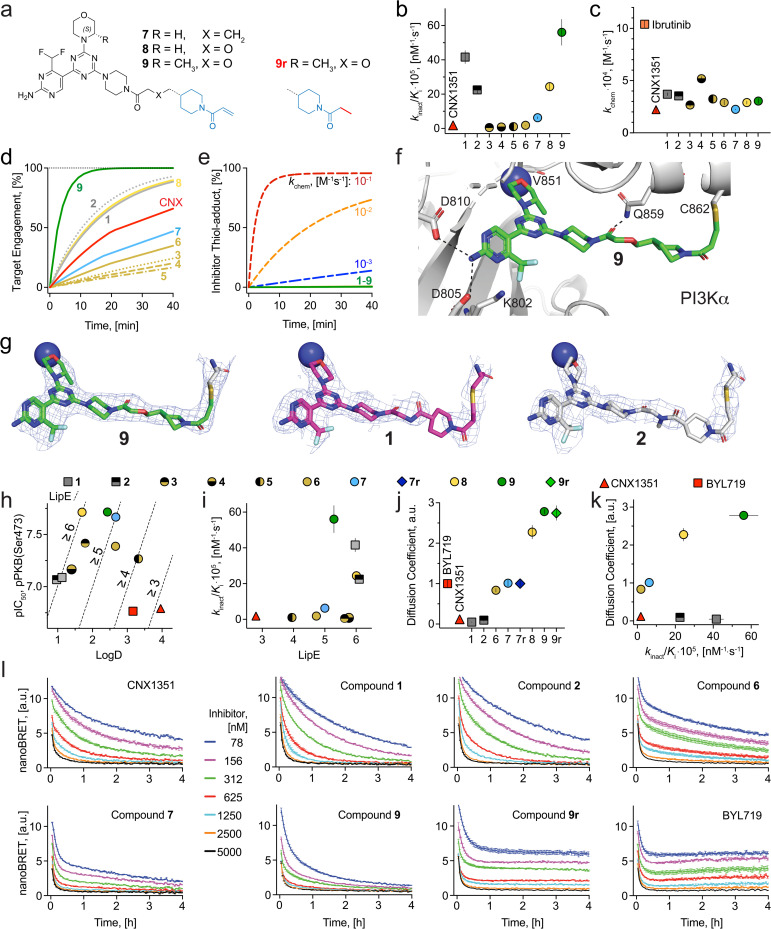
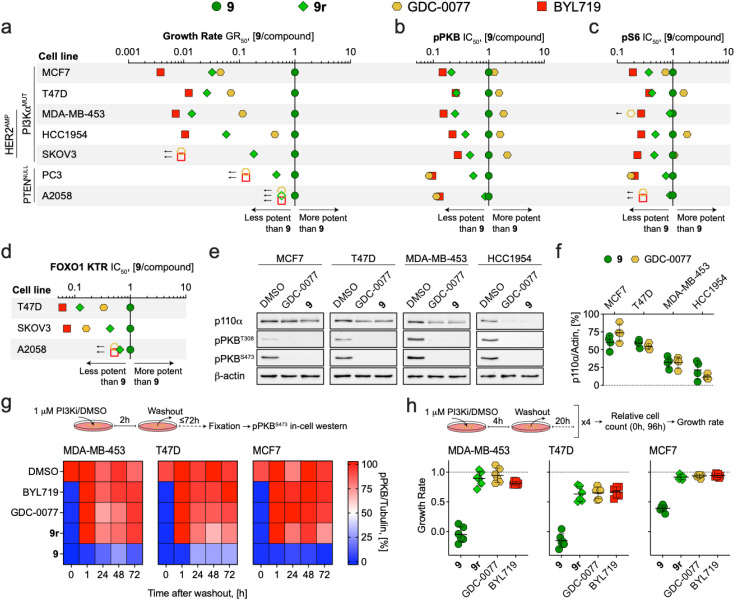
Chemical probes have gained importance in the elucidation of signal transduction in biology. Insufficient selectivity and potency, lack of cellular activity and inappropriate use of chemical probes has major consequences on interpretation of biological results. The catalytic subunit of phosphoinositide 3-kinase α (PI3Kα) is one of the most frequently mutated genes in cancer, but fast-acting, high-quality probes to define PI3Kα's specific function to clearly separate it from other class I PI3K isoforms, are not available. Here, we present a series of novel covalent PI3Kα-targeting probes with optimized intracellular target access and kinetic parameters. On-target TR-FRET and off-target assays provided relevant kinetic parameters (k chem, k inact and K i) to validate our chemical probes. Additional intracellular nanoBRET tracer displacement measurements showed rapid diffusion across the cell membrane and extremely fast target engagement, while investigations of signaling downstream of PI3Kα via protein kinase B (PKB/Akt) and forkhead box O (FOXO) revealed blunted pathway activity in cancer cell lines with constitutively activated PI3Kα lasting for several days. In contrast, persistent PI3Kα inhibition was rapidly bypassed by other class I PI3K isoforms in cells lacking functional phosphatase and tensin homolog (PTEN). Comparing the rapidly-diffusing, fast target-engaging chemical probe 9 to clinical reversible PI3Kα-selective inhibitors alpelisib, inavolisib and 9r, a reversible analogue of 9, revealed 9's superior potency to inhibit growth (up to 600-fold) associated with sustained suppression of PI3Kα signaling in breast cancer cell lines. Finally, using a simple washout protocol, the utility of the highly-selective covalent PI3Kα probe 9 was demonstrated by the quantification of the coupling of insulin, EGF and CXCL12 receptors to distinct PI3K isoforms for signal transduction in response to ligand-dependent activation. Collectively, these findings along with the novel covalent chemical probes against PI3Kα provide insights into isoform-specific functions in cancer cells and highlight opportunities to achieve improved selectivity and long-lasting efficacy.


Conflict of interest statement

MPW is founder and shareholder of Akylox Therapeutics ApS.

Figures

Fig. 1
Fig. 1. (a) Chemical structure of eight PI3Kα-selective inhibiting chemical probes. (b) Modelling of compound 7 bound covalently to Cys862 of p110α (PDB ID: 7R9V was used as a starting point). H-bonds are depicted as dashed black lines. (c) Time-dependent IC50 shift derived from time-resolved fluorescence resonance energy transfer (TR-FRET) ratios (Fig. S2 for all compounds), comparing compound 7 and its reversible analogue 7r. (d) IC50 values for PKB phosphorylation (pPKB, Ser473) measured in SKOV3 cells by in-cell western (ICW) plotted against log D values (measured by Bienta Enamine Biology Services). Data shown are mean ± SD from at least n = 3 independent experiments. Error bars are not shown when smaller than symbols. (e) LC-SRM quantification of covalent Cys862-modification by 7 and no covalent modification by 7r. (f) Bioluminescence resonance energy transfer (BRET) target occupancy assay in live HEK293 cells. The cells were transiently transfected with constructs encoding a Nanoluciferase (Nanoluc) fused to different PI3K isoforms (PI3Kα, PI3Kβ and PI3Kδ) or a Cys862 to Ser mutated PI3Kα. 24 h after transfection, cells were incubated with 3 μM of 7 or 7r for 2 h. The probes were washed out (twice for 10 min with Opti-MEM) and a cell-permeable Py-BODIPY moiety bearing a fluorescent energy transfer probe (BRET tracer) was added to the cells (0.2 μM final concentration). Recovery of the BRET signal, resulting from displacement of the inhibitor from the ATP-binding pocket, was monitored for 1.5 h. Prolonged target occupancy after probe washout indicates covalent bond formation. Data shown are mean ± SEM (n = 3).
Fig. 2
Fig. 2. (a) PI3Kα or PTEN-mutated cancer cell lines were incubated for 1 h with a range of concentrations (3 μM to 0.8 nM) of isoform-selective PI3K inhibitors (7, covalent PI3Kα-selective; 7r, reversible analogue of 7; BYL719, reversible PI3Kα-selective, TGX221, reversible PI3Kβ-selective; CAL101, reversible PI3Kδ-selective). Phosphorylation of PKB (pPKB, Ser473) was determined by in-cell western (ICW) assay. Data shown are mean ± SEM from n = 3 independent experiments. (b) Cells were incubated for 2 h with 3 μM of inhibitor, followed by drug washout (twice for 10 min with growth medium supplemented with 10% FCS). Subsequently, cells were incubated at 37 °C and 5% CO2 for the indicated times before fixation. Phosphorylation PKB (pPKB, Ser473) was determined in at least n = 3 independent experiments by ICW assay. Data shown are mean ± SEM from n = 4 independent experiments. (c–h) Concentration and time dependent nuclear translocation of FOXO1 KTR probe in response to 7 or BYL719. Cytosol/nuclear ratio of FOXO1 KTR probe was determined with batch analysis using Cell Profiler software (for details see Methods). (c and f) Concentration-dependent IC50 determination in (c) T47D and (f) A2058 cells incubated with compounds for 1 h. (d and g) Time-dependent FOXO1 KTR probe translocation into the nucleus following treatment with 3 μM of 7, BYL719 or DMSO in (d) T47D and (g) A0258 cells. (e and h) Cells were incubated with 7, BYL179 or DMSO (3 μM) for 1 h, followed by washout (twice for 10 min with growth medium supplemented with 10% FCS). (i) Representative images of (left) T47D and (right) A2058 cells incubated with 7 or BYL719 (3 μM) for 1 h (prior to washout) and 6 h after inhibitor washout.
Fig. 3
Fig. 3. (a) Chemical structure of three covalent PI3Kα-selective chemical probes and one reversible analogue (9r). (b) Comparison of the second order rate constant for 9 covalent chemical probes and CNX1351. Dissociation constants (Ki) and rate for covalent binding to PI3Kα constants (kinact) were used to characterize covalent binding efficiency. The kinetic parameters were calculated with global fitting from TR-FRET ratios (Fig. S5†) for numerical integration on a kinetic model using KinTek Global Kinetic Explorer modeling software. Values are shown as mean ± SD (n = 3). (c) Intrinsic reactivity (kchem) of 9 covalent chemical probes, CNX1351 and ibrutinib. For details and SD see Table S1. (d) Modelling of on-target reactivity. Experimentally determined intrinsic reactivity, dissociation and rate constants (kchem, Ki and kinact) were used for each compound to model the target engagement with 10 nM PI3Kα and 100 nM compound over 40 minutes. (e) Modelling of off-target reactivity. Side reactions between compounds 1–9 (green line, intrinsic warhead reactivity below 10−3 M−1 s−1) and 7 mM GSH. Modelling of side reactions was carried out with KinTek Global Kinetic Explorer modeling software. (f) X-ray co-crystallographic structure of PI3Kα with 9 (green) (PDB-ID: 8TWY) bound covalently to Cys862 of p110α. H-bonds are depicted as dashed black lines (data collection and refinement statistics are reported in Table S3†). (g) Electron density maps of compound 9 (PDB-ID: 8TWY) compared with compounds 1 (PDB-ID: 7R9V) and 2 (PDB-ID: 7R9Y) covalently bound to p110α (h) lipophilic efficiency (LipE) analysis of covalent chemical probes and BYL719. IC50 values (pPKB, Ser473) measured in SKOV3 cells by in-cell western (ICW) plotted against log D values. Data shown are mean ± SD from at least n = 3 independent experiments (for calculation see Table S4†). (i) Covalent binding efficiency (kinact/Ki) plotted against LipE values. Data shown are mean ± SD from at least n = 3 independent experiments. (j) Diffusion coefficients of 6 covalent chemical probes, two reversible analogues (7r and 9r), CNX1351 and BYL719. Diffusion coefficients were obtained by fitting the NanoBRET data (Fig. 3l) with KinTek Global Kinetic Explorer software (see Methods for detailed calculations). Values are shown as mean ± SD (n = 3; for calculations see Table S5†). (k) Diffusion coefficients plotted against covalent binding efficiency (kinact/Ki) for 6 covalent chemical probes and CNX1351. Values are shown as mean ± SD (n = 3). Error bars are not shown when smaller than symbols. (l) Target engagement in live HEK293 cells using bioluminescence resonance energy transfer (BRET) assay. HEK293 cells transfected with N-terminal Nanoluc fused to PI3Kα were pre-incubated with Tracer K-3 (Promega) and NanoBRET NanoGlo substrate for 20 min (37 °C, 5% CO2). Subsequently, compounds were added at different concentrations and BRET signal was measured for 4 h. Values are shown as mean ± SEM (n = 3).
Fig. 4
Fig. 4. (a–d) Dot plots comparing the potency of covalent compound 9 to reversible PI3Kα inhibitors in PI3Kα or PTEN mutant cancer cell lines. (a) GR50 ratios for cell growth determined after 72 h incubation (see Table S6 for GR50 values). (b) IC50 ratios for PKB phosphorylation (pPKB, Ser473) determined after 2 h incubation (see Table S8 for pPKB IC50 values). (c) IC50 ratios for ribosomal protein S6 phosphorylation (pS6, Ser235/Ser236) determined after 2 h incubation. See Table S9 for calculated pS6 IC50 values. (d) IC50 ratios for FOXO1 KTR translocation (cytosolic/nuclear ratio) determined after 2 h incubation. Symbols show the ratio of GR50/IC50 values derived from at least n = 3 independent experiments. Where GR50/IC50 values were extrapolated, ratios were calculated using the highest assay concentration instead and represented as empty symbols (GR50 – 5 μM; pS6 IC50 – 3 μM). See Fig. S8 for dose–response curves. (e) Detection of p110α, phosphorylated PKB (pPKB, Thr308 and Ser473), and β-actin by western blot in cell lines treated with DMSO, 9 (1 μM), or GDC-0077 (1 μM) for 48 h prior to lysis (representative images are shown). (f) Quantification of remaining p110α protein levels relative to DMSO control (n = 4, mean ± SD). (g) Heatmaps showing pPKB (Ser473) levels in cell lines treated with DMSO or PI3Kα inhibitors (1 μM) for 2 h, followed by drug washout (twice for 10 min with fully supplemented growth medium), and further incubation in fully supplemented growth medium for the indicated times. pPKB levels were determined by in-cell western in n = 2 independent experiments (t = 0, inhibitor present). (h) Growth rate of cancer cell lines with mutated PI3Kα in response to intermittent inhibitor exposure (4 h per day followed by washout on 4 consecutive days; n = 2 independent experiments with each in technical triplicates, mean ± SD).
Fig. 5
Fig. 5. (a) Schematic diagram of PI3K pathway stimulation in cancer cell lines to deconvolute PI3Kα isoform contribution downstream of membrane receptors. Serum starved cells (24 h) were incubated with 1 μM 9 or DMSO for 2 h followed by washout (labelled 9-wo or DMSO-wo). Receptor ligands (L) were then added to the medium in the absence or presence of the PI3Kβ-selective inhibitor TGX221 (1 μM) for the indicated times (5, 30, 180 min) prior to lysis. Total PKB and pPKB (Ser473) levels were measured by western blot (Fig. S9†). All treatments and media changes were carried out using serum-free medium. Depicted in the schematic are the active and inactive (red line-crossed) PI3K isoforms resulting from inhibitor treatments. (b) PI3K signaling in MCF7 cells treated with inhibitors and stimulated with 10 ng mL−1 EGF (left), 10 μg mL−1 insulin (center) or 50 ng mL−1 CXCL12 (right). (c) Quantification of PI3K isoform contribution (area under curve) to PI3K signaling in response to EGF, insulin and CXCL12 in MCF7 cells. (d) PI3K signaling in SKOV3 cells treated with inhibitors and stimulated with 10 ng mL−1 EGF (left), 10 μg mL−1 insulin (center) or 50 ng mL−1 CXCL12 (right). (e) Quantification of PI3K isoform contribution (area under curve) to PI3K signaling in response to EGF, insulin and CXCL12 in SKOV3 cells.
Fig. 6
Fig. 6. Interactions of compound 9 at 1 μM with protein and lipid kinases visualized as kinome TREEspot™ plot. Kinases that bind to 9 are marked by red circles (larger circles indicate higher-affinity; see free kinase as % of control). Kinases are organized according to phylogeny and kinase families, including atypical kinases, lipid kinases, mutated kinases and some pathogen-derived kinases: AGC: PKA, PKG and PKC kinases; CAMK: calcium-calmodulin-dependent protein kinases; CK1: casein kinase 1; CMGC: CDK, MAPK, GSK3, CLK family kinases; STE: homologs of yeast sterile 7, sterile 11, sterile 20 kinases; TK: tyrosine kinases; TKL: tyrosine kinase-like. Precise% values for 9 are in Table S11, together with previously reported kinase interaction data for 1 and BYL719 (alpelisib), PQR514, PQR309, GDC0980, and PKI-057. Extended TREEspot™ in Fig. S11; selectivity scores are depicted in Table S12.

Similar articles

References

    1. Blagg J. Workman P. Choose and Use Your Chemical Probe Wisely to Explore Cancer Biology. Cancer Cell. 2017;32:9–25. doi: 10.1016/j.ccell.2017.06.005. https://dx.doi.org/10.1016/j.ccell.2017.06.005 - DOI - DOI - PMC - PubMed
    1. Vu V. Szewczyk M. M. Nie D. Y. Arrowsmith C. H. Barsyte-Lovejoy D. Validating Small Molecule Chemical Probes for Biological Discovery. Annu. Rev. Biochem. 2022;91:61–87. doi: 10.1146/annurev-biochem-032620-105344. https://dx.doi.org/10.1146/annurev-biochem-032620-105344 - DOI - DOI - PubMed
    1. Garbaccio R. M. Parmee E. R. The Impact of Chemical Probes in Drug Discovery: A Pharmaceutical Industry Perspective. Cell Chem. Biol. 2016;23:10–17. doi: 10.1016/j.chembiol.2015.11.011. https://dx.doi.org/10.1016/j.chembiol.2015.11.011 - DOI - DOI - PubMed
    1. Bunnage M. E. Chekler E. L. Jones L. H. Target validation using chemical probes. Nat. Chem. Biol. 2013;9:195–199. doi: 10.1038/nchembio.1197. https://dx.doi.org/10.1038/nchembio.1197 - DOI - DOI - PubMed
    1. Arrowsmith C. H. Audia J. E. Austin C. Baell J. Bennett J. Blagg J. Bountra C. Brennan P. E. Brown P. J. Bunnage M. E. Buser-Doepner C. Campbell R. M. Carter A. J. Cohen P. Copeland R. A. Cravatt B. Dahlin J. L. Dhanak D. Edwards A. M. Frederiksen M. Frye S. V. Gray N. Grimshaw C. E. Hepworth D. Howe T. Huber K. V. Jin J. Knapp S. Kotz J. D. Kruger R. G. Lowe D. Mader M. M. Marsden B. Mueller-Fahrnow A. Müller S. O'Hagan R. C. Overington J. P. Owen D. R. Rosenberg S. H. Roth B. Roth B. Ross R. Schapira M. Schreiber S. L. Shoichet B. Sundström M. Superti-Furga G. Taunton J. Toledo-Sherman L. Walpole C. Walters M. A. Willson T. M. Workman P. Young R. N. Zuercher W. J. The promise and peril of chemical probes. Nat. Chem. Biol. 2015;11:536–541. doi: 10.1038/nchembio.1867. https://dx.doi.org/10.1038/nchembio.1867 - DOI - DOI - PMC - PubMed