. 2025 Jan;21(1):30-58.
doi: 10.1038/s44320-024-00075-0. Epub 2024 Nov 19.

Enhancers and genome conformation provide complex transcriptional control of a herpesviral gene

Affiliations

Enhancers and genome conformation provide complex transcriptional control of a herpesviral gene

David W Morgens et al. Mol Syst Biol. 2025 Jan.

Abstract

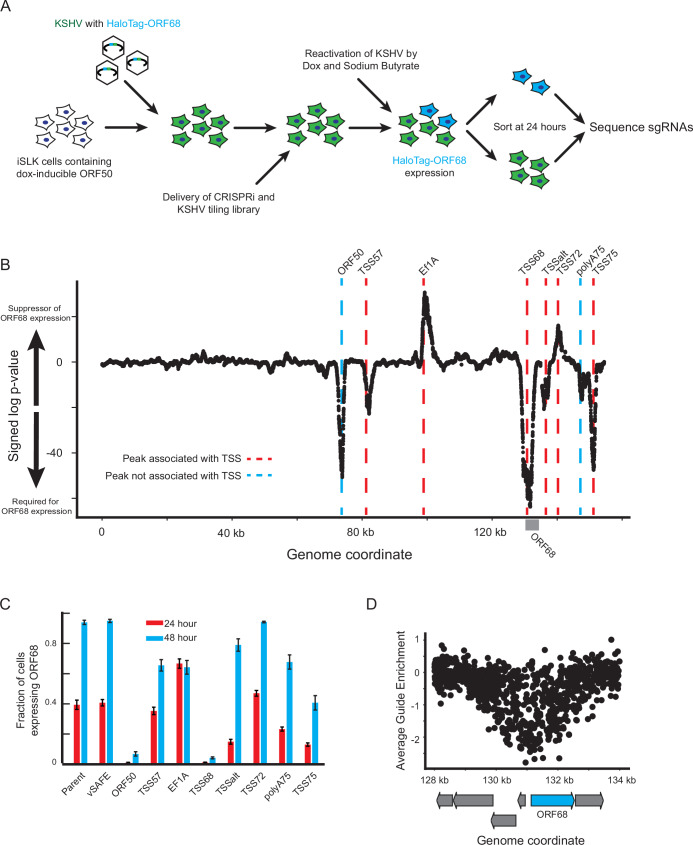
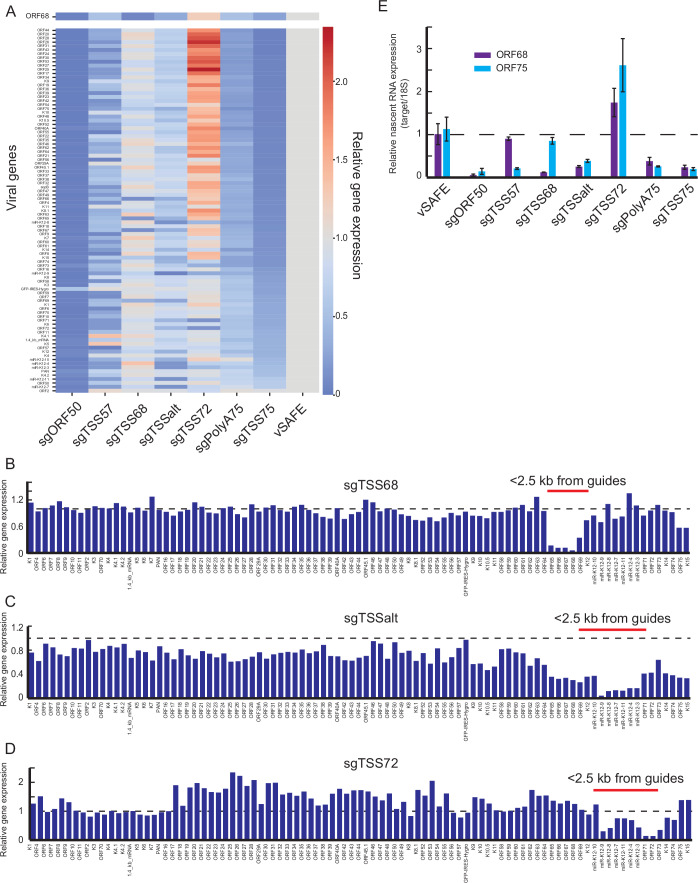
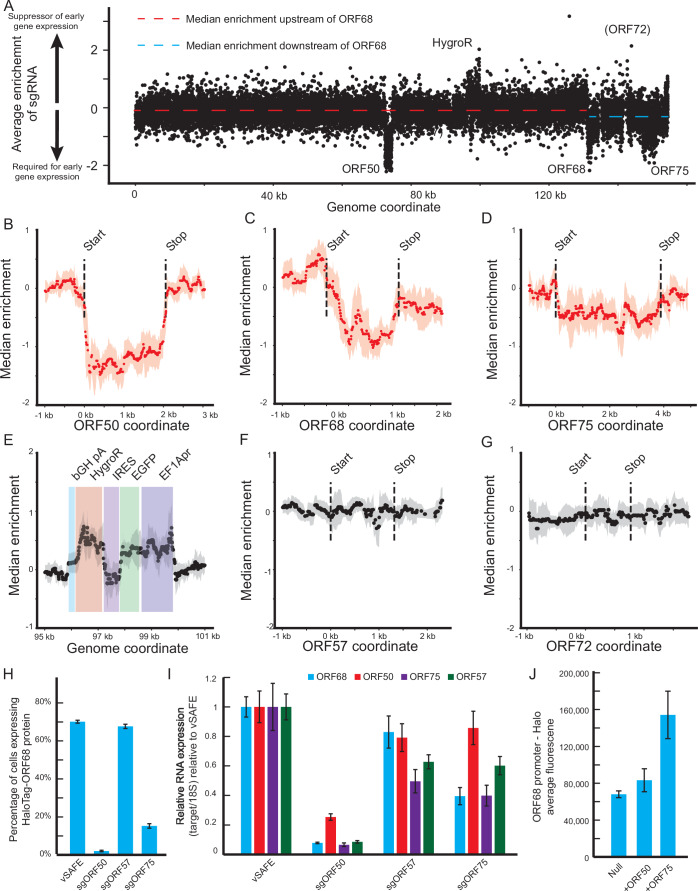
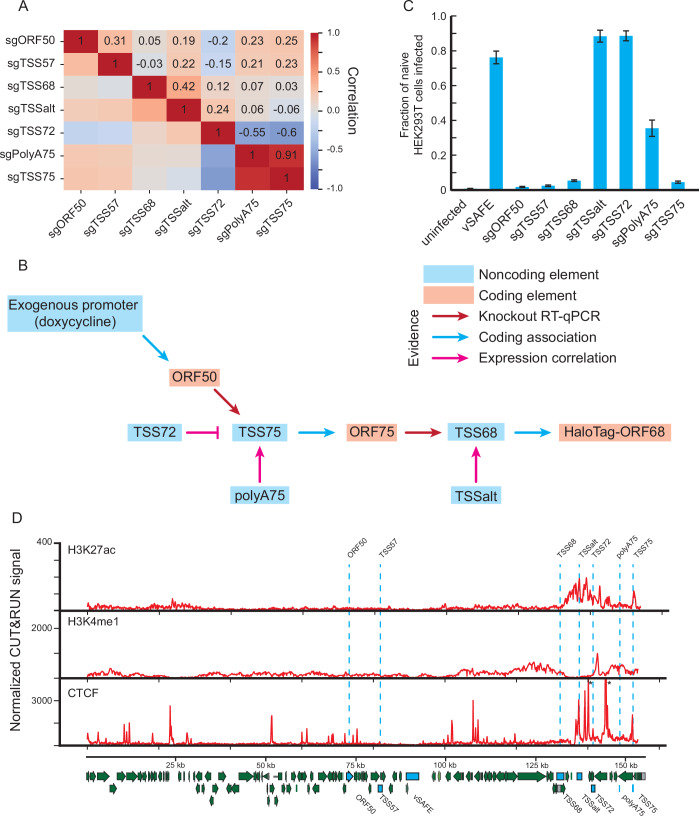
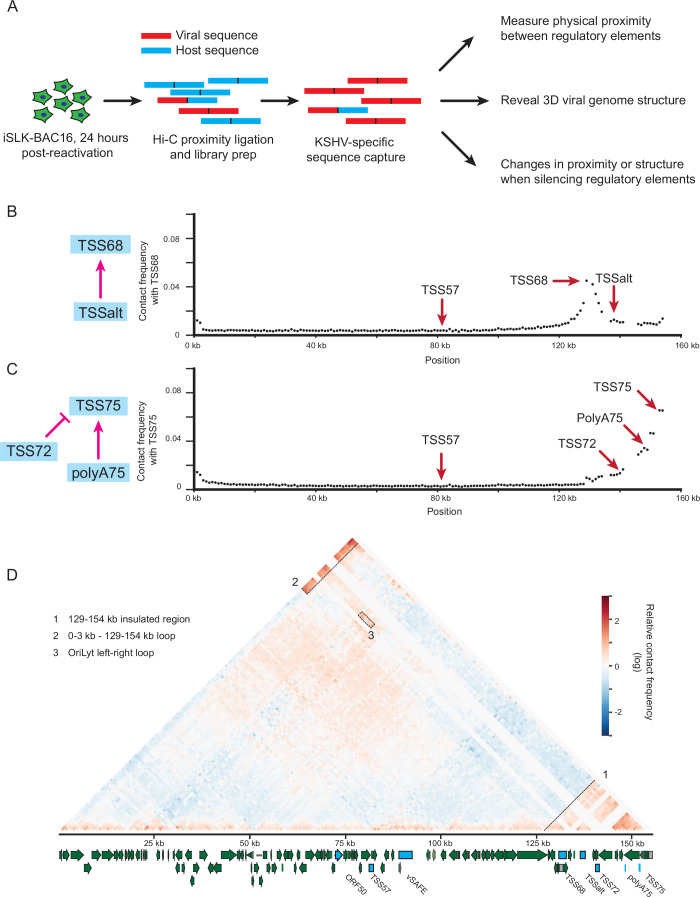
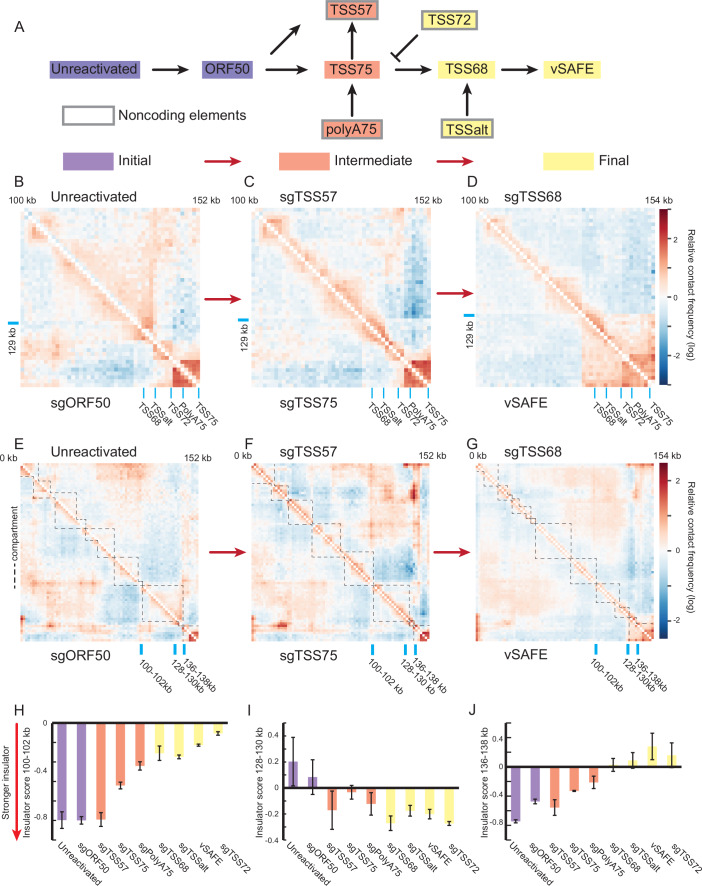
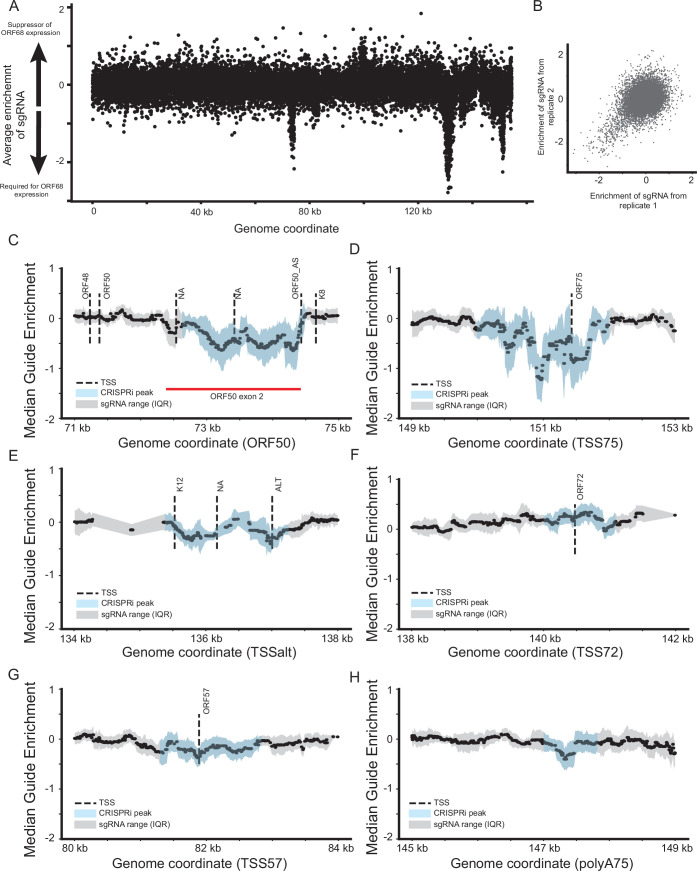
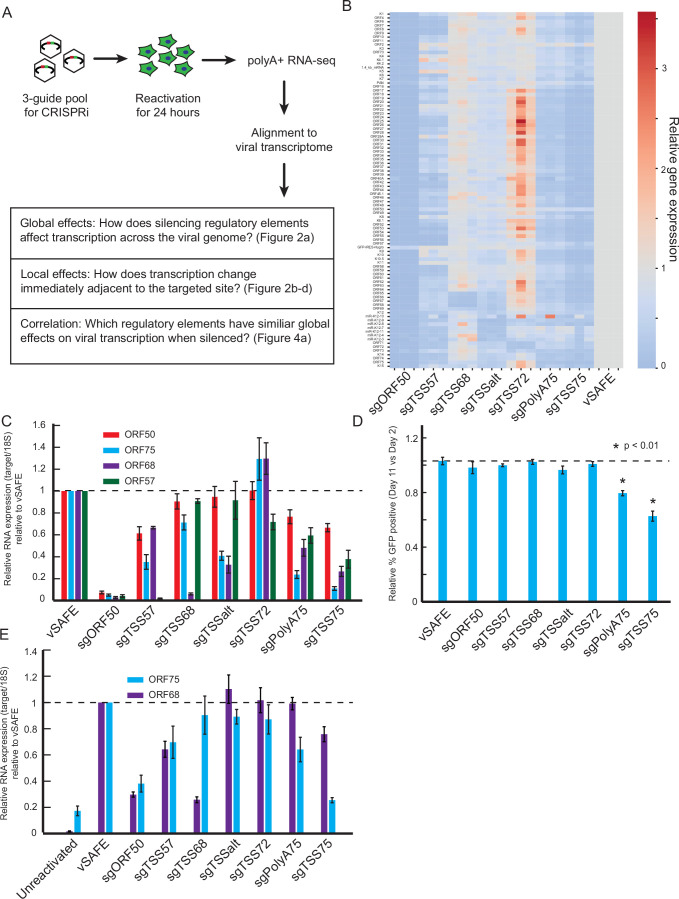
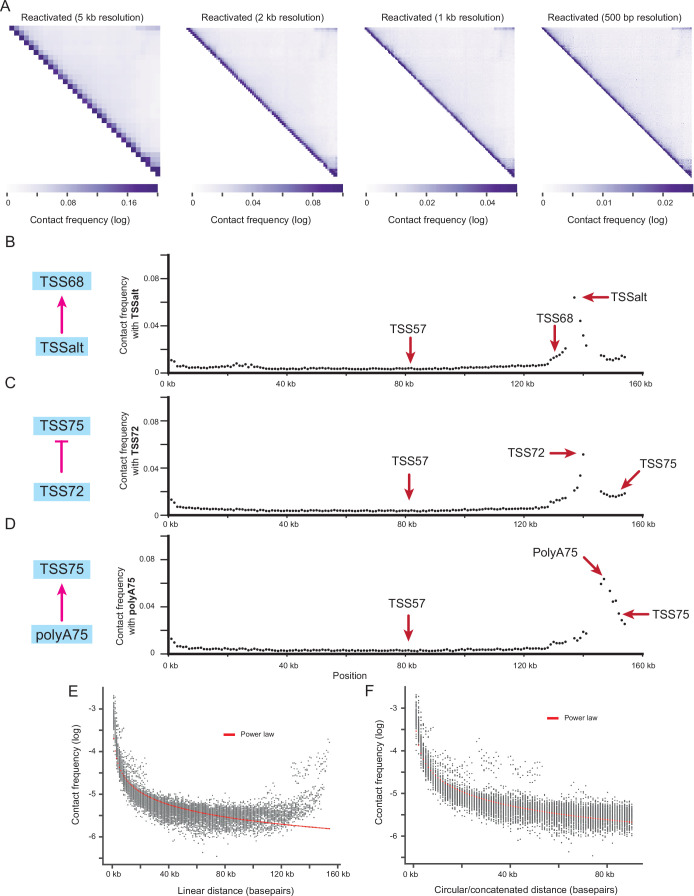
Complex transcriptional control is a conserved feature of both eukaryotes and the viruses that infect them. Despite viral genomes being smaller and more gene dense than their hosts, we generally lack a sense of scope for the features governing the transcriptional output of individual viral genes. Even having a seemingly simple expression pattern does not imply that a gene's underlying regulation is straightforward. Here, we illustrate this by combining high-density functional genomics, expression profiling, and viral-specific chromosome conformation capture to define with unprecedented detail the transcriptional regulation of a single gene from Kaposi's sarcoma-associated herpesvirus (KSHV). We used as our model KSHV ORF68 - which has simple, early expression kinetics and is essential for viral genome packaging. We first identified seven cis-regulatory regions involved in ORF68 expression by densely tiling the ~154 kb KSHV genome with dCas9 fused to a transcriptional repressor domain (CRISPRi). A parallel Cas9 nuclease screen indicated that three of these regions act as promoters of genes that regulate ORF68. RNA expression profiling demonstrated that three more of these regions act by either repressing or enhancing other distal viral genes involved in ORF68 transcriptional regulation. Finally, we tracked how the 3D structure of the viral genome changes during its lifecycle, revealing that these enhancing regulatory elements are physically closer to their targets when active, and that disrupting some elements caused large-scale changes to the 3D genome. These data enable us to construct a complete model revealing that the mechanistic diversity of this essential regulatory circuit matches that of human genes.

Keywords: CRISPR Interference; Capture Hi-C; Gene Regulation; Herpesvirus; KSHV.


Conflict of interest statement

Disclosure and competing interests statement. The authors declare no competing interests.

Figures

Figure 1
Figure 1. CRISPRi screen identifies novel viral regulatory regions.
(A) Schematic of screen. The viral genome encodes a constitutive fluorescent marker (green) and a HaloTag-ORF68 fusion (blue). (B) Summary of results from the CRISPRi screen. The X-axis identifies the genome coordinate on the BAC16 KSHV genome. The Y-axis represents the log-transformed p value of each locus relative to the negative control distribution. Red dotted lines indicate the location of transcriptional start sites. Blue dotted line identifies the two peaks that do not associate with a TSS. (C) Validation of pooled guides targeting each peak. Three guides were used to target each locus identified on the x-axis. The Y-axis displays the mean fraction of cells expressing the HaloTag-ORF68 for the 24 or 48 h post-lytic reactivation timepoints. Error bars represent the standard error of the mean from four replicates from independent reactivations. (D) Enrichment of individual guides at the ORF68 locus. Each dot represents a single guide, with the target location displayed on the x-axis and the average enrichment from two replicates on the y-axis. Arrows represent coding regions of ORF68 (in blue) and surrounding genes in gray. Source data are available online for this figure.
Figure 2
Figure 2. Local effects caused by CRISPRi.
(A) Heatmap of changes to viral gene expression at 24 h relative to vSAFE negative controls, with ORF68 presented at the top. Each column shows relative gene expression changes following CRISPRi-induced suppression of the indicated locus. Values are sorted by the effect of sgTSS75. Average of three replicates. (BD) Change in RNA level of each viral gene relative to vSAFE negative controls in genome order. Genes whose start codons are within 2.5 kb of at least one guide in the targeting pool are highlighted. (E) Nascent RNA expression was measured by RT-qPCR at 24 h post-reactivation from cells treated for 2 h with EU. Mean values are presented relative to parental cells, and error bars are standard errors from three independent replicates. Source data are available online for this figure.
Figure 3
Figure 3. Knockout screen maps associated coding regions.
(A) Enrichment of individual guides. Each dot represents a single guide, with the target location displayed on the x-axis and the average enrichment from two replicates on the y-axis. Red and blue dotted lines represent the median guide enrichment for the two regions indicated. (BG) Median smoothed enrichments from Cas9 nuclease screen at associated coding locus. Dotted lines indicate exon boundaries. For each guide, the median enrichment of a 500 bp window centered at the target locus was calculated along with an IQR. The median value is shown as a point, and IQR is shown as a shaded region. Regions were considered significant (shown in red) if the guides on each side of the boundary were significantly different and in consistent directions. For the EGFP-HygroR locus, the location of functional units is shown in color. (H) Percent of cells expressing HaloTag-ORF68 24 h post-reactivation for the indicated pool of coding region-targeting guides. Values are averages of four independent replicates, and error bars represent standard error. (I) RT-qPCR measurements of ORF68, ORF50, ORF75, and ORF57 mRNA at 24 h post-reactivation following Cas9-based targeting of the loci indicated on the x-axis. Mean data were presented relative to 18S RNA and vSAFE. Error bars show the standard error of the mean from four technical replicates. (J) Average fluorescence from HEK293T cells transfected with an ORF68 promoter-driven HaloTag and a plasmid expressing the indicated viral protein. Error bars are standard errors centered on the mean from seven independent replicates. Source data are available online for this figure.
Figure 4
Figure 4. Mapping regulatory network by effect on viral transcription.
(A) Co-correlation matrix of the RNA-seq data from Fig. 2a. For each indicated pair of sgRNA pools, a Pearson correlation was calculated between the viral RNA levels. (B) Model of regulatory events controlling transcription of the ORF68 locus. (C) Supernatant transfer assay measuring changes in KSHV virion production after knockdown of the indicated loci. Error bars represent standard error centered on the mean from six independent reactivations. (D) CUT&RUN signal from indicated mark in reactivated iSLK cells 24 h post-reactivation. Asterisks indicate peaks above the maximum signal graphed. The signal is averaged from three independent replicates. Source data are available online for this figure.
Figure 5
Figure 5. Capture Hi-C of the KSHV genome.
(A) Schematic of capture Hi-C experiment. (B, C) Contact frequency between (B) TSS68 and (C) TSS75 and other locations in the viral genome at 1 kb resolution. (D) Relative contact frequency map corrected for circular/concatenated distance. Noted features are marked and labeled. Positive values represent more interaction than expected. The annotated viral genome is provided with regulatory elements identified and marked in blue. Source data are available online for this figure.
Figure 6
Figure 6. Changing physical relationship between regulatory regions.
(A) Schematic splitting of the regulatory network into initial, intermediate, and final stages. (BD) Relative contact frequency at 1 kb resolution for the viral region from 100–154 kb measured by capture Hi-C 24 h post-reactivation for representative (B) initial stages (purple), (C) intermediate stages (orange), (D) and final stages (yellow). Positive values indicate greater interaction than expected, and locations of regulatory elements are marked in blue. (EG) Relative contact frequency at 2 kb resolution across the genome measured by capture Hi-C 24 h post-reactivation for representative (E) initial stages, (F) intermediate stages, (G) and final stages. Dotted lines represent locations of insulator regions as defined by negative local-minimum insulator scores. The locations of the three observed insulators are marked in blue. (HJ) Insulator scores at the marked locations in (AC) at (D) 100–102 kb, (E) 130–132 kb, and (F) 136–138 kb. More negative values indicated a stronger insulator. Values are the average of two adjacent regions with error bars representing the standard deviation of these two values. Source data are available online for this figure.
Figure EV1
Figure EV1. Supplementary screen data.
(A) Enrichment of individual guides at the ORF68 locus. Each dot represents a single guide, with the target location displayed on the x-axis and the average enrichment from two replicates on the y-axis. (B) Reproducibility of guide enrichments from two replicates. (CH) Smoothed enrichment of guides at an indicated locus with annotated transcription start sites (Ye et al, 2019). For each guide, the median enrichment of a 100 bp window centered at the target locus was calculated along with an interquartile range (IQR) to represent the range of values. The median value is shown as a point, and IQR is shown as a shaded region. Regions significant (p < 10−11) in sliding window analysis are shown in blue. NA indicates unannotated TSSs.
Figure EV2
Figure EV2. Supplementary for RNA-seq.
(A) Schematic showing set-up of RNA-seq experiment on CRISPRi cells infected with a three-guide pool, reactivated, and polyA+ RNA-seq at 24 h post-reactivation. (B) Heatmap indicating viral gene expression relative to the matched vSAFE replicate of each individual replicate. Rows are presented in genome order. Replicates from three independent reactivations. (C) RT-qPCR was used to measure how CRISPRi-based repression of the individual elements indicated on the x-axis influenced the levels of ORFs 50, 75, 68, and 57 mRNA. Error bars represent standard error centered on the mean of four independent reactivations. (D) Effect on latency measured by loss of virally encoded EGFP expression over 10 days. Mean values are presented relative to parental cells, and error bars are standard errors from three parallel replicates. P values are calculated by t-test; exact p values for marked values are 0.0031 for sgPolyA75 and 0.0013 for sgTSS75. (E) RT-qPCR of viral genes ORF75 and ORF68 in CRISPRi+ BCBL1 cells targeted with indicated guide RNAs at 24 h post-reactivation. Mean values are presented relative to 18S and vSAFE cells. Error bars are standard errors from five independent reactivations.
Figure EV3
Figure EV3. Supplementary mapping data.
(A) Individual replicate correlation among RNA-seq. (B) Supernatant transfer assay measuring changes in KSHV virion production after knockdown of the indicated loci in CRISPRi+ BCBL1 cells. qPCR measurements of viral DNA content relative to host DNA content. Error bars represent standard error centered on the mean from four independent reactivations. (C) CUT&RUN signal from indicated mark in reactivated iSLK cells 24 h post-reactivation. Asterisks indicate peaks above the maximum signal graphed. The signal is averaged from three independent replicates.
Figure EV4
Figure EV4. Hi-C data supplement.
(A) Contact frequency of reactivated sample at 5 kb, 2 kb, 1 kb, and 500 bp resolution. (BD) Contact frequency between (B) TSSalt, (C) TSS72, and (D) polyA75 and other locations in the viral genome at 1 kb resolution. (E, F) The observed relationship between observed contact frequency and distance between regions when calculated using (E) a linear distance metric or (F) a circular/concatenated distance metric.
Figure EV5
Figure EV5. Structural changes supplement.
(AC) Insulator scores for marked conditions measuring the relative frequency of reads crossing a given location. A more negative value indicates a strong insulator. Local minima were used to define the regions marked in Fig. 6E–G. (DF) Relative contact frequency at 2 kb resolution for (D) sgPolyA75 and sgTSS75, (E) sgTSSalt and sgTSS68, and (F) sgTSS72 and vSAFE samples. Positive values indicate greater interaction than expected. (GI) Change in contact frequency from reactivated cells between (G) TSS72 and TSS75, (H) polyA75 and TSS75, and (I) TSS68 and TSSalt at 2 kb resolution. (J) The final model for a regulatory circuit is based on all available data.

Update of

Similar articles

References

    1. Andersson R, Gebhard C, Miguel-Escalada I, Hoof I, Bornholdt J, Boyd M, Chen Y, Zhao X, Schmidl C, Suzuki T et al (2014) An atlas of active enhancers across human cell types and tissues. Nature 507:455–461 - PMC - PubMed
    1. Arias C, Weisburd B, Stern-Ginossar N, Mercier A, Madrid AS, Bellare P, Holdorf M, Weissman JS, Ganem D (2014) KSHV 2.0: a comprehensive annotation of the Kaposi’s sarcoma-associated herpesvirus genome using next-generation sequencing reveals novel genomic and functional features. PLoS Pathog 10:e1003847 - PMC - PubMed
    1. Banerji J, Rusconi S, Schaffner W (1981) Expression of a β-globin gene is enhanced by remote SV40 DNA sequences. Cell 27:299–308 - PubMed
    1. Brackett K, Mungale A, Lopez-Isidro M, Proctor DA, Najarro G, Arias C (2021) CRISPR interference efficiently silences latent and lytic viral genes in Kaposi’s sarcoma-associated herpesvirus-infected cells. Viruses 13:783 - PMC - PubMed
    1. Brulois KF, Chang H, Lee AS-Y, Ensser A, Wong L-Y, Toth Z, Lee SH, Lee H-R, Myoung J, Ganem D et al (2012) Construction and manipulation of a new Kaposi’s sarcoma-associated herpesvirus bacterial artificial chromosome clone. J Virol 86:9708–9720 - PMC - PubMed