

Construction of molecular subtype and prognostic model for gastric cancer based on nucleus-encoded mitochondrial genes
- PMID: 39557952
- PMCID: PMC11574080
- DOI: 10.1038/s41598-024-78729-0
Construction of molecular subtype and prognostic model for gastric cancer based on nucleus-encoded mitochondrial genes
Abstract
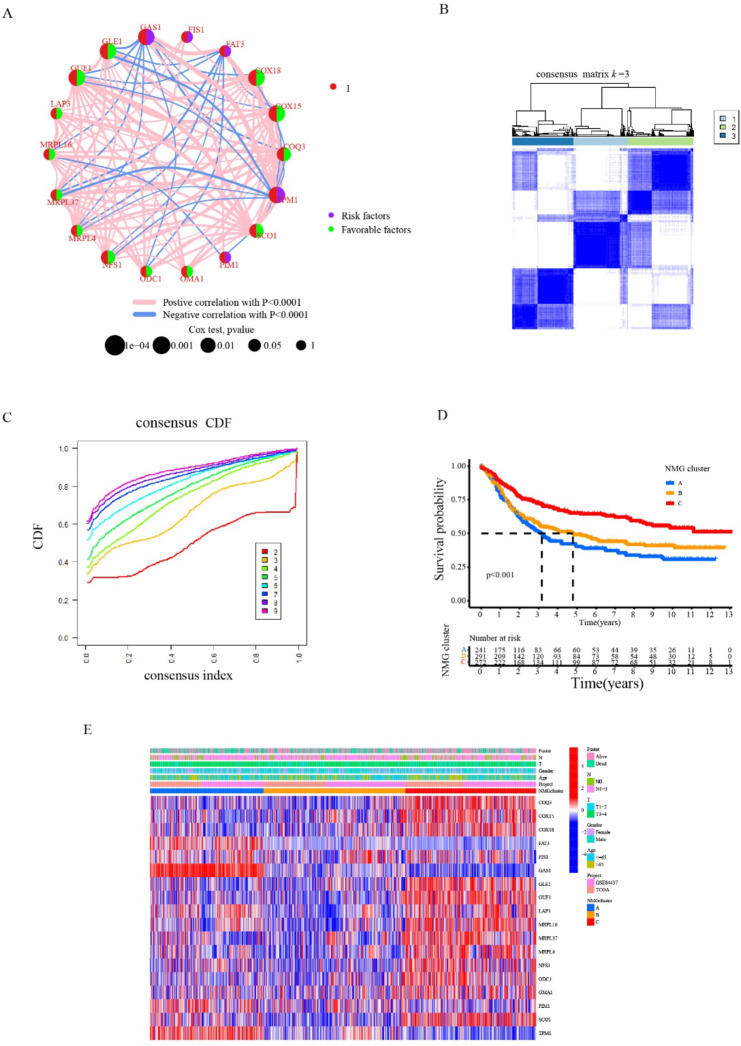
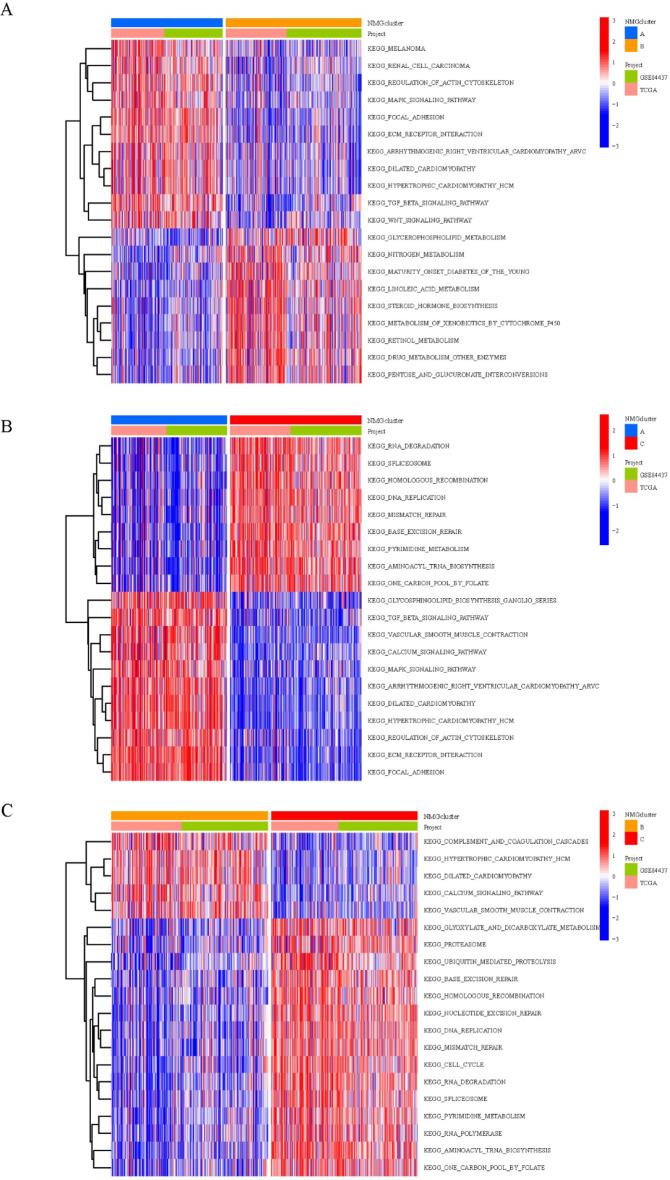
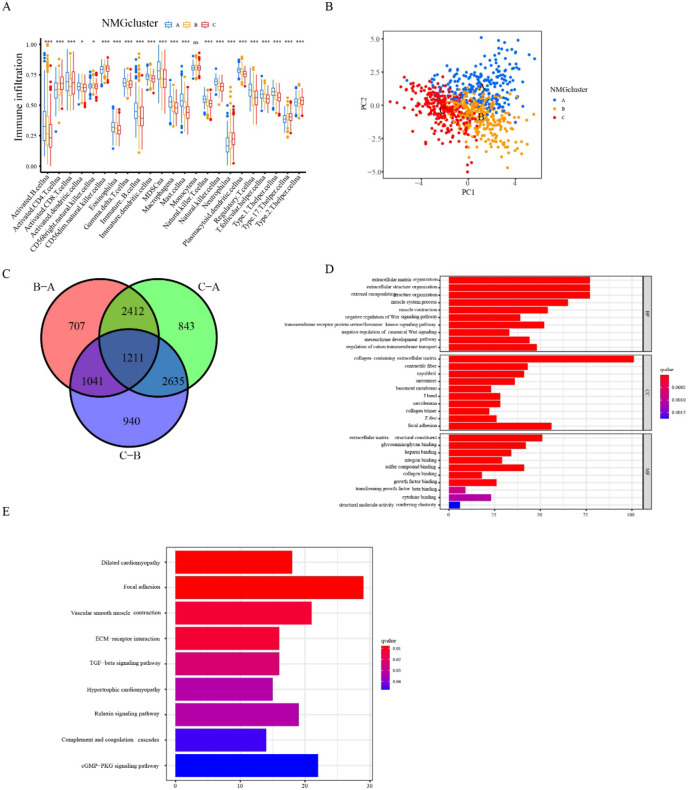
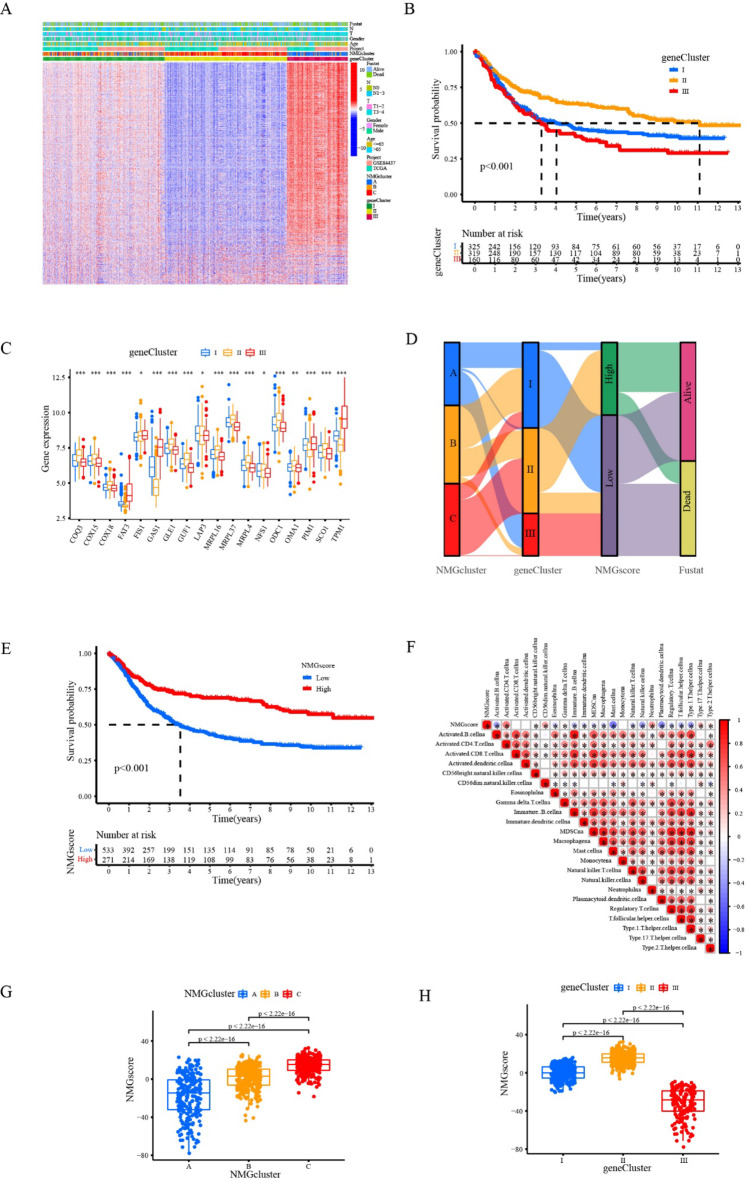
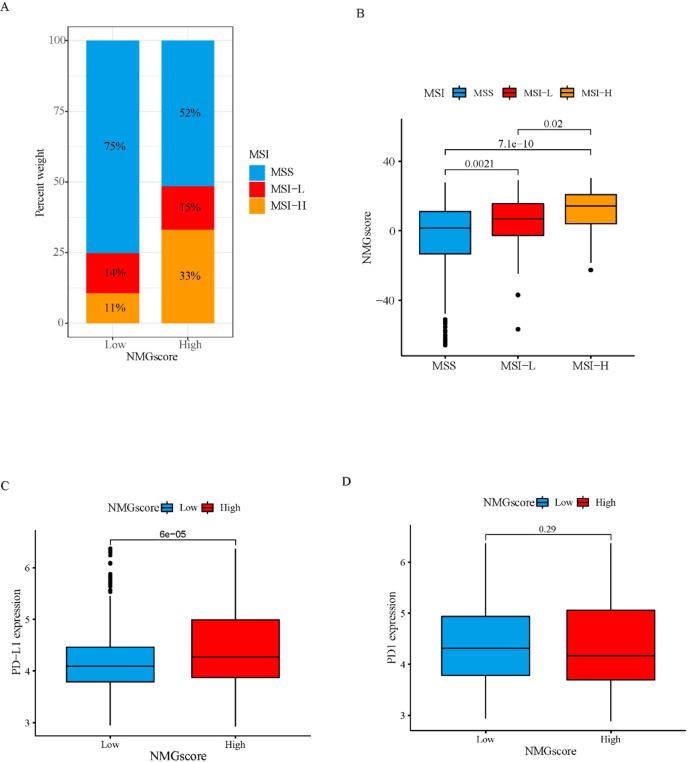
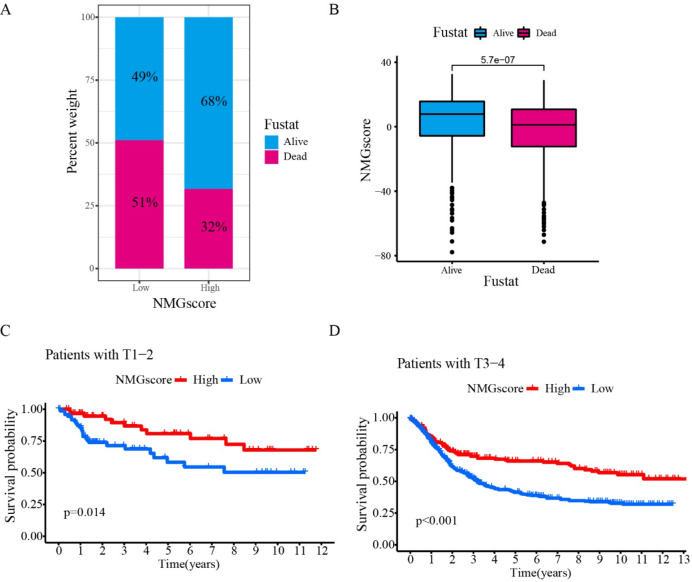
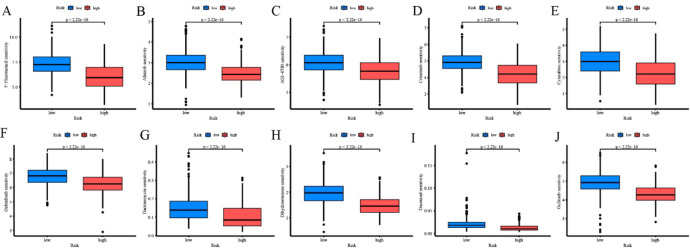
Gastric cancer (GC) is a common digestive system cancer, characterized by a significant mortality rate. Mitochondria is an indispensable organelle in eukaryotic cells. It was previously revealed that a series of nucleus-encoded mitochondrial genes (NMG) mutations and dysfunctions potentially contribute to the initiation and progression of GC. However, the correlation between NMG mutations and survival outcomes for GC patients is still unclear. In this study, NMG expression profile and clinical information in GC samples were collected from The Cancer Genome Atlas (TCGA) and Gene Expression Omnibus (GEO) databases. Through consistent clustering and functional enrichment analysis, we have identified three NMG clusters and three gene clusters that are associated with patterns of immune cell infiltration. Prognostic genes were identified through Univariate Cox regression analysis. The principal component analysis was conducted to set up a scoring system. Subsequently, the Single‑cell RNA sequencing (scRNA-seq) data of GC patients and cancer cell drug sensitivity data were retrieved from the GEO database. Patients with high NMG scores exhibited increased microsatellite instability status and a heightened tumor mutation rate compared to those with low NMG scores. Survival analysis revealed that GC samples with high NMG scores could achieve a better prognosis. Additionally, These patients were observed to be more responsive to immunotherapy. Moreover, we delved into prognostic genes at the level of single cells, revealing that MRPL4 and MRPL37 exhibit high expression in epithelial cells, while TPM1 demonstrates high expression in tissue stem cells. Utilizing cancer cell drug sensitivity data from the Drug Sensitivity in Cancer (GDSC) database, we noted a heightened sensitivity to chemotherapy in the high NMG group. Furthermore, we discovered a significant enrichment of cuproptosis-related genes in clusters with high NMG scores. Consequently, employing the scoring system could facilitate the prediction of GC patients' sensitivity to cuproptosis-induced therapy. Our study confirmed the potency of this scoring system as a therapeutic response biomarker for gastric cancer, potentially informing clinical treatment strategies.
Keywords: Gastric cancer; Immunotherapy; Nucleus-encoded mitochondrial genes; Tumor microenvironment; Tumor mutational burden.
© 2024. The Author(s).
Conflict of interest statement
Figures


Similar articles
-
Identification of cuproptosis-related subtypes, construction of a prognosis model, and tumor microenvironment landscape in gastric cancer.Front Immunol. 2022 Nov 21;13:1056932. doi: 10.3389/fimmu.2022.1056932. eCollection 2022. Front Immunol. 2022. PMID: 36479114 Free PMC article.
-
Development and validation of a hypoxia- and mitochondrial dysfunction- related prognostic model based on integrated single-cell and bulk RNA sequencing analyses in gastric cancer.Front Immunol. 2024 Aug 6;15:1419133. doi: 10.3389/fimmu.2024.1419133. eCollection 2024. Front Immunol. 2024. PMID: 39165353 Free PMC article.
-
Characterization of the Prognosis and Tumor Microenvironment of Cellular Senescence-related Genes through scRNA-seq and Bulk RNA-seq Analysis in GC.Recent Pat Anticancer Drug Discov. 2024;19(4):530-542. doi: 10.2174/0115748928255417230924191157. Recent Pat Anticancer Drug Discov. 2024. PMID: 37807645
-
Fatty Acid Metabolism Signature Contributes to the Molecular Diagnosis of a Malignant Gastric Cancer Subtype with Poor Prognosis and Lower Mutation Burden.Recent Pat Anticancer Drug Discov. 2024;19(5):666-680. doi: 10.2174/1574892819666230907145036. Recent Pat Anticancer Drug Discov. 2024. PMID: 37691229
-
A novel necroptosis-related gene index for predicting prognosis and a cold tumor immune microenvironment in stomach adenocarcinoma.Front Immunol. 2022 Oct 27;13:968165. doi: 10.3389/fimmu.2022.968165. eCollection 2022. Front Immunol. 2022. PMID: 36389725 Free PMC article. Review.
References
-
- Le Bras, M. et al. Reactive oxygen species and the mitochondrial signaling pathway of cell death. Histol. Histopathol. 20(1), 205–219 (2005). - PubMed
-
- Balaban, R. S., Nemoto, S. & Finkel, T. Mitochondria, oxidants, and aging. Cell. 120(4), 483–495 (2005). - PubMed
-
- Gorman, G. S. et al. Mitochondrial diseases. Nat. Rev. Dis. Primers. 2, 16080 (2016). - PubMed
MeSH terms
Substances
Grants and funding
LinkOut - more resources
Full Text Sources
Medical
Miscellaneous
