Evaluating pathological levels of intracellular cholesterol through Raman and surface-enhanced Raman spectroscopies
- PMID: 39557950
- PMCID: PMC11574121
- DOI: 10.1038/s41598-024-76621-5
Evaluating pathological levels of intracellular cholesterol through Raman and surface-enhanced Raman spectroscopies
Abstract
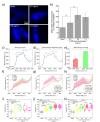
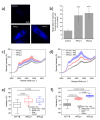
Versatile methods for the quantification of intracellular cholesterol are essential for understanding cellular physiology and for diagnosing disorders linked to cholesterol metabolism. Here we used Raman spectroscopy (RS) and surface-enhanced Raman spectroscopy (SERS) to measure changes in cholesterol after incubating human fibroblasts with increasing concentrations of cholesterol-methyl-β-cyclodextrin. RS and SERS were sensitive and accurate enough to detect high levels of cholesterol in fibroblasts from patients affected by type C Niemann-Pick disease (NPC), a lysosomal storage disorder characterized by the primary accumulation of cholesterol. Moreover, SERS was able to distinguish between fibroblasts from different NPC patients, demonstrating higher accuracy than RS and standard fluorescent labeling of cholesterol with filipin III. We show that the type of gold nanoparticles used as signal enhancer surfaces in our SERS measurements are internalized by the cells and are eventually found in lysosomes, the main site of accumulation of cholesterol in NPC fibroblasts. The higher sensitivity of SERS can thus be attributed to the specific trafficking of our gold nanoparticles into these organelles. Our results indicate that RS and SERS can be used as sensitive and accurate methods for the evaluation of intracellular cholesterol content, allowing for the potential development of an optical detection tool for the ex-vivo screening and monitoring of those diseases characterized by abnormal modification in cholesterol levels.
© 2024. The Author(s).
Conflict of interest statement
Figures


Similar articles
-
β-Cyclodextrin-threaded biocleavable polyrotaxanes ameliorate impaired autophagic flux in Niemann-Pick type C disease.J Biol Chem. 2015 Apr 10;290(15):9442-54. doi: 10.1074/jbc.M115.636803. Epub 2015 Feb 24. J Biol Chem. 2015. PMID: 25713067 Free PMC article.
-
Visualization of cholesterol deposits in lysosomes of Niemann-Pick type C fibroblasts using recombinant perfringolysin O.Orphanet J Rare Dis. 2014 Apr 28;9:64. doi: 10.1186/1750-1172-9-64. Orphanet J Rare Dis. 2014. PMID: 24775609 Free PMC article.
-
Analytical Characterization of Methyl-β-Cyclodextrin for Pharmacological Activity to Reduce Lysosomal Cholesterol Accumulation in Niemann-Pick Disease Type C1 Cells.Assay Drug Dev Technol. 2017 May/Jun;15(4):154-166. doi: 10.1089/adt.2017.774. Assay Drug Dev Technol. 2017. PMID: 28631941 Free PMC article.
-
Cyclodextrins applied to the treatment of lysosomal storage disorders.Adv Drug Deliv Rev. 2022 Dec;191:114617. doi: 10.1016/j.addr.2022.114617. Epub 2022 Nov 8. Adv Drug Deliv Rev. 2022. PMID: 36356931 Review.
-
Finding pathogenic commonalities between Niemann-Pick type C and other lysosomal storage disorders: Opportunities for shared therapeutic interventions.Biochim Biophys Acta Mol Basis Dis. 2020 Oct 1;1866(10):165875. doi: 10.1016/j.bbadis.2020.165875. Epub 2020 Jun 6. Biochim Biophys Acta Mol Basis Dis. 2020. PMID: 32522631 Review.
References
-
- Schade, D. S., Shey, L. & Eaton, R. P. Cholesterol review: a metabolically important molecule. Endocr. Pract. 26, 1514–1523. 10.4158/EP-2020-0347 (2020). - PubMed
-
- Al-kuraishy, H. M. et al. The effects of cholesterol and statins on Parkinson’s neuropathology: a narrative review. Inflammopharmacol10.1007/s10787-023-01400-z (2024). - PubMed
-
- Lu, J. et al. Targeting cholesterol metabolism in cancer: from molecular mechanisms to therapeutic implications. Biochem. Pharmacol. 218, 115907. 10.1016/j.bcp.2023.115907 (2023). - PubMed
MeSH terms
Substances
Grants and funding
- Integrated infrastructure initiative in photonic and quantum sciences - I-PHOQS/EU next generation PNRR action
- Integrated infrastructure initiative in photonic and quantum sciences - I-PHOQS/EU next generation PNRR action
- Lysolate/Regione Toscana
- Lysolate/Regione Toscana
- 20228S5LWY/MUR PRINN 2022 LSD
LinkOut - more resources
Full Text Sources
Medical
Miscellaneous

