. 2024 Nov 18;15(1):9970.
doi: 10.1038/s41467-024-53225-1.

CRISPR screens and lectin microarrays identify high mannose N-glycan regulators

Affiliations

CRISPR screens and lectin microarrays identify high mannose N-glycan regulators

C Kimberly Tsui et al. Nat Commun. .

Abstract

Glycans play critical roles in cellular signaling and function. Unlike proteins, glycan structures are not templated from genetic sequences but synthesized by the concerted activity of many genes, making them historically challenging to study. Here, we present a strategy that utilizes CRISPR screens and lectin microarrays to uncover and characterize regulators of glycosylation. We applied this approach to study the regulation of high mannose glycans - the starting structure of all asparagine(N)-linked-glycans. We used CRISPR screens to uncover the expanded network of genes controlling high mannose levels, followed by lectin microarrays to fully measure the complex effect of select regulators on glycosylation globally. Through this, we elucidated how two high mannose regulators - TM9SF3 and the CCC complex - control complex N-glycosylation via regulating Golgi morphology and function. Notably, this allows us to interrogate Golgi function in-depth and reveals that similar disruption to Golgi morphology can lead to drastically different glycosylation outcomes. Collectively, this work demonstrates a generalizable approach for systematically dissecting the regulatory network underlying glycosylation.


Conflict of interest statement

Competing interests The authors declare no competing interests.

Figures

Fig. 1
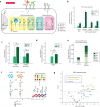
Fig. 1. XBP1s-induction upregulates high mannose N-glycans on and within cells.
a Schematic for dox-inducible XBP1s upregulating high mannose N-glycans. b RT-qPCR for targets of general UPRER and XBP1s. Gene expression is normalized to housekeeping genes GAPDH and HRPT1. c Fluorescent HHL and GRFT binding on A549 cells with or without dox-induction of XBP1s. Cells were treated with 2 µg/mL dox for 48 hours to overexpress XBP1s. d Fluorescent MBL2 binding on A549 cells with or without dox-induction of XBP1s. Cells were treated with 2 µg/mL dox for 48 hours to overexpress XBP1s. e UPLC quantification of high mannose N-glycan structures of A549 cells with or without XBP1s-induction. Levels of each high mannose structure are normalized to the protein amount of each replicate. f Schematic for lectin microarray analysis of A549s under basal or XBP1s-induced conditions. g Volcano plot of lectin microarray data. Median normalized log2 ratios (sample /reference) of the A549 samples are presented. Lectins are color-coded by their glycan-binding specificities. All Data are presented as mean ± s.e.m. unless otherwise indicated, and are representative of at least two independent experiments performed in triplicate with consistent results. p values were calculated from two-tailed Student’s t test.
Fig. 2
Fig. 2. Genome-wide CRISPR screen uncovers the expanded network of genes regulating high mannose.
a Schematic for FACS-based CRISPR screen. Cas9-expressing A549s were lentivirally transduced with a genome-wide CRISPR-deletion sgRNA library. Resulting cells were dox-treated to induce XBP1s overexpression for 48 hours. Cells were then gently lifted with Accutase, fixed, and stained with FITC-labeled HHL. The top and bottom 25% of HHL stained cells were isolated by FACS. The resulting populations were subjected to deep sequencing and analysis. The screen was performed in duplicate. b Volcano plot of all genes indicating effect and confidence scores for the genome-wide screen performed in duplicate. Effect and P values were calculated by casTLE. c Schematic for initial steps of N-glycan mannose-trimming and remodeling. All three enzymes indicated are hits in genome-wide screen. d Disruption of tail-anchored protein insertion pathway by ASNA1 inhibitor Retro-2 in wild type A549s also upregulates cell surface high mannose glycan levels. A549s were treated with treated with 2 µg/mL dox, 100 µM of Retro-2, both, or left untreated for 48 hours. Resulting cells were lifted with Accutase and stained with FITC-labeled HHL, followed by flow cytometry analysis. Data are presented as mean ± s.e.m. of median of each replicate and are representative of two independent experiments performed in triplicate with consistent results. p values were calculated from two-tailed Student’s t test. e Schematic for competitive binding assays for measuring changes in high mannose levels. Cells expressing sgRNAs for CRISPRi-mediated knockdown (KD) and miRFP and cells expressing a control sgRNA and BFP were cocultured in 1:1 ratio. Cells were either treated with dox to induce XBP1s or left untreated for 48 hours. Resulting cells were lifted and stained with HHL-FITC, and log2 ratio of HHL intensity of KO: control was determined using flow cytometry. f Validation of hits in XBP1s-induced A549s using competitive HHL binding assays. Data are presented as mean ± s.e.m. and are representative of two independent experiments performed in triplicate with consistent results. p values were calculated from two-tailed Student’s t test.
Fig. 3
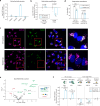
Fig. 3. Targeted CRISPRi screen uncovers additional regulators of high mannose glycans under basal and UPRER induced conditions.
a Schematic for MACS-based CRISPR screen. A549 cells stably expressing CRISPRi machinery and the targeted sgRNA sublibrary were either dox-treated to induce XBP1s or left untreated for 48 hours. Cells were lifted and incubated with HHL coupled to magnetic beads. The cells were then placed on a magnet in which high HHL-binding cells would be retained on the magnet, whereas the low HHL-binding cells were removed from the population. This separation was repeated twice more on each high and low HHL binding cells to improve the purity of the populations. Finally, each resulting population were subjected to deep sequencing and analysis to identify hits. The screen was performed in duplicate. b The maximum effect size (center value) estimated by CasTLE from both basal and XBP1s-induced conditions with five independent sgRNA per gene. The bars represent the 95% credible interval, with red representing XBP1s and blue representing basal conditions. Only genes considered to be a hit in at least one condition are shown. Genes are ordered in descending order of estimated maximum effect size of XBP1s-induced condition. The top 30 positive and negative hits are shown in the expanded panels. c Top 30 regulators for high mannose N-glycans with their reported subcellular localization. d Validation of hits in A549 under basal conditions using competitive HHL binding assays. Each gene is knocked down by co-expression of two independent sgRNAs. Data are presented as mean ± s.e.m. and are representative of two independent experiments performed in triplicate with consistent results. e Validation of hits in A549 under XBP1s-induced conditions using competitive HHL binding assays. Each gene is knocked down by co-expression of two independent sgRNAs. Data are presented as mean ± s.e.m. and are representative of two independent experiments performed in triplicate with consistent results. p values were calculated from two-tailed Student’s t test.
Fig. 4
Fig. 4. TM9SF3 regulates the Golgi organization and is required for formation of complex N-glycans.
a Competitive HHL binding assay in A549s with each TM9SF family member knocked down. b Flow cytometry quantification of intracellular staining of GM130 and TGN46 in A549s. c Representative confocal microscopy images of TM9SF3 knockdown and wildtype control cells, co-stained with cis-/medial-Golgi marker GM130 and TGN marker TGN46. Magnified views of the red boxed areas are shown in the right-most column. Scale bars, 10 μm. Images are representative of two independent experiments performed in triplicate. d Percent area of each Golgi compartment co-localized with the other compartment. Colocalized area is divided by total area of the indicated Golgi marker (GM130 or TGN46) to determine the percentage of each compartment that is colocalized with the other. Data are presented as mean ± s.e.m., from at least 12 images each from wildtype or TM9SF3 knockdown of two independent experiments, with > 20 cells per image. e Volcano plot for lectin microarray results of A549 cells with TM9SF3 knocked down compared to wildtype control. Lectins are color-coded by their glycan-binding specificities. f Competitive cell surface lectin binding assay for TM9SF3 knocked down A549s compared to wild type control under basal conditions. Lectin binding specificities and location of where the modification predominately occurs are indicated. Unless otherwise indicated, all Data are presented as mean ± s.e.m. and are representative of at least three independent experiments performed in triplicate with consistent results. p values were calculated from two-tailed Student’s t test.
Fig. 5
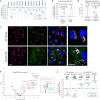
Fig. 5. CCDC22 regulates elongation and sialylation of glycans through modulating Golgi expansion.
a Competitive HHL binding assays on A549s for all knock down of all members of the CCC complex. Each gene is knocked down by co-expression of two independent sgRNAs. b Flow cytometry quantification of intracellular staining of GM130 and TGN46 in A549s in CCDC22 knockdown and wild type control cells. c Representative confocal microscopy images of CCDC22 knockdown and wildtype control cells, co-stained with cis-/medial-Golgi marker GM130 and TGN marker TGN46. Magnified views of the red boxed areas are shown in the right-most column. Scale bars, 10 μm. Images are representative of three independent experiments performed in triplicate. d Percent area of each Golgi compartment co-localized with the other compartment. Colocalized area is divided by total area of the indicated Golgi marker (GM130 or TGN46) to determine the percentage of each compartment that is colocalized with the other. Data are presented as mean ± s.e.m., from > at least 12 images each from wildtype or CCDC22 knockdown of two independent experiments, with > 20 cells per image. e Volcano plot for lectin microarray results of basal A549 cells with CCDC22 knocked down compared to wildtype control. Lectins are color-coded by their glycan-binding specificities. f Competitive cell surface lectin binding assay for CCDC22 knocked down A549s compared to wildtype control under basal conditions. Lectin binding specificities and the location of where the modification predominately occurs are indicated. Unless otherwise indicated, all Data are presented as mean ± s.e.m. and are representative of at least three independent experiments performed in triplicate with consistent results. p values were calculated from two-tailed Student’s t test.

Update of

Similar articles

References

    1. Reily, C., Stewart, T. J., Renfrow, M. B. & Novak, J. Glycosylation in health and disease. Nat. Rev. Nephrol.15, 346–366 (2019). - PMC - PubMed
    1. Varki, A. Biological roles of glycans. Glycobiology27, 3–49 (2017). - PMC - PubMed
    1. Ohtsubo, K. & Marth, J. D. Glycosylation in cellular mechanisms of health and disease. Cell126, 855–867 (2006). - PubMed
    1. Pinho, S. S. & Reis, C. A. Glycosylation in cancer: mechanisms and clinical implications. Nat. Rev. Cancer15, 540–555 (2015). - PubMed
    1. Qin, R. & Mahal, L. K. The host glycomic response to pathogens. Curr. Opin. Struct. Biol.68, 149–156 (2021). - PubMed

LinkOut - more resources