. 2024 Nov 16;14(1):28296.
doi: 10.1038/s41598-024-78873-7.

Starvation-induced metabolic rewiring affects mTORC1 composition in vivo

Affiliations

Starvation-induced metabolic rewiring affects mTORC1 composition in vivo

Kaade Edgar et al. Sci Rep. .

Abstract

Lysosomes play a crucial role in metabolic adaptation to starvation, but detailed in vivo studies are scarce. Therefore, we investigated the changes of the proteome of liver lysosomes in mice starved short-term for 6h or long-term for 24h. We verified starvation-induced catabolism by weight loss, ketone body production, drop in blood glucose and an increase of 3-methylhistidine. Deactivation of mTORC1 in vivo after short-term starvation causes a depletion of mTORC1 and the associated Ragulator complex in hepatic lysosomes, resulting in diminished phosphorylation of mTORC1 target proteins. While mTORC1 lysosomal protein levels and activity in liver were restored after long-term starvation, the lysosomal levels of Ragulator remained constantly reduced. To determine whether this mTORC1 activity pattern may be organ-specific, we further investigated the key metabolic organs muscle and brain. mTORC1 inactivation, but not re-activation, occurred in muscle after a starvation of 12 h or longer. In brain, mTORC1 activity remained unchanged during starvation. As mTORC1 deactivation is known to induce autophagy, we further investigated the more than 150 non-lysosomal proteins enriched in the lysosomal fraction upon starvation. Proteasomal, cytosolic and peroxisomal proteins dominated after short-term starvation, while after long-term starvation, mainly proteasomal and mitochondrial proteins accumulated, indicating ordered autophagic protein degradation.


Conflict of interest statement

Declarations Competing interests The authors declare no competing interests.

Figures

Fig. 1
Fig. 1
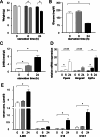
Starvation consequences in mice. 6-month-old male wild-type mice were starved for 6 or 24h. Control mice were fed ad libitum prior to sacrifice and analyses. (A) Average body weights are depicted as grams (n = 12–18). Shown are mean + SEM. White bars depict data for the 0h, grey bars for the 6h and black bars for the 24h starved mice. For every time point, striped bars represent the average weight at time of Triton WR1339 injection and solid bars average weight after starvation, at time of sacrifice. (B) Blood glucose concentrations (mg/dl) were determined for each group. N = 8–12. Shown are mean + SEM. (C) Average concentrations of ketone bodies (nmol/µl), determined by beta-hydroxybutyrate (β-HB) colorimetric assay. N = 8–12. Shown are mean + SD. (D) Real-time PCR. Fold changes of ketogenesis-related genes (Pparα, Hmgcs2 and Cpt1a) were analyzed by 2−ΔΔCt method. Samples from control (n = 3), 6h (n = 3) and 24h (n = 4) starved mice were statistically analyzed. Shown are mean + SEM. (E) determination of 3-methylhistidine (3-MH) and long-chain acylcarnitines in serum. Shown are mean + SEM. * = p < 0.05.
Fig. 2
Fig. 2
Differentially regulated proteins after short- and longterm starvation. Enriched lysosomal fractions from control, 6h (A) and 24h (B) (n = 3–4) starved mice were tryptically digested. TMT labeled peptides were mixed and fractionated prior to MS measurement. Raw data were searched by proteome discoverer 2.3. Normalized proteins were statistically analyzed and p-values were corrected by the Benjamini–Hochberg method with a threshold of 0.05. The -log10 p-values were plotted against log2 fold change of starved/control. Proteins with a log2 fold change < -0.75 or > 0.75 are considered differentially regulated. C-F: Overrepresentation analysis of KEGG pathways and GO term cellular component with calculated enrichment factors for proteins that were differentially regulated after 6h (C,E) or 24 h of starvation (D,F), only results with a corrected p-value < 0.05 are shown. In C, D, E, and F left diagrams refer to proteins diminished and right diagrams to proteins enriched in lysosomes, respectively.
Fig. 3
Fig. 3
Regulation of mTORC1 complex proteins. (A) Enriched tritosome fractions and whole liver lysates were extracted from mice starved for six hours or one day and control animals fed ad libitum before sacrifice. Proteins were separated by SDS-PAGE, blotted and probed with indicated antibodies.* = loading controls were Gapdh for whole liver lysate and tripeptidyl peptidase 1 (Tpp1) for tritosome fractions. (B-D) Densitometric quantified signals were normalized to the corresponding Gapdh/Tpp1 intensity. Shown are mean + SEM; n = 8. * = p < 0.05. Control samples were set to 1. Western blot images were cropped for better representation. Full-size images are available in the supplementary information.
Fig. 4
Fig. 4
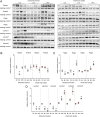
mTORC1 activity during starvation time course. (A) Schematic overview about experimental flow. Created in BioRender. Thelen, M. (2023) BioRender.com/c65y449. Adult C57BL/6 mice were starved for 6h, 9h, 12h, 16h or 20h and control mice were fed ad libitum before sacrifice. After liver (B), brain (C) and muscle (D) were removed and lysed, proteins were separated by SDS-PAGE, blotted and probed with indicated antibodies ( EF) Densitometric quantified signals were normalized to the corresponding Gapdh intensity. G: LC3-II signals were either normalized to Gapdh (left diagram) or LC3-I (right diagram). Respective controls were set to 1. Shown are mean + SEM; n = 3. * = p < 0.05. Western blot images were cropped for better representation. Full-size images are available in the supplementary information.
Fig. 5
Fig. 5
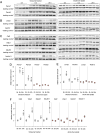
Accumulation of proteins from selected organelles indicate autophagy. Whole liver lysates and enriched trisosome fractions were extracted from mice starved for six hours or one day and control animals fed ad libitum before sacrifice. Proteins annotated to the proteasome (A), peroxisome (B) or mitochondrium (C) were separated by SDS-PAGE, blotted and probed with indicated antibodies.* = loading controls were Gapdh for whole liver lysate and tripeptidyl peptidase 1 (Tpp1) for tritosome fractions. (D-F) Densitometric quantified signals were normalized to the corresponding Gapdh/Tpp1 intensity. Shown are mean + SEM; n = 8. * = p < 0.05. Control samples were set to 1. Western blot images were cropped for better representation. Full-size images are available in the supplementary information.

Similar articles

References

    1. Xu, H. & Ren, D. Lysosomal physiology. Annu Rev Physiol77, 57–80. 10.1146/annurev-physiol-021014-071649 (2015). - PMC - PubMed
    1. De Duve, C., Pressman, B. C., Gianetto, R., Wattiaux, R. & Appelmans, F. Tissue fractionation studies. 6. Intracellular distribution patterns of enzymes in rat-liver tissue. Biochem J60, 604–617. 10.1042/bj0600604 (1955). - PMC - PubMed
    1. Ballabio, A. & Bonifacino, J. S. Lysosomes as dynamic regulators of cell and organismal homeostasis. Nat Rev Mol Cell Biol21, 101–118. 10.1038/s41580-019-0185-4 (2020). - PubMed
    1. Liu, G. Y. & Sabatini, D. M. mTOR at the nexus of nutrition, growth, ageing and disease. Nat Rev Mol Cell Biol21, 183–203. 10.1038/s41580-019-0199-y (2020). - PMC - PubMed
    1. Sengupta, S., Peterson, T. R. & Sabatini, D. M. Regulation of the mTOR complex 1 pathway by nutrients, growth factors, and stress. Mol Cell40, 310–322. 10.1016/j.molcel.2010.09.026 (2010). - PMC - PubMed

Substances

LinkOut - more resources