. 2024 Nov 12;8(2):e202402910.
doi: 10.26508/lsa.202402910. Print 2025 Feb.

Noncanonical altPIDD1 protein: unveiling the true major translational output of the PIDD1 gene

Affiliations

Noncanonical altPIDD1 protein: unveiling the true major translational output of the PIDD1 gene

Frédérick Comtois et al. Life Sci Alliance. .

Abstract

Proteogenomics has enabled the detection of novel proteins encoded in noncanonical or alternative open reading frames (altORFs) in genes already coding a reference protein. Reanalysis of proteomic and ribo-seq data revealed that the p53-induced death domain-containing protein (or PIDD1) gene encodes a second 171 amino acid protein, altPIDD1, in addition to the known 910-amino acid-long PIDD1 protein. The two ORFs overlap almost completely, and the translation initiation site of altPIDD1 is located upstream of PIDD1. AltPIDD1 has more translational and protein level evidence than PIDD1 across various cell lines and tissues. In HEK293 cells, the altPIDD1 to PIDD1 ratio is 40 to 1, as measured with isotope-labeled (heavy) peptides and targeted proteomics. AltPIDD1 localizes to cytoskeletal structures labeled with phalloidin and interacts with cytoskeletal proteins. Unlike most noncanonical proteins, altPIDD1 is not evolutionarily young but emerged in placental mammals. Overall, we identify PIDD1 as a dual-coding gene, with altPIDD1, not the annotated protein, being the primary product of translation.


Conflict of interest statement

The authors declare that they have no conflict of interest.

Figures
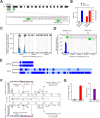
Figure 1.
Figure 1.. PIDD1 encodes two proteins and altPIDD1 is the main translational product, not PIDD1.
(A) Schematic representation of dual-coding human PIDD1 variant 1 mRNA (RefSeq NM_145886, Ensembl ENST00000347755) containing 16 exons. Large boxes represent coding regions; thin boxes represent the regions annotated as untranslated (UTRs) in the mRNA. PIDD1 ORF (black) is shared between exons 2–16 and altPIDD1 ORF (green) is shared between exons 2 and 3. Also shown are the nucleotides sequence around the translation initiation sites for PIDD1 and altPIDD1, and the first N-terminal residues. (B) MS and Ribo-Seq scores for altPIDD1 (OpenProt identifier IP_191523) and PIDD1 (UniProt identifier Q9HB75) extracted from OpenProt 1.6. (C) Sequence coverage for PIDD1 and altPIDD1 from the reanalysis of proteomics data with OpenProt 1.6 and PepQuery 2.0. Regions of the protein detected with unique peptides or undetected are shown with dark blue and light blue, respectively. (D, E) Public RiboSeq data of elongating (D) and initiating (E) ribosomes for PIDD1 were retrieved from GWIPS-viz. (F) Mirrored fragmentation spectra showing the acquired parallel reaction monitoring MS/MS spectrum from a unique endogenous (top) and synthetic (bottom) peptide from altPIDD1. b- and y-ions fragments are highlighted in blue and red, respectively. The Pearson correlation coefficient (PCC) and normalized spectral contrast angle (SA) are indicated. A peak-assignment/intensity difference plot is shown in the middle. (G) Absolute quantification in fg of protein per μg of whole cell lysate (left) and stoichiometry (right) of endogenous PIDD1 and altPIDD1 in HEK293 cells. Error bars represent SDs (biological triplicates).
Figure S1.
Figure S1.. AltPIDD1 sequence and prediction of intrinsic disorder and structure.
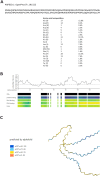
(A) AltPIDD1 accession ID, amino acids sequence and composition. (B) Prediction of intrinsic disorder and disorder function with flDPnn. (C) AltPIDD1 structure predicted with AlphaFold2 with the pLDDT confidence score.
Figure 2.
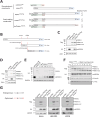
Figure 2.. Co-expression of PIDD1 and altPIDD1 from the same transcript.
(A) Schematic representation of different constructs used to detect the expression and co-expression of altPIDD1 and PIDD1 by introducing an HA or a Flag tag at the C-terminus of each protein. For constructs encoding only PIDD1 or altPIDD1, the corresponding coding sequences were cloned without the 5′UTR context. Dual-coding constructs contain the endogenous 5′UTR to preserve the altPIDD1 initiation codon in its original/genomic context. For dual-coding constructs, the reading frame is indicated on the right; PIDD1 reading frame is defined as +1. Parentheses surrounding the HA tag in the PIDD1 reading frame represent the fact that the HA epitope sequence is encoded in the altPIDD1 reading frame, and is, therefore, undetected if expressed from the ATG codon at bp 1 of the PIDD1 coding sequence. PIDD1Ø(HA)Flag represents a monocistronic construct with the ATG translation initiation site for altPIDD1 deleted; the dashed box for altPIDD1 indicates that altPIDD1 cannot be expressed from this construct. TetRPIDD1(HA)HA represents a dual-coding construct with both PIDD1 and altPIDD1 modified with an HA tag; expression of this construct in under the control of the tetracycline repressor. (B) PIDD1 auto-processing at residues S446 and S588 generate two C-terminal fragments. (C) Co-expression of both PIDD1 and altPIDD1 proteins from transfection of the PIDD1(HA)Flag construct in HeLa cells, by Western blot. Single-coding constructs altPIDD1HA and PIDD1Flag were used as positive controls and pcDNA was used as a transfection control. Actin was used as a loading control. Representative immunoblot from n = 3. (D) Expression of altPIDD1 and PIDD1 from transfection of the PIDD1(HA)Flag and PIDD1Ø(HA)Flag constructs in HeLa cells, by Western blot. The translation initiation codon of altPIDD1 is deleted in the PIDD1Ø(HA)Flag construct. Actin was used as a loading control. Representative immunoblot from n = 3. (E) Co-expression of altPIDD1 and PIDD1 from transfection of the TetRPIDD1(HA)HA construct in HeLa cells detected by immunoblotting. Expression was induced with doxycycline at the indicated concentration (ng/ml). Single-coding constructs altPIDD1HA and PIDD1HA are used as positive controls. GAPDH was used as a loading control. Representative Western blot from n = 3. (F) Western blot analysis of PIDD1 and its processed fragments, and altPIDD1 in cells transfected with PIDD1(HA)Flag and treated with cycloheximide. Vinculin was employed as a control for ensuring equal loading, although c-myc was used as a control for a protein that undergoes degradation during cycloheximide treatment. (G) The endogenous nucleotide sequence surrounding the ATG initiation codon of altPIDD1 is displayed on the left, along with the sequence optimized by mutagenesis to correspond to an optimal Kozak motif (red nucleotides). Nucleotides in bold correspond to positions that are highly important for strong translation initiation. Left, expression of altPIDD1 and PIDD1 from transfection of the PIDD1(HA)Flag and PIDD1(Kozak)(HA)Flag constructs in HeLa, HEK293, and U2OS cells by immunoblotting. GAPDH was used as a loading control. Representative immunoblots from n = 3.
Figure 3.
Figure 3.. AltPIDD1 localizes in actin-rich structures.
(A) Images by confocal microscopy of altPIDD1 (HA tag, green) and PIDD1 (Flag tag, red) in HeLa cells transfected with PIDD1(HA)Flag. Identically stained mock-transfected cells did not display any signal, highlighting the specificity of the observed signals. The white scale bar corresponds to 10 μm. Representative images of n = 3. Arrows indicate accumulation of altPIDD1 in cytoplasmic and membrane filamentous structures. (B) Images by confocal microscopy of altPIDD1 (HA tag, green) and PIDD1 (flag tag, red) in HeLa cells transfected with altPIDD1HA and PIDD1FLAG, respectively. The white scale bar corresponds to 10 μm. Representative images of n = 3. Arrows indicate accumulation of altPIDD1 in cytoplasmic and membrane structures. (C) Images by confocal microscopy of altPIDD1 (HA tag, green) in cells labeled with phalloidin to show actin structures in migrating HeLa cells. Migration was induced by scratching a confluent cell layer 24 h before fixation. Left panel, cell with high levels of stress fibers (arrows). Right panel, cell with a large lamellipodium (arrows). The white scale bar corresponds to 10 μm. Representative images of n = 3. (D) Images by confocal microscopy of altPIDD1 (HA tag, green) and actin (phalloidin, red) in HeLa cells co-transfected with either RhoA-Q63L or Rac1-Q61L cells, as indicated, to induce the formation of stress fibers and lamellipodia, respectively. The white scale bar corresponds to 10 μm. Representative images of n = 3.
Figure 4.
Figure 4.. AltPIDD1 interactome.
(A) Scatter plot of the proteins identified by AP-MS indicating their enrichment (fold change over control) and their SAINT probability score. Proteins above the 0.8 threshold (gray line) are indicated in black, others in gray. AltPIDD1 is indicated in red (bait), and preys known to regulate the cytoskeleton are indicated in blue. (B) A gene ontology (cellular component) enrichment analysis was carried out on the proteins in the interactome of altPIDD1 using the ShinyGO v0.741 tool. The degree of enrichment for each ontology is indicated by the length of the bars on the x-axis. The number of enriched genes is indicated by the size of the dot at the end of the bar. The −log2 false discovery rate is indicated by the color of each bar and dot. Only GO terms related to parameters were set at a 0.05 FDR cutoff with no redundancy in GO terms. (C) Validation of the interaction between AltPIDD1 and calpain-2 (CAPN2) in HEK293a cells expressing altPIDD1HA by co-immunoprecipitation of endogenous CAPN2 (left) or co-immunoprecipitation of altPIDD1HA (right). Controls (−): immunoprecipitation performed without anti-CAPN2 antibodies (left), and immunoprecipitation performed on mock-transfected cells (right). Representative of n = 3.
Figure 5.
Figure 5.. AltPIDD1 is cleaved during apoptosis.
(A) HeLa cells expressing altPIDD1HA were left untreated or treated with UV (254 nm wavelength, 130 J/m2), in the absence or in the presence of and Z-VAD-fmk (10 μM), as indicated. Proteins were analyzed by immunoblotting using the indicated antibodies. (B) HeLa cells expressing WT or D11A altPIDD1HA were left untreated or treated with UV. Proteins were analyzed by immunoblotting using the indicated antibodies. Representative of n = 3.
Figure 6.
Figure 6.. Emergence of altPIDD1 in placental mammals.
Gene tree ENSGT00940000161780 from Ensembl Compara, illustrating the evolutionary relationships among the one-to-one orthologs of human PIDD1 across various species. The leaves are represented by green squares, each corresponding to a taxonomic order, with one randomly selected species highlighted for each order. Details on specific species within the Primates and Rodentia orders are provided in subtrees with black leaves to highlight their importance in the study. Branch lengths represent the extent of evolutionary changes between the parent and the child nodes, and all internal nodes represent speciation events. Each species is associated with a percentage of identity (pident) derived from aligning altPIDD1 with its best matching protein in the ortholog of PIDD1 in this species using BLASTp. The pident values are visualized in a heatmap. A value of NA, depicted in black, indicates the absence of mapping, although a value of 100, depicted in red, corresponds to a perfect match between altPIDD1 and its best matching ORF. The pident heatmap reflects the conservation of altPIDD1 within the PIDD1 gene tree, with a particularly high conservation observed in mammals, especially placental mammals, but not in marsupials. Conservation is symbolized by a red sphere at the root of placental mammals. The highest pident is observed for monkeys and apes.

Similar articles

Cited by

  • High-quality peptide evidence for annotating non-canonical open reading frames as human proteins.
    Deutsch EW, Kok LW, Mudge JM, Ruiz-Orera J, Fierro-Monti I, Sun Z, Abelin JG, Alba MM, Aspden JL, Bazzini AA, Bruford EA, Brunet MA, Calviello L, Carr SA, Carvunis AR, Chothani S, Clauwaert J, Dean K, Faridi P, Frankish A, Hubner N, Ingolia NT, Magrane M, Martin MJ, Martinez TF, Menschaert G, Ohler U, Orchard S, Rackham O, Roucou X, Slavoff SA, Valen E, Wacholder A, Weissman JS, Wu W, Xie Z, Choudhary J, Bassani-Sternberg M, Vizcaíno JA, Ternette N, Moritz RL, Prensner JR, van Heesch S. Deutsch EW, et al. bioRxiv [Preprint]. 2024 Sep 9:2024.09.09.612016. doi: 10.1101/2024.09.09.612016. bioRxiv. 2024. PMID: 39314370 Free PMC article. Preprint.

References

    1. Boucher D, Blais V, Denault J-B (2012) Caspase-7 uses an exosite to promote poly(ADP ribose) polymerase 1 proteolysis. Proc Natl Acad Sci U S A 109: 5669–5674. 10.1073/pnas.1200934109 - DOI - PMC - PubMed
    1. Brown A, Rathore S, Kimanius D, Aibara S, Bai X-C, Rorbach J, Amunts A, Ramakrishnan V (2017) Structures of the human mitochondrial ribosome in native states of assembly. Nat Struct Mol Biol 24: 866–869. 10.1038/nsmb.3464 - DOI - PMC - PubMed
    1. Brunet MA, Jacques J, Nassari S, Tyzack GE, McGoldrick P, Zinman L, Jean S, Robertson J, Patani R, Roucou X (2021) The FUS gene is dual‐coding with both proteins contributing to FUS ‐mediated toxicity. EMBO Rep 22: e50640. 10.15252/embr.202050640 - DOI - PMC - PubMed
    1. Burigotto M, Mattivi A, Migliorati D, Magnani G, Valentini C, Roccuzzo M, Offterdinger M, Pizzato M, Schmidt A, Villunger A, et al. (2021) Centriolar distal appendages activate the centrosome-PIDDosome-p53 signalling axis via ANKRD26. EMBO J 40: e104844. 10.15252/embj.2020104844 - DOI - PMC - PubMed
    1. Chung W-Y, Wadhawan S, Szklarczyk R, Pond SK, Nekrutenko A (2007) A first look at ARFome: Dual-coding genes in mammalian genomes. PLoS Comput Biol 3: e91. 10.1371/journal.pcbi.0030091 - DOI - PMC - PubMed

LinkOut - more resources