. 2024 Nov 12;22(11):e3002875.
doi: 10.1371/journal.pbio.3002875. eCollection 2024 Nov.

Coral larvae increase nitrogen assimilation to stabilize algal symbiosis and combat bleaching under increased temperature

Affiliations

Coral larvae increase nitrogen assimilation to stabilize algal symbiosis and combat bleaching under increased temperature

Ariana S Huffmyer et al. PLoS Biol. .

Abstract

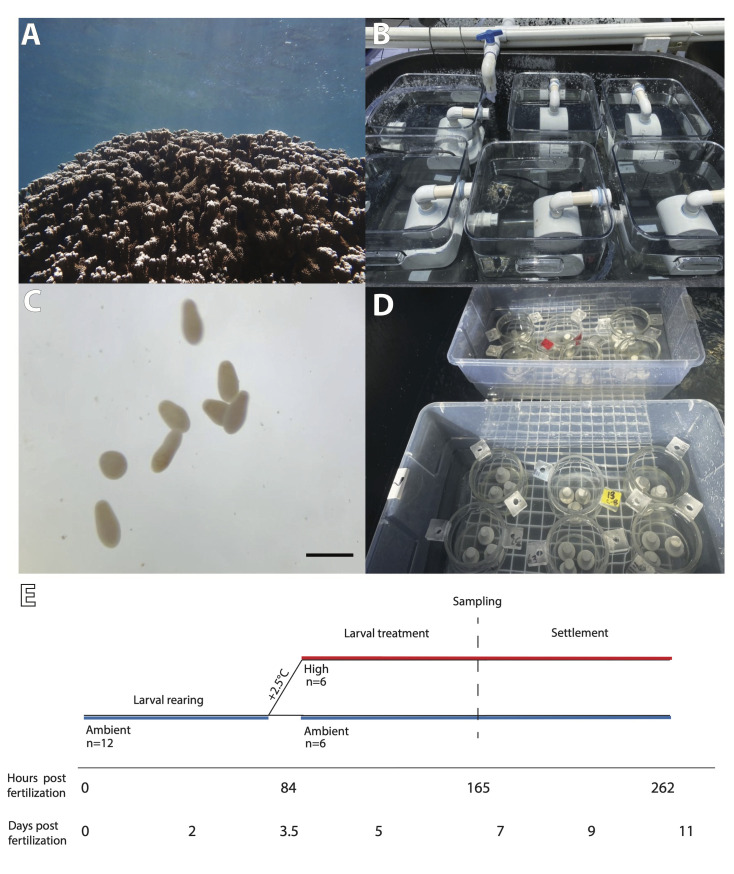
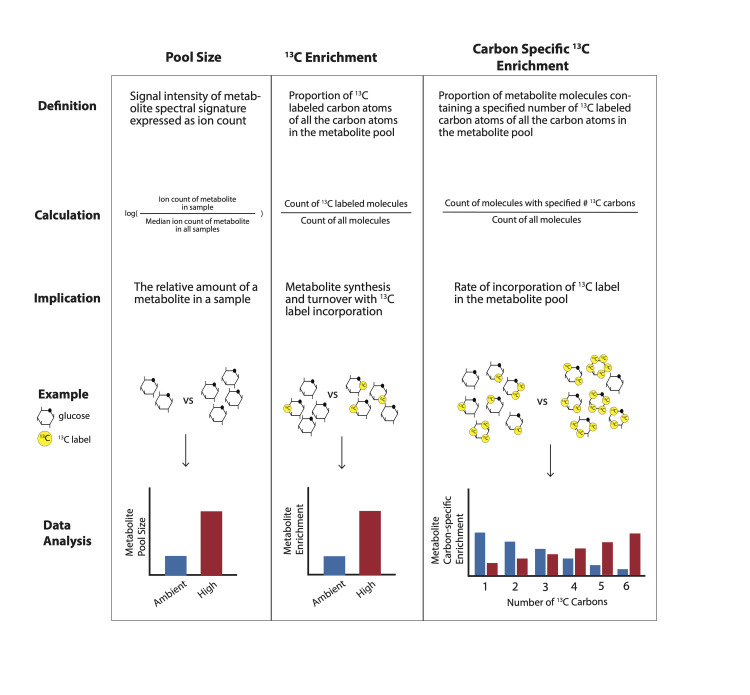
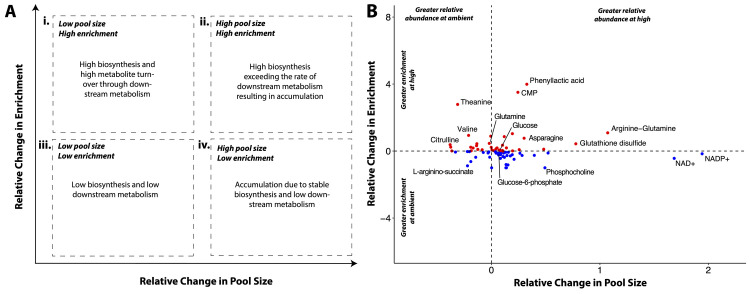
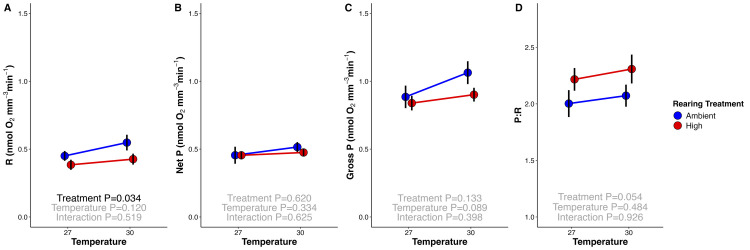
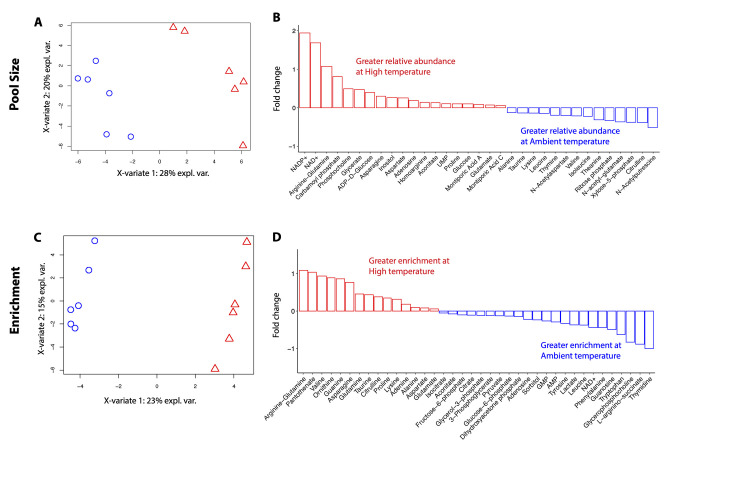
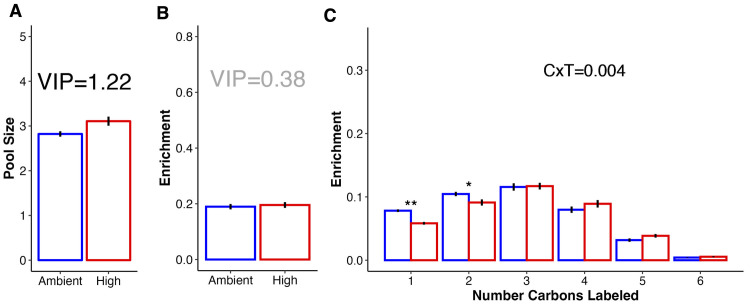
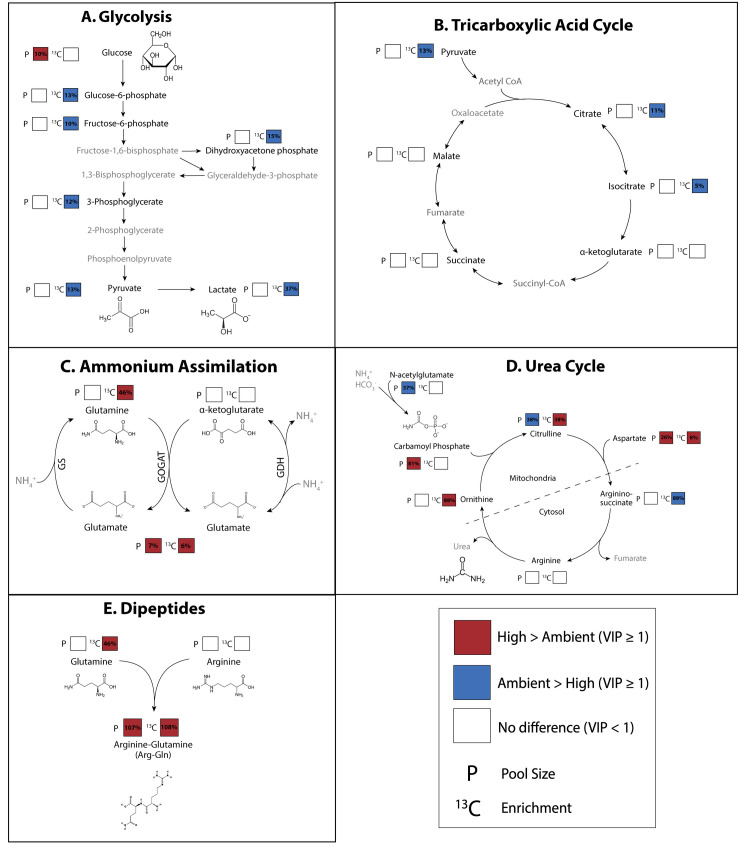
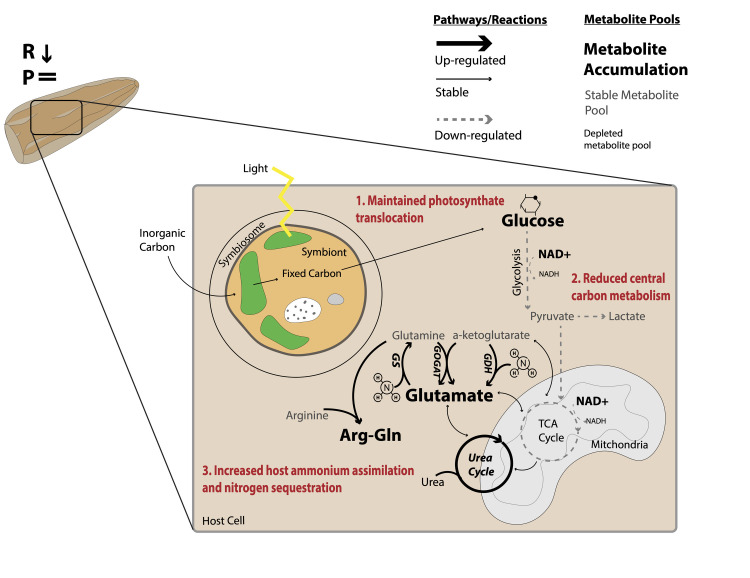
Rising sea surface temperatures are increasingly causing breakdown in the nutritional relationship between corals and algal endosymbionts (Symbiodiniaceae), threatening the basis of coral reef ecosystems and highlighting the critical role of coral reproduction in reef maintenance. The effects of thermal stress on metabolic exchange (i.e., transfer of fixed carbon photosynthates from symbiont to host) during sensitive early life stages, however, remains understudied. We exposed symbiotic Montipora capitata coral larvae in Hawai'i to high temperature (+2.5°C for 3 days), assessed rates of photosynthesis and respiration, and used stable isotope tracing (4 mM 13C sodium bicarbonate; 4.5 h) to quantify metabolite exchange. While larvae did not show any signs of bleaching and did not experience declines in survival and settlement, metabolic depression was significant under high temperature, indicated by a 19% reduction in respiration rates, but with no change in photosynthesis. Larvae exposed to high temperature showed evidence for maintained translocation of a major photosynthate, glucose, from the symbiont, but there was reduced metabolism of glucose through central carbon metabolism (i.e., glycolysis). The larval host invested in nitrogen cycling by increasing ammonium assimilation, urea metabolism, and sequestration of nitrogen into dipeptides, a mechanism that may support the maintenance of glucose translocation under thermal stress. Host nitrogen assimilation via dipeptide synthesis appears to be used for nitrogen limitation to the Symbiodiniaceae, and we hypothesize that nitrogen limitation contributes to retention of fixed carbon by favoring photosynthate translocation to the host. Collectively, our findings indicate that although these larvae are susceptible to metabolic stress under high temperature, diverting energy to nitrogen assimilation to maintain symbiont population density, photosynthesis, and carbon translocation may allow larvae to avoid bleaching and highlights potential life stage specific metabolic responses to stress.


Conflict of interest statement

The authors have declared that no competing interests exist.

Figures

Fig 1
Fig 1. (A) Adult Montipora capitata colony; (B) larval rearing tanks equipped with banjo filters submerged in water bath; (C) Montipora capitata planulae, scale bar indicates 1 mm; (D) larval settlement chambers with aragonite settlement plugs; (E) timeline of experiment.
Larvae were reared at ambient from 0–3.5 days post fertilization (dpf) (0–84 h post fertilization; hpf) with high (+2.5°C) and ambient treatments beginning at 3.5 dpf (84 hpf). Replication indicates the number of larval tanks at each treatment. Sampling of larvae occurred at approximately 7 dpf (165 hpf). Settlement was measured from approximately 7–11 dpf (165–262 hpf).
Fig 2
Fig 2. Overview of 3 data types analyzed in this study: pool size (left column), 13C enrichment (middle column), and carbon specific 13C enrichment (right column).
Pool size is the signal intensity of a metabolite spectral signature expressed as ion count and calculated as log-transformed median-normalized ion counts for analysis. Pool size indicates the relative amount of metabolite in a sample. In this study, we compared pool size for metabolites between temperature treatments. 13C enrichment is the proportion of 13C labeled carbon atoms of all the carbon atoms in the metabolite pool and 13C incorporation provides information on metabolite synthesis and turnover. In this study, we compared enrichment for metabolites between temperature treatments. Finally, carbon specific 13C enrichment is the proportion of metabolite molecules containing a specified number of 13C labeled carbon atoms of all carbon atoms in the metabolite pool and provides information on the rate of 13C incorporation into the metabolite pool. For example, in a glucose molecule with 6 carbon atoms, we analyzed whether the number of carbons with a 13C label in glucose metabolites shifts between treatments.
Fig 3
Fig 3. (A) Framework with general interpretations of four scenarios regarding metabolite pool size and 13C enrichment.
If a high pool size occurs with low enrichment, that metabolite is likely accumulating because of low biosynthesis and downstream metabolism (iv). In contrast, if a high pool size occurs with high enrichment (ii), that metabolite may be generated at a high rate exceeding that of downstream metabolism. Metabolites displaying both low pool size and enrichment may be undergoing both low biosynthesis and low downstream metabolism (iii). Finally, metabolites with low or stable pool size but high enrichment indicate a high rate of metabolite turnover due to biosynthesis that meets the rate of downstream metabolic activity (i). In this study, we examined relative differences in metabolite pool size and enrichment between temperature treatments. (B) Mean relative change in pool size (x-axis) and enrichment (y-axis) for detected metabolites. Points >0 in relative change in pool size (x) are metabolites that are in greater concentrations at high temperatures; Points >0 in relative change in enrichment (y) are metabolites more enriched at high temperature. Dotted lines separate the 4 quadrants of the framework in (A). Labels added to representative metabolites in each quadrant. The data underlying this figure can be found at 10.5281/zenodo.13835295.
Fig 4
Fig 4. Montipora capitata larval mean metabolic rates (nmol oxygen mm-3 min-1) following 3 days of exposure to ambient (blue) and high (red) thermal rearing treatments measured at control (27°C) and 30°C temperatures (x-axis).
(A) Larval respiration (light-enhanced dark respiration; R); (B) net photosynthesis (Net P); (C) gross photosynthesis (Gross P), calculated as the sum of oxygen consumed through respiration and oxygen produced through photosynthesis; and (D) gross photosynthesis:respiration (P:R) ratio. Data normalized to mean larval size from each respective rearing treatment. Error bars represent standard error of mean. Effects of measurement temperature and rearing treatment were tested using two-way ANOVA tests (black text P < 0.05; gray text P > 0.05). The data underlying this figure can be found at 10.5281/zenodo.13835295.
Fig 5
Fig 5. PLS-DA of metabolite pool size and enrichment.
(A) PLS-DA visualization of metabolite pool size in Montipora capitata larvae incubated with 13C labeled sodium bicarbonate in ambient (blue) and high (red) temperature. (B) Mean fold change in pool size of VIP metabolites driving differences between temperature treatments. Red and blue bars indicate metabolites with larger pools in larvae at high temperature or ambient temperature, respectively. Fold change calculated between mean metabolite value at ambient and mean metabolite value at high temperature. (C) PLS-DA visualization of metabolite enrichment in Montipora capitata larvae incubated with 13C labeled sodium bicarbonate in ambient (blue) and high (red) temperature. (D) Mean fold change in enrichment of VIP metabolites driving differences between temperature treatments. Red and blue bars indicate metabolites with greater enrichment in larvae at high temperature or ambient temperature, respectively. The data underlying this figure can be found at 10.5281/zenodo.13835295. PLS-DA, partial least squares discriminant analysis; VIP, variable importance in projection.
Fig 6
Fig 6. Glucose pool size and carbon labeling.
(A) Mean (± standard error) pool size (log-transformed median-normalized pool size) and (B) mean (± standard error) 13C enrichment (proportion) of glucose in larvae at high (red) and ambient (blue) temperature. (C) Mean (± standard error) 13C enrichment of glucose in Montipora capitata larvae shown as enrichment by the number of labeled carbons. Enrichment indicates the probability of the respective number of carbons containing a labeled carbon atom. Significance of the interaction of number of labeled carbons (“C”) and temperature treatment (“T”) shown in text. In all plots, red indicates high temperature and blue indicates ambient. In (A and B) VIP indicates a variable’s importance in projection with VIP ≥1 considered to be statistically important (black text) in contributing to discrimination between treatments with VIP <1 considered to not be statistically important (gray text). In (C), P-value indicates significance in two-way ANOVA testing with * indicating estimated marginal means post hoc P < 0.05 and ** indicating post hoc P < 0.01. No asterisks indicate P > 0.05. The data underlying this figure can be found at 10.5281/zenodo.13835295.
Fig 7
Fig 7. Metabolite pool size and 13C enrichment for metabolites involved in key carbon and nitrogen metabolic pathways: (A) glycolysis, (B) tricarboxylic acid cycle, (C) ammonium assimilation (glutamine synthetase (GS), glutamate synthase (GOGAT), and glutamate dehydrogenase (GDH)) pathways, (D) urea cycle, and (E) dipeptide synthesis.
In all plots, black metabolite labels indicate metabolites represented in the data set while gray metabolites were not represented in the data set. Pool size (P) and enrichment (13C) squares indicate significant differences between metabolite values in ambient and high temperature exposed larvae (VIP ≥1). White squares indicate no difference between treatments (VIP <1). Red squares indicate the respective value was elevated in high temperature exposed larvae relative to ambient while blue squares indicate value was elevated in ambient larvae relative to those at high temperature. Percentages within squares indicate the percent relative difference in respective metric between treatments.
Fig 8
Fig 8. Conceptual diagram of summarized metabolic response to high temperature in symbiotic larvae.
In this study, we found that exposure to high temperature led to decreased respiration rates (R reduced) in Montipora capitata larvae. However, there was no change in photosynthetic rates (P =) and no physiological indications of bleaching or reduced performance (i.e., no change in survival, settlement, symbiont cell densities, or chlorophyll). Although translocation of glucose was maintained (step 1; red text), central carbon metabolism was reduced (step 2; red text), causing glucose accumulation. In response to high temperature, the coral host increased ammonium assimilation and sequestration, which may limit available nitrogen to the symbiont (step 3; red text). Pathways with large, bold arrows were increased while pathways with dotted gray lines were decreased at high temperature relative to ambient. Pathways with solid, thin black lines were stable. Metabolites shown in large, bold letters were accumulated, while those shown in gray were stable and those in small, black text were depleted.

Comment in

Similar articles

Cited by

References

    1. LaJeunesse TC, Parkinson JE, Gabrielson PW, Jeong HJ, Reimer JD, Voolstra CR, et al.. Systematic Revision of Symbiodiniaceae Highlights the Antiquity and Diversity of Coral Endosymbionts. Curr Biol. 2018;28:2570–2580.e6. doi: 10.1016/j.cub.2018.07.008 - DOI - PubMed
    1. Muscatine L, Porter JW. Reef Corals: Mutualistic Symbioses Adapted to Nutrient-Poor Environments. Bioscience. 1977;27:454–460. doi: 10.2307/1297526 - DOI
    1. Falkowski PG, Dubinsky Z, Muscatine L, Porter JW. Light and the bioenergetics of a symbiotic coral. Bioscience. 2006;34:705–709. doi: 10.2307/1309663 - DOI
    1. Yellowlees D, Rees TAV, Leggat W. Metabolic interactions between algal symbionts and invertebrate hosts. Plant Cell Environ. 2008;31:679–694. doi: 10.1111/j.1365-3040.2008.01802.x - DOI - PubMed
    1. Rosset SL, Oakley CA, Ferrier-Pagès C, Suggett DJ, Weis VM, Davy SK. The Molecular Language of the Cnidarian–Dinoflagellate Symbiosis. Trends Microbiol. 2020;29:320–333. doi: 10.1016/j.tim.2020.08.005 - DOI - PubMed

Grants and funding

This research was supported by the National Science Foundation Ocean Sciences Postdoctoral Fellowship (2205966 to ASH), National Science Foundation Rules of Life-Epigenetics (EF-1921465 to HMP), and a gift of the Washington Research Foundation to the University of Washington eScience Institute (eScience Data Science Postdoctoral Fellowship award to ASH). The funders had no role in study design, data collection and analysis, decision to publish, or preparation of the manuscript.

LinkOut - more resources