. 2024 Nov 12:13:RP94908.
doi: 10.7554/eLife.94908.

A non-conducting role of the Cav1.4 Ca2+ channel drives homeostatic plasticity at the cone photoreceptor synapse

Affiliations

A non-conducting role of the Cav1.4 Ca2+ channel drives homeostatic plasticity at the cone photoreceptor synapse

J Wesley Maddox et al. Elife. .

Abstract

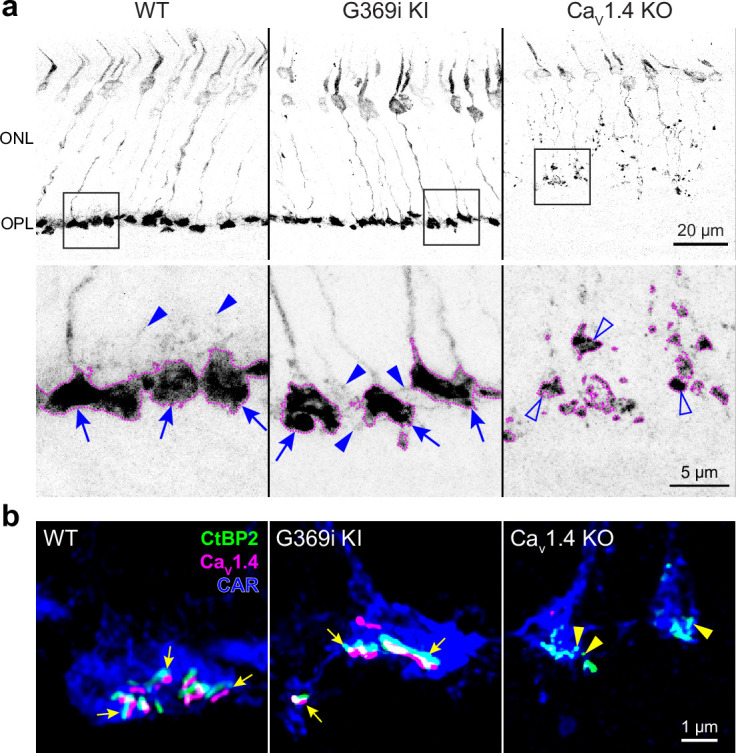
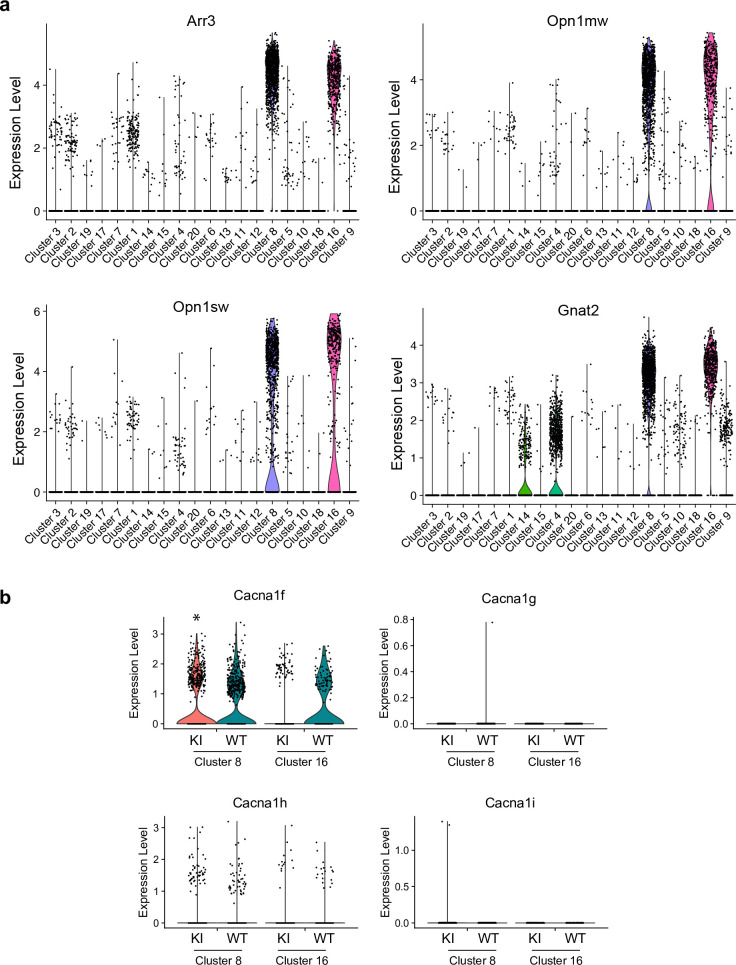
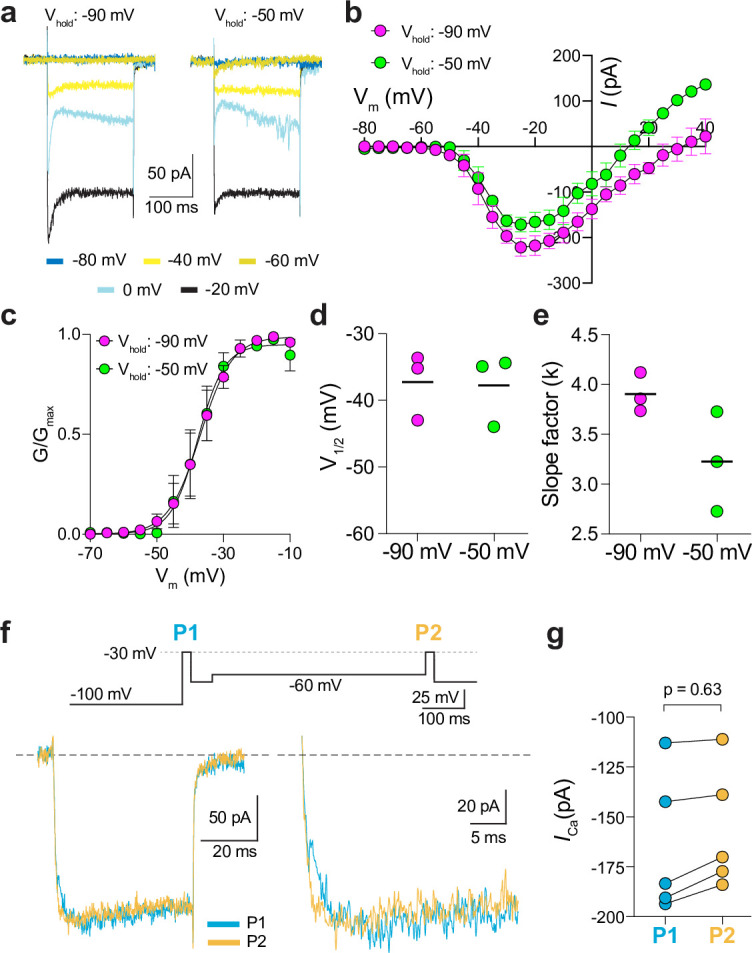
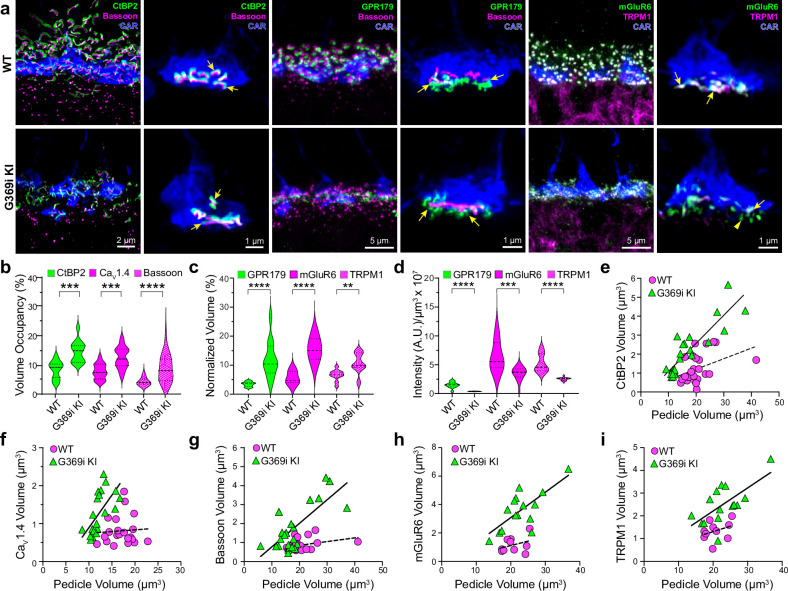
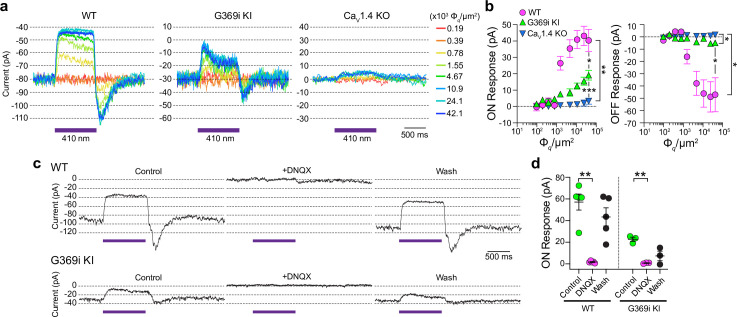
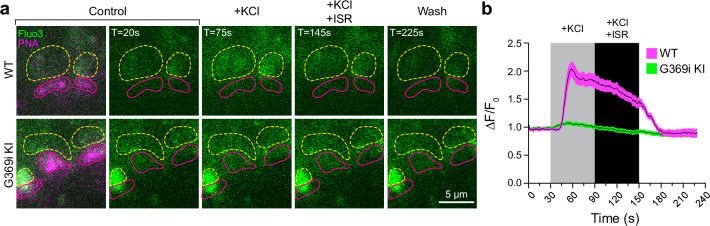
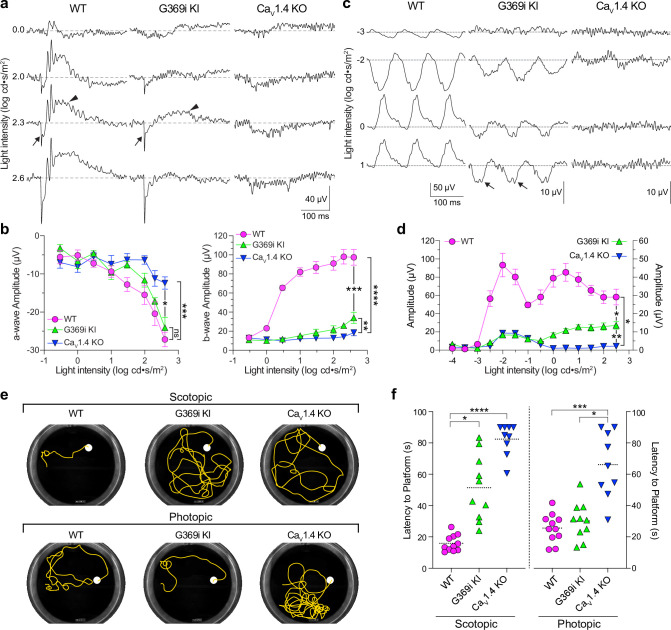
In congenital stationary night blindness, type 2 (CSNB2)-a disorder involving the Cav1.4 (L-type) Ca2+ channel-visual impairment is mild considering that Cav1.4 mediates synaptic release from rod and cone photoreceptors. Here, we addressed this conundrum using a Cav1.4 knockout (KO) mouse and a knock-in (G369i KI) mouse expressing a non-conducting Cav1.4. Surprisingly, Cav3 (T-type) Ca2+ currents were detected in cones of G369i KI mice and Cav1.4 KO mice but not in cones of wild-type mouse, ground squirrels, and macaque retina. Whereas Cav1.4 KO mice are blind, G369i KI mice exhibit normal photopic (i.e. cone-mediated) visual behavior. Cone synapses, which fail to form in Cav1.4 KO mice, are present, albeit enlarged, and with some errors in postsynaptic wiring in G369i KI mice. While Cav1.4 KO mice lack evidence of cone synaptic responses, electrophysiological recordings in G369i KI mice revealed nominal transmission from cones to horizontal cells and bipolar cells. In CSNB2, we propose that Cav3 channels maintain cone synaptic output provided that the nonconducting role of Cav1.4 in cone synaptogenesis remains intact. Our findings reveal an unexpected form of homeostatic plasticity that relies on a non-canonical role of an ion channel.

Keywords: calcium; ictidomys tridecemlineatus; mouse; neuroscience; photoreceptor; retina; rhesus macaque; synapse.


Conflict of interest statement

JM, GO, Jd, AH, CG, SW, KR, DF, NS, DM, BZ, SD, MH, AL No competing interests declared

Figures

Figure 1.
Figure 1.. Cone pedicles and the mutant Cav1.4 G369i channel are normally localized in the retina of G369i KI mice but not Cav1.4 KO mice.
Confocal images of the outer nuclear layer (ONL) and outer plexiform layer (OPL) of retina from wild-type (WT), G369i KI, and Cav1.4 KO mice that were labeled with antibodies against cone arrestin (CAR), CtBP2, and Cav1.4. (a) Inverted images of CAR labeling. Lower panels depict pedicles labeled by CAR antibodies (dotted outlines) and correspond to the boxed regions in the upper panels. Cone pedicles remain in the OPL of WT and G369i KI retina (arrows) but are misshapen and retracted into the ONL of the CaV1.4 KO retina (open arrowheads). Solid arrowheads indicate telodendria which extend only apically in the WT retina but extend basally and laterally in the G369i KI retina. (b) Deconvolved confocal images showing CaV1.4 labeling near cone ribbons in WT and G369i KI pedicles (arrows) and ribbon spheres without CaV1.4 labeling in the CaV1.4 KO pedicle (arrowheads). Rod-associated CtBP2 and Cav1.4 labeling was removed for clarity.
Figure 2.
Figure 2.. A low-voltage activated ICa is present in cones of G369i KI and CaV1.4 knockout (KO) but absent in cones of wild-type (WT) mice.
(a) Representative traces of ICa evoked by voltage ramps. (b) ICa traces from a normalized to their peak current amplitude to illustrate the hyperpolarizing shift in the I-V from cones of G369i KI and CaV1.4 KO mice. (c,d) I-V (c), and G-V (d) relationships for ICa evoked by 50 ms, +5 mV increments from a holding voltage of –90 mV. Vm, test voltage. WT, n=13; G369i KI, n=9; CaV1.4 KO, n=3. (e) Representative ICa traces and voltage protocol (bottom) for steady-state inactivation. ICa was evoked by a conditioning pre-pulse from –90 mV to various voltages for 500ms followed by a test pulse to –30 mV for 50 ms. (f), Steady-state inactivation data from cones as recorded in e. I/Imax represents the current amplitude of each –30 mV test pulse (I) normalized to current amplitude of the –30 mV test pulse preceded by a –90 mV conditioning pre-pulse (Imax) and was plotted against pre-pulse voltage. Shaded region indicates the window current for G369i KI cones. Line without symbols represents the G-V curve for G369i KI cones replotted from d. WT, n=8; G369i KI, n=8; Cav1.4 KO, n=3. In graphs c,d, and f, smooth lines represent Boltzmann fits, and symbols and bars represent mean ± SEM, respectively. (g) Representative ICa traces from WT and G369i KI cones and voltage protocol (top). ICa was evoked by a step from –100 mV to –30 mV before (P1) or after (P2) a 500ms step to –60 mV. (h,i) Graphs depicting peak amplitude of ICa during P1 and P2 steps (h) and the ratio of the amplitudes of ICa evoked by P2 and P1 pulses (P2/P1; i) from cones recorded as in g. WT, n=6; G369i KI, n=6, *p<0.05 by paired t-test.
Figure 2—figure supplement 1.
Figure 2—figure supplement 1.. Voltage ramps do not reveal ICa in rods of G369i KI mice.
(a,b) Representative traces of ICa evoked by voltage ramps at 0.15 mV/ms (left) or 0.5 mV/ms (right) in rods of wild-type (WT) or G369i KI mice. (c), Comparison of current amplitudes evoked by the different voltage ramps in rods of WT and G369i KI mice. Bars represent mean ± SEM. Each point represents a different cell. p-values were determined by unpaired t-test (t(12)=7.428 for 0.15 mV/ms, t(10) = 6.028 for 0.5 mV/ms).
Figure 3.
Figure 3.. Pharmacological characterization of ICa in cones of wild-type (WT) and G369i KI mice.
(a) Representative traces for ICa evoked by voltage ramps in cones of retinas from WT (top) and G369i KI (bottom) mice before (baseline) and after exposure to isradipine (ISR, 1 μM). Middle panel, WT ICa from voltage ramps in the top panel were normalized to their peak ICa to clarify the similar properties of ICa before and after ISR exposure. (b) Peak ICa before (-) and during (+) ISR exposure from cones as recorded in a. WT, n=4; G369i KI, n=5; *p<0.05 by paired t-test. (c) Representative traces for ICa evoked by voltage ramps in cones of retinas from WT or G369i KI mice before (baseline) and after exposure to ML 218 (5 μM). Middle panel, WT ICa from voltage ramps in the top panel were normalized to their peak ICa to clarify the similar properties of ICa before and after ML 218 exposure. (d) Peak ICa before (-) and during (+) ML 218 exposure. WT, n=5; G369i KI, n=5; *p<0.05 by paired t-test.
Figure 3—figure supplement 1.
Figure 3—figure supplement 1.. Effect of ML218 on Cav1.4 and Cav3.2 in HEK293T cells.
Cells were transfected with Cav1.4, β2x13, and α2δ−4 (a–d) or Cav3.2 (e–h). (a, e) Representative ICa traces and I-V plots for ICa evoked by 50 ms steps to +10 mV (a) or 200 ms steps to –35 mV (e) from a holding voltage of –90 mV. Currents were recorded in the presence of vehicle (DMSO) or ML 218 (5 μM for Cav1.4 and 1 μM for Cav3.2). (b, f) Left, I-V relationships for data obtained as in a,e but using steps to various voltages in a single representative cell. Right, Boltzmann fit of the responses, normalized to the maximum ICa amplitude. (c, d, g, h) Graphs depicting the effect of ML 218 on Vhalf (c, g) and ICa amplitude (d, h) **W=−93.00, Z=−3.1366, p=0.0017; ***W=105.0, Z=3.8419, p=0.0001; both by Wilcoxon matched pairs signed rank test. *t(2)=0.582, p=0.0366 by paired t-test.
Figure 3—figure supplement 2.
Figure 3—figure supplement 2.. Violin plots showing expression levels of transcripts at the single cell level in the retina of wild-type (WT) and G369i KI mice.
Each point represents the result from a single cell. (a) Expression levels of transcripts known to be expressed in cones. Cells were grouped according to their transcriptional profiles using unsupervised clustering. Clusters 8 and 16 were identified as cones based on their high expression of Arr3, Opn1mw, Opn1sw, and Gnat2. (b) Expression of transcripts that encode Cav1.4 (Cacna1f) and Cav3 subtypes (Cacna1g, Cacna1h, Cacna1i) in clusters 8 and 16 in the retina from WT and G369i KI mice. In cluster 8, there was a small but significant decrease in the level of Cacna1f in the G369i KI vs WT (*p=0.01) but not in cluster 16 (p=0.09). There was no significant difference in the level of Cacna1h between genotypes in clusters 8 or 16 (p=1).
Figure 4.
Figure 4.. Pharmacological characterization of ICa in ground squirrel cones.
(a) Representative traces corresponding to baseline-corrected ICa evoked by voltage ramps before (baseline) and during the application of ML 218. (b) G-V relationship of ICa in a. (c) Representative traces corresponding to ICa evoked by voltage ramps in control (baseline) and in ISR (2 μM) alone or in ISR + ML 218 (5 μM). (d) Peak ICa from cones including the record from c before (-) and during (+) ISR or ISR +ML 218 block. The changes during the addition of ML218 were small but significant (sup., n=7, ISR: p<0.0001, ML218: p=0.0047; mid., n=5, ISR: p<0.0001, ML218: p=0.0001; inf., n=5, ISR: p=0.0019, ML218: p=0.0460; two-tailed t-test) and were likely due to a further non-specific, time-dependent reduction in the Cav1 current. (e) ICa was evoked by steps from –85 mV to voltages between –65 and –5 mV in increments of +10 mV (protocol shown below the current traces in f). Representative traces are shown in control, ISR, or ISR +ML 218. Current traces during steps to –55 and –45 mV lacked both transient and ML 218-senstive components. Dashed lines indicate zero current. (f) Traces show the ICa sensitive to ISR (top) and ISR + ML218 (middle). The ICa recorded in ISR was subtracted from the baseline ICa (top). ICa recorded in ISR + ML218 was subtracted from ICa recorded in ISR (middle). (g) Top, I-V relationship of peak and steady-state ICa from f. Bottom, the G-V relationship of the ICa is blocked by ISR and ISR + ML218. Smooth lines represent Boltzmann fits. Symbols and bars represent mean ± SEM (n=4 cones). Due to a negative shift in the activation properties caused by ML 218 on a residual Cav1 current that is assumed to remain at the end of the experiment, the G-V curve of the ICa isolated through subtraction by applying ISR + ML 281 underwent a statistically insignificant shift to the right. Data presented in e-g are from the same cone. (h) Representative ICa traces from voltage ramps in an OFF cb3a bipolar cell before and during the application of ML 218. V1/2 was shifted to the right by 13.1 ± 4.3 mV (n=3 cb3a cells, mean ± SD) consistent with the block of a Cav3-like conductance. In cb3b OFF bipolar cells, ML 218 produced only a slight leftward shift in an ICa that had a more depolarized activation range, consistent with the exclusive expression a Cav1-type current (ΔV1/2 = -1.9 ± 0.4 mV, n=3 cells; data not shown). (i) Neurobiotin fill shows cb3a axon stratification and morphology in the retina labeled with antibodies against bassoon and choline acetyltransferase (CHAT) to label the OFF and ON sublamina of the IPL.
Figure 5.
Figure 5.. Characterization of ICa in patch clamp recordings of cone pedicles of macaque retina.
(a-c) Representative current traces (a) and corresponding I-V (b) and G-V (c) relationships for ICa evoked by 200 ms steps from a holding voltage of –90 mV or –50 mV. n=3 cones. (d, e) V1/2 (d) and slope factor (e) obtained from Boltzmann fit of data in c. p=0.50 in d; p=0.25 in e by Wilcoxon matched pairs signed rank test. (f) Voltage protocol (top) and representative ICa traces (bottom left) from cones as recorded in Figure 2g–i. Bottom right, expanded view of the boxed region in the left traces. (g) Peak ICa during P1 and P2 steps from cones recorded as in f. n=5 cones, p=0.62 by Wilcoxon matched pairs signed rank test.
Figure 6.
Figure 6.. Immunofluorescence characterization of cone synapses in wild-type (WT) and G369i KI mice.
(a) Confocal images of the outer plexiform layer (OPL) of WT and G369i KI mice labeled with antibodies against cone arrestin (CAR) and proteins that are presynaptic (CtBP2, bassoon) or postsynaptic (GPR179, TRPM1, mGluR6). Every other panel shows high-magnification, deconvolved images of single pedicles labeled with cone arrestin (rod spherule-associated signals were removed for clarity). Arrows indicate ribbon synapses, which appear enlarged in the G369i KI pedicles. (b) Violin plot representing the volume of presynaptic protein labeling normalized to the volume of their respective CAR-labeled pedicles (volume occupancy). (c) Violin plot representing the volume of postsynaptic protein labeling normalized to the volume of their respective CAR-labeled pedicles. (d) Violin plot representing fluorescence intensity of postsynaptic proteins. For b-d, **p<0.01, ***p<0.001, ****p<0.0001, unpaired t-tests.(e–i), Dependence of synapse size on pedicle size. Volumes corresponding to labeling of CtBP2 (e: p=0.051, r=0.4 for WT; p<0.0001, r=0.88 for G369i KI), CaV1.4 (f: p=0.8, r=0.06 for WT; p=0.002, r=0.88 for G369i KI), bassoon (g: p=0.1, r=0.34 for WT; p<0.0001, r=0.75 for G369i KI), mGluR6 (h: p=0.32, r=0.35 for WT; p=0.002, r=0.73 for G369i KI) and TRPM1 (i: p=0.32, r=0.35 for WT; p=0.007, r=0.66 for G369i KI) are plotted against pedicle volume. Dashed and solid lines represent fits by linear regression for WT and G369i KI, respectively.
Figure 7.
Figure 7.. Three-dimensional reconstruction of cone synapses by SBFSEM.
Reconstructions were made of wild-type (WT) and G369i KI pedicles (n=2 each). (a) 3D renderings showing ribbons (magenta) within cone pedicles (gray) from WT and G369i KI mice. (b) 3D renderings show ribbon sites in a WT cone pedicle contacting one horizontal (HC1; yellow) and three bipolar cells (BC1-3; purple). (b') Raw image from b shows a single plane example of BC1-2 and HC1 contacting the ribbon site. (c-d’), Single plane raw (c, d) images and 3D reconstructions (c’, d’) show ribbon sites within the G369i KI cone pedicle contacting in c,c’: horizontal cells (HC1-2) only (upper panels), CBCs (BC1-2) only (lower panels); and in d,d’: a glial cell (orange) and an unknown partner. The glial cell completely envelops the pedicle. Inset in d’ shows glial-contacting ribbon site (arrow). In other panels, arrows indicate points of contact between ribbons and other postsynaptic elements.
Figure 8.
Figure 8.. Patch clamp recordings of light responses of horizontal cells in ild-type (WT), G369i KI, and Cav1.4 knockout (KO) mice.
(a-b) Representative traces from whole-cell patch clamp recordings of horizontal cells held at –70 mV (a) and quantified data (b) for currents evoked by 1 s light flashes (λ=410 nm) plotted against light intensities. In b, peak current amplitudes during (ON Response) and after (OFF Response) the light stimuli were plotted against photon flux per μm2q/μm2). Data represent mean ± SEM. WT, n=8; G369i KI, n=13; Cav1.4 KO, n=8. There was a significant difference in responses of WT, G369i KI, and Cav1.4 KO horizontal cells. For ON responses, F(16, 216)=22, p<0.0001 by two-way repeated measures ANOVA, Tukey’s multiple comparisons post-hoc test. For OFF responses, F(16, 216)=13.61, p<0.0001 by two-way repeated measures ANOVA, Tukey’s multiple comparisons post-hoc test. (c–d) Representative traces from horizontal cells held at –70 mV (c) and quantified data (d) for currents evoked by 1 s light flashes (λ=410 nm, 1.2 × 10⁵ Φq/μm2) before, during, and after washout of DNQX (20 μM). In d, symbols represent responses from individual cells, n=5 cells for WT and three cells for G369i KI, bars represent mean ± SEM. **p<0.01 by paired t-tests.
Figure 9.
Figure 9.. Ca2+ imaging of cone terminals in wild-type (WT) and G369i KI mice.
Depolarization-evoked fluorescence changes (ΔF) were measured by two-photon imaging of Fluo3-filled cone pedicles labeled with PNA-Alexa 568. (a) Representative images at the indicated timepoints (T) before (control), during, and after (wash) bath application of KCl (50 mM) and KCl + ISR (10μ M). For clarity, PNA-Alexa 568 labeling was outlined (magenta, solid circles) and the actual labeling was only shown in the initial panel of images. Dashed, yellow circles represent ROIs for analyses. (b) Changes in cone pedicle Fluo3 fluorescence were normalized to the initial fluorescence intensity at time = 0 (ΔF/F0). Solid lines and shaded areas represent the mean ± SEM, respectively. WT, n=11 pedicles; G369i KI, n=14 pedicles.
Figure 10.
Figure 10.. Characterization of electroretinograms (ERGs) and visual behavior in wild-type (WT), G369i KI, and Cav1.4 knockout (KO) mice.
(a) Representative traces of photopic ERGs recorded in the presence of background green light (20 cd · s/m2) in WT, G369i KI, and CaV1.4 KO mice. Flash intensities are shown on the left. Arrows and arrowheads depict the a- and b-waves, respectively. (b) a-wave (left), and b-wave (right) amplitudes are plotted against light intensity. Symbols and bars represent mean ± SEM. WT, n=7; G369i KI, n=5; CaV1.4 KO, n=6. *p<0.05; **p<0.01; ***p<0.001; ****p<0.0001; ns, not significant; Two-way ANOVA with Tukey’s posthoc multiple comparisons. (c, d) Representative traces (c) and quantified data (d) for 10 Hz flicker responses evoked by white light flashes of increasing luminance (from –4–2 log cd· s/m2). Arrows in c depict inverted waveform responses in G369i KI mice that are absent in Cav1.4 KO mice. Symbols and bars represent mean ± SEM. WT, n=7; G369i KI, n=5; CaV1.4 KO, n=6. *p<0.05; **p<0.01. Two-way ANOVA with Tukey’s posthoc multiple comparisons. (e) Representative swim path traces of WT, G369i KI, and CaV1.4 KO mice from the visible platform swim tests performed in the dark (scotopic, upper panel) and light (photopic, lower panel). (f) Time required to reach the platform (latency to platform) was compared for each mouse strain. Symbols represent the average of the last 3 swim trials for each mouse of each genotype for both dark and light conditions. Dotted lines represent the mean. WT, n=11; G369i KI, n=10; CaV1.4 KO, n=9. *p<0.05; ***p<0.001; ****p<0.0001; Kruskal-Wallis one-way ANOVA with Dunn’s post hoc analysis.

Update of

Similar articles

References

    1. Alpadi K, Magupalli VG, Käppel S, Köblitz L, Schwarz K, Seigel GM, Sung C-H, Schmitz F. RIBEYE recruits Munc119, a mammalian ortholog of the Caenorhabditis elegans protein unc119, to synaptic ribbons of photoreceptor synapses. The Journal of Biological Chemistry. 2008;283:26461–26467. doi: 10.1074/jbc.M801625200. - DOI - PMC - PubMed
    1. Bech-Hansen NT, Naylor MJ, Maybaum TA, Pearce WG, Koop B, Fishman GA, Mets M, Musarella MA, Boycott KM. Loss-of-function mutations in a calcium-channel alpha1-subunit gene in Xp11.23 cause incomplete X-linked congenital stationary night blindness. Nature Genetics. 1998;19:264–267. doi: 10.1038/947. - DOI - PubMed
    1. Beier C, Hovhannisyan A, Weiser S, Kung J, Lee S, Lee DY, Huie P, Dalal R, Palanker D, Sher A. Deafferented adult rod bipolar cells create new synapses with photoreceptors to restore vision. The Journal of Neuroscience. 2017;37:4635–4644. doi: 10.1523/JNEUROSCI.2570-16.2017. - DOI - PMC - PubMed
    1. Bijveld MMC, van Genderen MM, Hoeben FP, Katzin AA, van Nispen RMA, Riemslag FCC, Kappers AML. Assessment of night vision problems in patients with congenital stationary night blindness. PLOS ONE. 2013;8:e62927. doi: 10.1371/journal.pone.0062927. - DOI - PMC - PubMed
    1. Bimonte-Nelson H, Daniel J, Koebele S. The Maze Book: Theories, Practice, and Protocols for Testing Rodent Cognition. Springer; 2015. - DOI

Substances

Supplementary concepts