Meta-Analysis
. 2024 Nov 11;19(11):e0310625.
doi: 10.1371/journal.pone.0310625. eCollection 2024.

Post-transcriptional control drives Aurora kinase A expression in human cancers

Affiliations
Meta-Analysis

Post-transcriptional control drives Aurora kinase A expression in human cancers

Roberta Cacioppo et al. PLoS One. .

Abstract

Aurora kinase A (AURKA) is a major regulator of the cell cycle. A prominent association exists between high expression of AURKA and cancer, and impairment of AURKA levels can trigger its oncogenic activity. In order to explore the contribution of post-transcriptional regulation to AURKA expression in different cancers, we carried out a meta-analysis of -omics data of 18 cancer types from The Cancer Genome Atlas (TCGA). Our study confirmed a general trend for increased AURKA mRNA in cancer compared to normal tissues and revealed that AURKA expression is highly dependent on post-transcriptional control in several cancers. Correlation and clustering analyses of AURKA mRNA and protein expression, and expression of AURKA-targeting hsa-let-7a miRNA, unveiled that hsa-let-7a is likely involved to varying extents in controlling AURKA expression in cancers. We then measured differences in the short/long ratio (SLR) of the two alternative cleavage and polyadenylation (APA) isoforms of AURKA mRNA across cancers compared to the respective healthy counterparts. We suggest that the interplay between APA and hsa-let-7a targeting of AURKA mRNA may influence AURKA expression in some cancers. hsa-let-7a and APA may also independently contribute to altered AURKA levels. Therefore, we argue that AURKA mRNA and protein expression are often discordant in cancer as a result of dynamic post-transcriptional regulation.


Conflict of interest statement

The authors have declared that no competing interests exist.

Figures

Fig 1
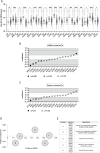
Fig 1. Pan-cancer analysis of AURKA mRNA and protein expression.
(A) Median and 95% CI of AURKA mRNA FPKM values in 18 TCGA cancers compared to their respective normal tissue (NT). Number of datasets per condition shown in Table 1, filtered set. Kruskal-Wallis with Dunnett’s multiple comparisons test. ns, not significant; *, p<0.02; ****, p<0.0001. (B) Distribution of r coefficients of the AURKA mRNA-protein correlation across cancers. p<0.001 for all r coefficients except KIRP, PCPG, PRAD and THCA (p>0.05). (C) Graphic representation of molecular processes likely underlying the AURKA mRNA-protein correlation in cancer samples. Figure created with BioRender.com.
Fig 2
Fig 2. Pan-cancer analysis of hsa-let-7a expression and involvement in AURKA expression.
(A) Median and 95% CI of hsa-let-7a RPM values in 18 TCGA cancers compared to their respective normal tissue (NT). Number of datasets per condition shown in Table 2, filtered set. Kruskal-Wallis with Dunnett’s multiple comparisons test. ns, not significant; **, p<0.01; ***, p<0.001; ****, p<0.0001. (B) Distribution of r coefficients of the AURKA mRNA-hsa-let-7a correlation across cancers. p<0.001 for r coefficients of BRCA, LUAD, PRAD, THCA, UCEC; p<0.05 for r coefficient of LUSC; p>0.05 for all other r coefficients. (C) Distribution of r coefficients of the AURKA protein-hsa-let-7a correlation across cancers. p<0.001 for r coefficients of BRCA and UCEC; p>0.05 for all other r coefficients. (D) Clusters found according to common trends in the two types of correlation. The r coefficient of the indicated correlation is plotted on each axis. Data was also plotted on an interactive 3D graph visible in full interactive mode at math3d.org/bpYNRCnPA. (E) Table showing clusters composition and speculative involvement of hsa-let-7a in controlling AURKA expression.
Fig 3
Fig 3. Pan-cancer profiling of AURKA APA mRNA isoforms.
(A) Integrative Genomics Viewer (IGV) view of the depth of coverage of reads mapping to the 3’ end of the AURKA-203 transcript (the last exon and 3’ UTR are shown at the bottom, in blue). A subset of BRCA primary tumour samples is shown, selected to represent a range of SLRs, from low (top) to high (bottom). Reference genome GRCh38/hg38. Note, the y-axis scale (read depth) differs across panels. (B), (C) Mean and standard error of the mean of SLR fold change values for cancer-normal sample pairs of AURKA transcript ENST00000371356.6 (B) and CCND1 transcript ENST00000227507.3 (C). Value of the mean indicated. SLR values were calculated using APAtrap and the analysis was performed once. n, number of cancer-normal sample pairs. Y axis in log2 scale.
Fig 4
Fig 4. Interplay of APA and hsa-let-7a in regulating AURKA expression.
(A) Distribution of r coefficients of the AURKA protein-SLR correlation across cancers. p<0.05 only for BRCA. (B) Scatter plot showing cancers according to the cancer/normal AURKA SLR fold change and to the value of the ‘protein vs SLR’ correlation coefficient r. (C) Distribution of r coefficients of the AURKA mRNA-SLR correlation across cancers. p>0.05 for all r coefficients. (D) Scatter plot showing cancers according to the r coefficient of the ‘protein vs SLR’ and of the ‘hsa-let-7a vs SLR’ correlations.
Fig 5
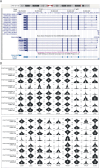
Fig 5. Heterogeneity of AURKA splicing isoforms across cancers.
(A) UCSC Genome Browser view of AURKA transcript variants annotated in the NCBI (top) and Ensembl (bottom) databases. AURKA gene resides on the negative strand. The MANE isoform identical in both databases is shown in light blue at the bottom. (B) Violin plots showing the expression level [log2(TPM+1)] of the individual Ensembl AURKA transcripts in the TCGA cancers on the y axis. Cancer types in columns, AURKA transcripts in rows. TPM, transcript per million. Figure downloaded from the GEPIA2 platform. (A), (B) ENST00000395907.5 (AURKA-204) transcript is displayed although it has lower annotation quality.

Similar articles

References

    1. Willems E. et al.. The functional diversity of Aurora kinases: a comprehensive review. Cell Div. 13, 7 (2018). doi: 10.1186/s13008-018-0040-6 - DOI - PMC - PubMed
    1. Xu J. et al.. Aurora-A identifies early recurrence and poor prognosis and promises a potential therapeutic target in triple negative breast cancer. PLoS One 8, e56919 (2013). doi: 10.1371/journal.pone.0056919 - DOI - PMC - PubMed
    1. Zhang J., Li B., Yang Q., Zhang P. & Wang H. Prognostic value of Aurora kinase A (AURKA) expression among solid tumor patients: a systematic review and meta-analysis. Jpn. J. Clin. Oncol. 45, 629–636 (2015). doi: 10.1093/jjco/hyv058 - DOI - PubMed
    1. Du R., Huang C., Liu K., Li X. & Dong Z. Targeting AURKA in Cancer: molecular mechanisms and opportunities for Cancer therapy. Mol. Cancer 20, 15 (2021). doi: 10.1186/s12943-020-01305-3 - DOI - PMC - PubMed
    1. Bavetsias V. & Linardopoulos S. Aurora Kinase Inhibitors: Current Status and Outlook. Front. Oncol. 5, 278 (2015). doi: 10.3389/fonc.2015.00278 - DOI - PMC - PubMed

Publication types

Grants and funding

We were funded by the Department of Pharmacology to Roberta Cacioppo and UKRI | Biotechnology and Biological Sciences Research Council (BBSRC) (BB/R004137/1) to Catherine Lindon. The funders had no role in study design, data collection and analysis, decision to publish, or preparation of the manuscript.

LinkOut - more resources