Review
. 2024 Oct 30;16(21):3667.
doi: 10.3390/cancers16213667.

Design Principles and Applications of Fluorescent Kinase Inhibitors for Simultaneous Cancer Bioimaging and Therapy

Affiliations
Review

Design Principles and Applications of Fluorescent Kinase Inhibitors for Simultaneous Cancer Bioimaging and Therapy

Ab Majeed Ganai et al. Cancers (Basel). .

Abstract

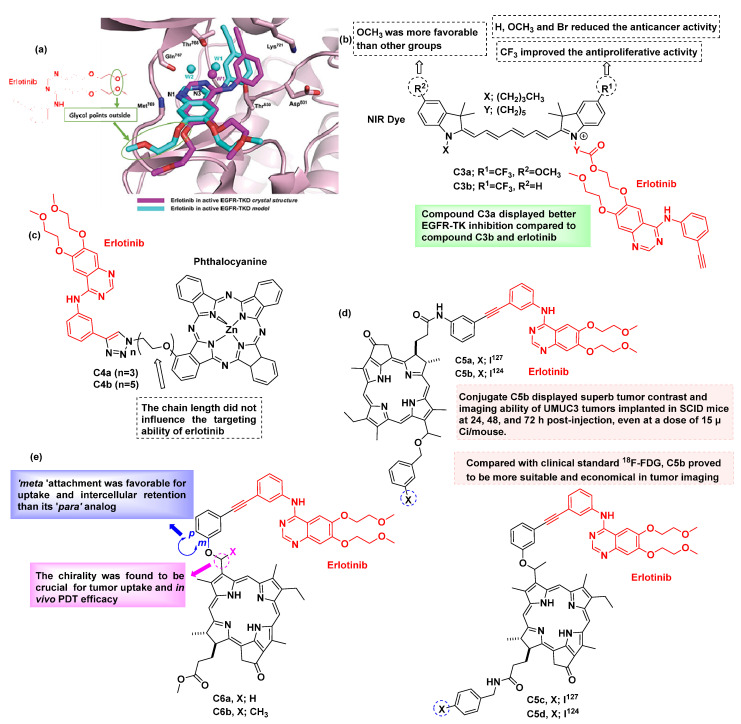
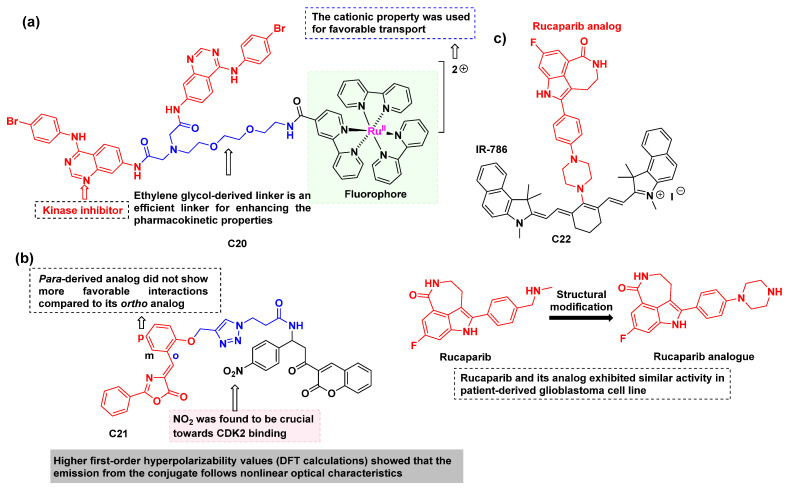
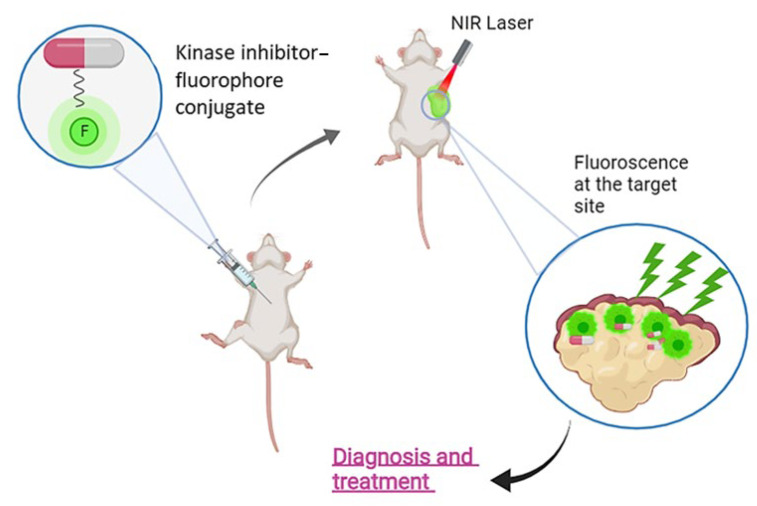
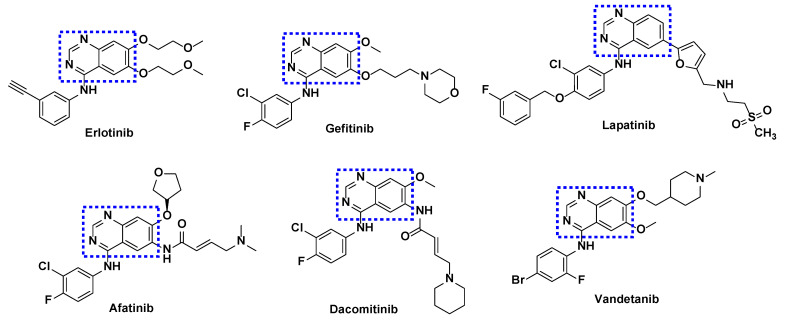
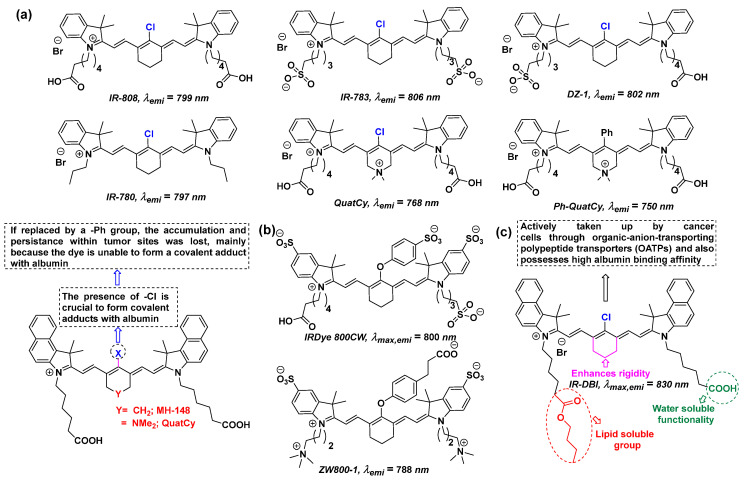
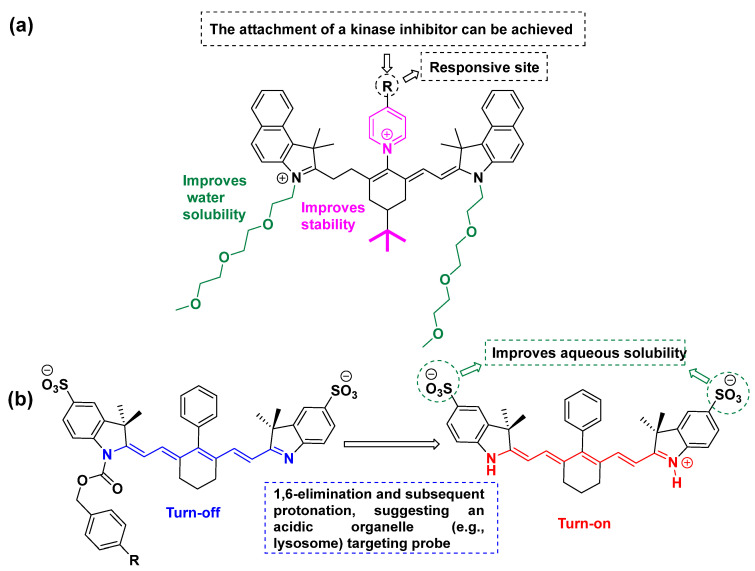
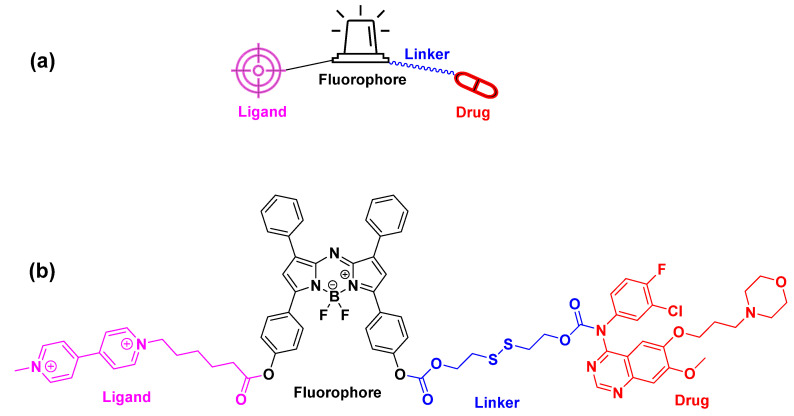
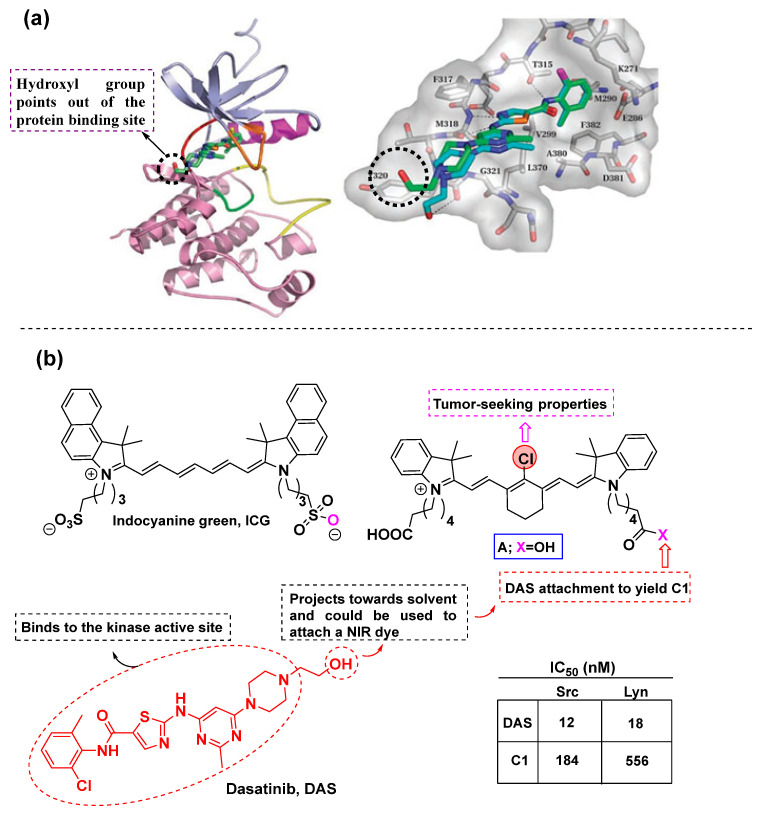
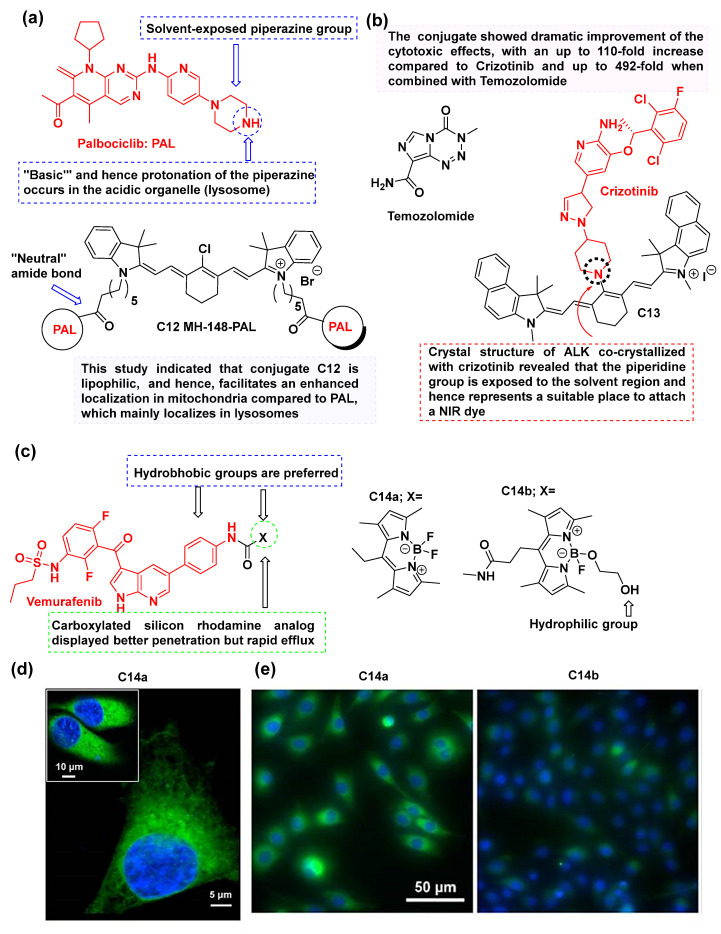
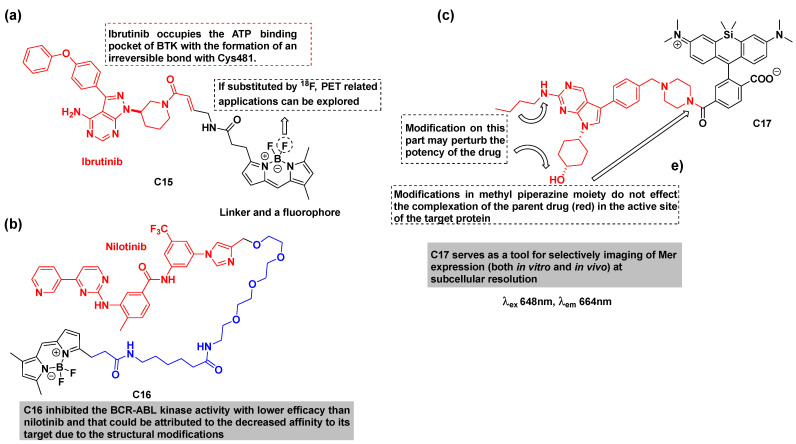
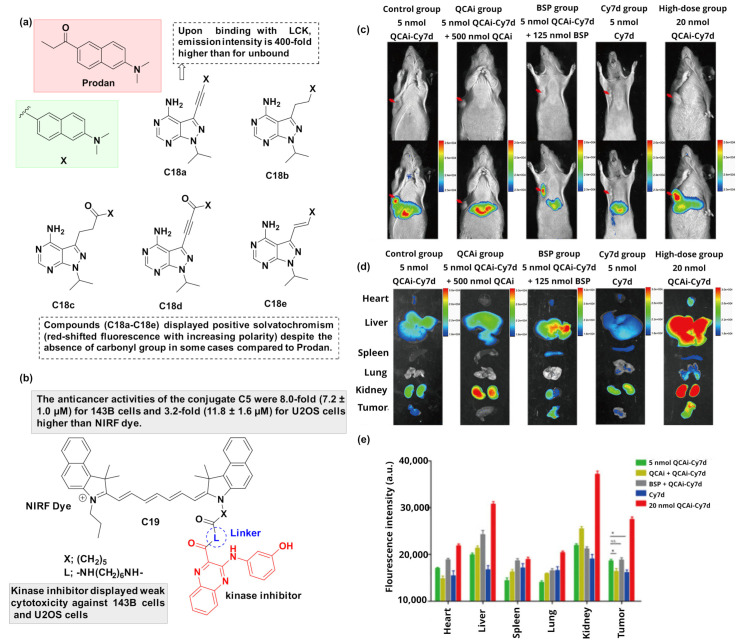
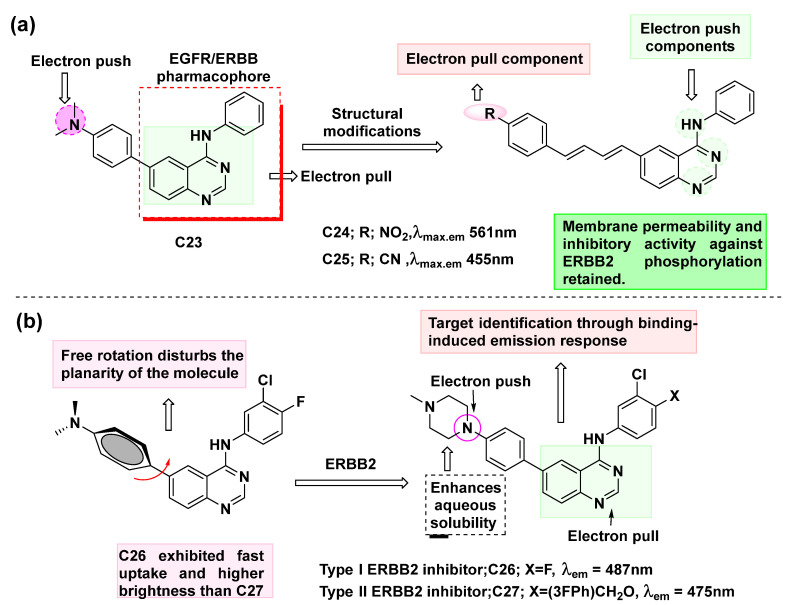
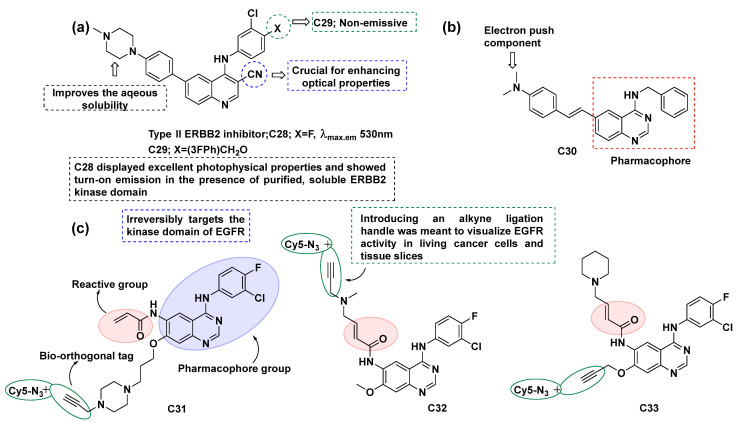
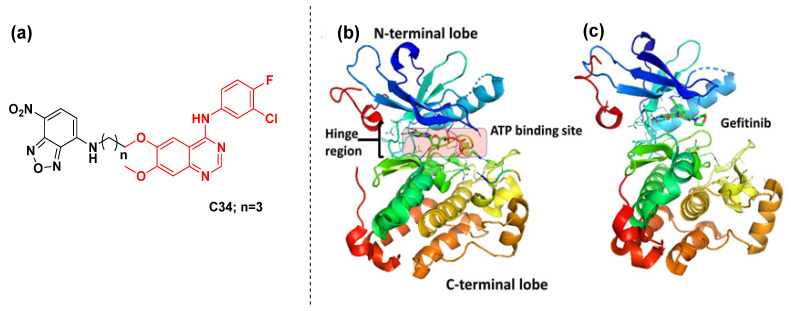
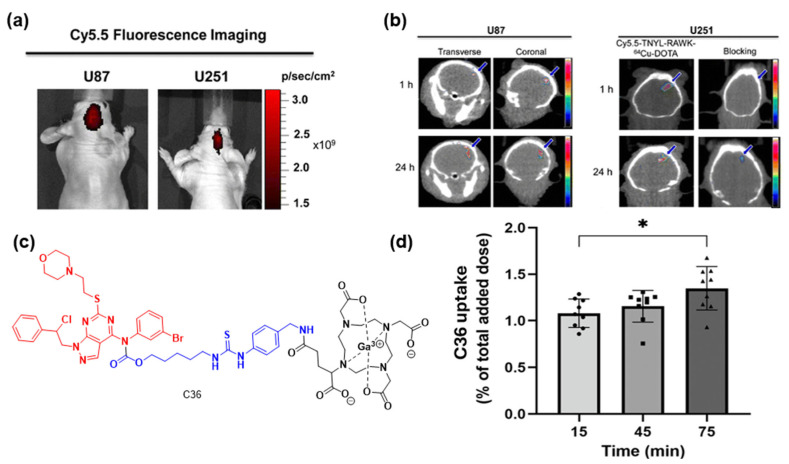
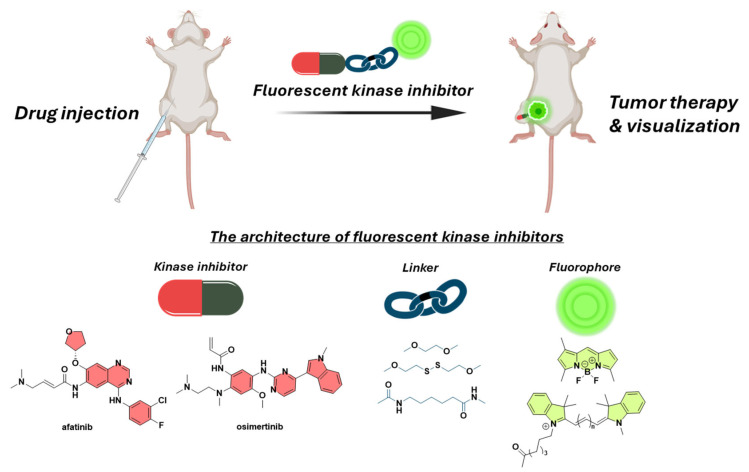
Kinase inhibitors are potent therapeutic agents in cancer treatment, but their effectiveness is frequently restricted by the inability to image the tumor microenvironment. To address this constraint, kinase inhibitor-fluorophore conjugates have emerged as promising theranostic agents, allowing for simultaneous cancer diagnosis and treatment. These conjugates are gaining attention for their ability to visualize malignant tissues and concurrently enhance therapeutic interventions. This review explores the design principles governing the development of multimodal inhibitors, highlighting their potential as platforms for kinase tracking and inhibition via bioimaging. The structural aspects of constructing such theranostic agents are critically analyzed. This work could shed light on this intriguing field and provide adequate impetus for developing novel theranostic compounds based on small molecule inhibitors and fluorophores.

Keywords: bioimaging; conjugates; design principles; kinase inhibitors; theranostic agents.


Conflict of interest statement

The authors declare no conflict of interest.

Figures

Figure 9
Figure 9
Erlotinib-based fluorescent inhibitors. (a) Erlotinib’s binding to active EGFR-TKD in the crystal structure and model [64]; (b) SAR study of NIR-based erlotinib conjugates C3a and C3b [61]; (c) Phthalocyanine–erlotinib conjugates C4a and C4b [62]; (d) Erlotinib conjugate C5a to C5d [63]; (e) Erlotinib conjugates C6a and C6b [47]. Erlotinib is colored red in all cases.
Figure 15
Figure 15
(a) The structure of the quinazoline-based Ru(II)-Bipyridine theranostic conjugate C20 [92]; (b) The structure of the oxazolone–coumarin derived conjugate C21 as a solid-state emitter [93]; (c) The structure of conjugate C22 targeting three different patient-derived glioblastoma cell lines [95]. The drugs are colored red, the linkers blue, and the fluorophores black.
Figure 1
Figure 1
Example of fluorescence-guided diagnosis and therapy using fluorescent kinase inhibitors.
Figure 2
Figure 2
Quinazoline-based kinase inhibitors approved by the FDA for the treatment of different types of cancers. The quinazoline group is highlighted with a dotted blue line.
Figure 3
Figure 3
(a) Cyanine-based fluorescent dyes bearing either a meso-Cl (highlighted in blue) or a -Ph group. (b) Two cyanine derivatives used in clinical trials for fluorescence-guided surgery. (c) A multimodal therapeutic NIR dye containing a meso-Cl functionality [41].
Figure 4
Figure 4
Water solubility enhancement by inserting different functional groups: (a) PEG and (b) SO3.
Figure 5
Figure 5
Incorporation of the tumor-homing polyamine to offer a selective accumulation of a theranostic BODIPY-gefitinib agent to the tumor site. (a) The general architecture of the fluorescent–drug conjugates with tumor-homing elements; (b) chemical structure of the BODIPY-gefitinib agent. The targeting element (polyamine) is colored purple, the fluorophore (BODIPY) black, the linker (disulfide bond) blue, and the cytotoxic and kinase targeting drug (gefitinib) red [56].
Figure 6
Figure 6
Dasatinib-based conjugates after rational design. (a) Crystal structure of dasatinib complex with ABL kinase, with the hydroxyl group pointing out of the kinase cavity [34]. (b) The structure of the fluorescent dasatinib-based analog C1 utilized against glioblastoma and liver cancer [57,58].
Figure 7
Figure 7
Dasatinib-based conjugates. (a) Fluorescent dasatinib-based conjugate C2a utilized against GIST cancer; (b) In vivo fluorescence imaging pattern of GIST-T1 xenografted mice treated with conjugate C2a (10 mg/kg injected intravenously) and fluorescence images acquired before and 12 h post-injection. The yellow dashed circles correspond to the tumors; (c) The ex vivo fluorescence images of the heart, lung, liver, gallbladder, spleen, kidneys, stomach, small intestine, cecum, and tumor acquired 48 h after injection of C2a (10 mg/kg); (d) The ex vivo imaging pattern of the tumors and intestines after washing with saline. The tissues were collected from mice 48 h after injection with C2a (10 mg/kg) and images were acquired after washing [59]. The dye is colored black, the linker blue, and the inhibitor (dasatinib) red.
Figure 8
Figure 8
(a) The structure of the fluorescent dasatinib-based conjugate C2b utilized for PET imaging; (b) Fluorescence imaging of mBSG co-incubated with C2b shows fluorescence localization to glioma cells (15 min incubation); (c) similar distribution of staining in C2b fluorescence (red) and DAPI (blue) nuclei; (d) Cell mask plasma membrane stain (green)/DAPI(blue); (e) [18F]-1 delivery by CED to glioma at 15, 25, 40, 70, and 160 min. Blue arrows indicate glioma location. Mouse (ii) indicates successful CED delivery. Mouse (iii) indicates unsuccessful CED delivery. The correspondence of the imaging technique with the colors is as follows: PET(red)/CT(blue)/MR(grey); (f) ex vivo fluorescence analysis of [18F]-1 delivered by CED to the same mouse (ii). Fluorescence is represented in pink [60]. The dye is colored blue, the linker black, and the inhibitor (dasatinib) red.
Figure 10
Figure 10
Gefitinib-based fluorescent inhibitors. (a) Structures of gefitinib-derived fluorescent conjugates C8a and C8b; (b) Tumor masses and fluorescence images of nude mice with PC9 cells and H1650 cells after treated with saline, Gefitinib, TPG-conjugate with the fluorophore, or PPG- conjugate without the fluorophore (0.5 mM in 0.2 mL, DMSO/saline, 1:1/v/v, qod. iv.) (n = 7 per group), ** p < 0.01 vs. control group. ## p < 0.01 vs. Gefitinib group; (c) Imaging of the subcutaneously implanted H1650 tumor xenografts of nude mice at 2, 5, 8, 16, and 24 h after tail vein injection of a single dose of 0.2 mL of TPG (DMSO/saline 1:1/v/v) (n = 3 independent experiments), (d) Images of the excised organs (lung, heart, liver, kidney, spleen) and tumors of the mice (n = 3 independent experiments) [56]; (e) Tumor masses and fluorescent images of nude mice bearing PC9 cells subcutaneous cancer xenografts were established and treated with saline, gefitinib, TBG, PBG (0.5 mmol/L in 0.2 mL saline, DMSO/saline (1/1, v/v), qod. i.v.) (n = 5 per group) * p < 0.05, ** p < 0.01; (f) and their xenografts for 2, 5, 8, 16, and 24 h after tail vein injection of a single dose of 0.2 mL of TBG (DMSO/saline (1/1, v/v)) (n = 5); (g) Images of the excised organs (lung, heart, liver, kidney, spleen) and tumors of the mice (n = 5 independent experiments); (h) Structure of gefitinib-derived fluorescent conjugates C9 [65].
Figure 11
Figure 11
Afatinib-based fluorescent inhibitors. (a) Structures of afatinib-derived fluorescent conjugates C10a and C10b; (b) Fluorescence imaging obtained for C10a-treated xenografted mice for up to 48 h (λex 540 ± 10 nm and λem 560 ± 20 nm) [72]; (c) Structure of the fluorescent conjugate C11; (d) Addition of increasing amounts of EGFR results in a turn-on fluorescent response of C11 in aqueous conditions [73]. The inhibitor (afatinib) is colored red in both cases.
Figure 12
Figure 12
(a) The structure of MH-148-palbociclib conjugate C12 [74]; (b) The structure of HMDA-based crizotinib conjugate C13 [75]; (c) The structures of vemurafenib-based fluorescent conjugates C14a and C14b [76]; (d) High-resolution microscopy of C14a in A375 and SK-MEL-28 cells (inset); (e) In vitro imaging of C14a exhibiting prolonged cytoplasmic retention with minimal background fluorescence, in contrast to C14b, in SK-MEL-28 cells [blue: HOECHST 33342, green: BODIPY]. The fluorophores are colored black and the drugs in red all the examples [76].
Figure 13
Figure 13
(a) The structure of ibrutinib-derived fluorescent conjugate C15 [77]; (b) The structure of nilotinib-derived fluorescent conjugate C16 [79]; (c) The structure of UNC2025-derived fluorescent conjugate C17 [86]. The fluorophores are colored black and the drugs red in all the examples.
Figure 14
Figure 14
(a) The structures of prodan-derived fluorescent conjugates C18a and C18e [89]; (b) The structure of NIR dye-based PIM1 conjugate C19 [91]. NIR fluorescence imaging and biodistribution of C19 in vivo; (c) NIR imaging results of whole body at 48 h after the injection of the five different preparations (red arrow indicates tumors); (d) NIR fluorescence imaging results of organs and tumors at 48 h post-injection; (e) Graph presenting the fluorescence intensity of organs and tumors treated with different preparations (exposure time: 2 s). The drug is colored red, the linkers blue, and the fluorophores black.
Figure 16
Figure 16
(a) The structure of fluorescent quinazoline-based analogs C23–C25 [98]; (b) The structure of quinazoline-based fluorescent molecules C26 and C27 [97].
Figure 17
Figure 17
(a) The structure of cyanoquinazoline-derived fluorescent inhibitor C28 [96]; (b) The structure of quinazoline-derived fluorescent inhibitor C30 [99]; (c) The structure of quinazoline-derived fluorescent inhibitors C31, C32 and C33 [100].
Figure 18
Figure 18
(a) The structure of quinazoline-derived fluorescent molecule; (b) Crystal structure of the kinase domain of EGFR with ATP binding site highlighted (PDB ID: 2GS6). TKIs of EGFR bind to EGFR in the ATP binding pocket, forming 1 to 3 hydrogen bonds to the hinge region; (c) EGFR kinase domain with gefitinib bound in the ATP binding pocket (PDB ID: 3UG2) [102]. The drug is colored red.
Figure 19
Figure 19
(a) Cy5.5 NIR optical imaging of U87-Luc and U251-Luc tumors 24 h after a tail vein injection of C35. (b) μPET/CT images of U87-Luc tumors (left) and U251-Luc tumors with C35 and C35 plus an excess of unlabeled C35 (right) 1 h and 24 h post-injection [103]; (c) Structure of C36; (d) Cellular uptake of C36 in U87MG glioblastoma cancer cells (experiments done in triplicate, * p < 0.05) [104].
Figure 20
Figure 20
A schematic illustration highlighting the key components of a fluorescent drug conjugate: drug, linker, and fluorophore.

Similar articles

References

    1. Cancer Statistics. (n.d.). Cancer.gov. [(accessed on 1 February 2023)]; Available online: https://www.cancer.gov/about-cancer/understanding/statistics.
    1. Shevtsov M., Sato H., Multhoff G., Shibata A. Novel Approaches to Improve the Efficacy of Immuno-Radiotherapy. Front. Oncol. 2019;9:156. doi: 10.3389/fonc.2019.00156. - DOI - PMC - PubMed
    1. Gupta S., Howard S.C., Hunger S.P., Antillon F.G., Metzger M.L., Israels T., Harif M., Rodriguez-Galindo C. Treating Childhood Cancer in Low- and Middle-Income Countries. In: Gelband H., Jha P., Sankaranarayanan R., Horton S., editors. Cancer: Disease Control Priorities. 3rd ed. Volume 3 The International Bank for Reconstruction and Development/The World Bank© 2015 International Bank for Reconstruction and Development the World Bank; Washington, DC, USA: 2015. - PubMed
    1. Schirrmacher V. From chemotherapy to biological therapy: A review of novel concepts to reduce the side effects of systemic cancer treatment (Review) Int. J. Oncol. 2019;54:407–419. doi: 10.3892/ijo.2018.4661. - DOI - PMC - PubMed
    1. Roskoski R., Jr. Properties of FDA-approved small molecule protein kinase inhibitors: A 2021 update. Pharmacol. Res. 2021;165:105463. doi: 10.1016/j.phrs.2021.105463. - DOI - PubMed

LinkOut - more resources