. 2024 Nov 8;15(1):9685.
doi: 10.1038/s41467-024-54034-2.

Molecular signatures of cortical expansion in the human foetal brain

Affiliations

Molecular signatures of cortical expansion in the human foetal brain

G Ball et al. Nat Commun. .

Abstract

The third trimester of human gestation is characterised by rapid increases in brain volume and cortical surface area. Recent studies have revealed a remarkable molecular diversity across the prenatal cortex but little is known about how this diversity translates into the differential rates of cortical expansion observed during gestation. We present a digital resource, μBrain, to facilitate knowledge translation between molecular and anatomical descriptions of the prenatal brain. Using μBrain, we evaluate the molecular signatures of preferentially-expanded cortical regions, quantified in utero using magnetic resonance imaging. Our findings demonstrate a spatial coupling between areal differences in the timing of neurogenesis and rates of neocortical expansion during gestation. We identify genes, upregulated from mid-gestation, that are highly expressed in rapidly expanding neocortex and implicated in genetic disorders with cognitive sequelae. The μBrain atlas provides a tool to comprehensively map early brain development across domains, model systems and resolution scales.


Conflict of interest statement

J.S. and A.A.-B. are co-founders of Centile Bioscience. The remaining authors declare no competing interests.

Figures
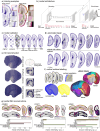
Fig. 1
Fig. 1. Generation of a 3D anatomical atlas of the mid-gestation foetal brain.
a Paired histological sections and simplified anatomical annotations were divided into 256 × 256 random patches (n = 1000) for model training. Patches were quality-checked prior to selection to ensure good overlap between labels and anatomy and no tissue damage. b Pix2pix model architecture showing a U-Net generator coupled with a PatchGAN discriminator. Box sizes represent image width, height and number of filters/channels (depth) at each layer. The filters and dimensions of each layer are shown below. c Model performance was evaluated on a set of sections that were not included in the training dataset. Checkerboard occlusions are shown with the original section, occluded patch predictions are shown using the trained model after a given number of iterations. d The trained model was used to replace RGB values of outlying pixels with synthetic estimates. Top row: original sections spaced throughout the cerebral hemisphere with automatically identified outlier pixels outlined in grey. Bottom row, repaired sections. e Repaired sections were aligned via linear, affine and iterative nonlinear registrations (see “Methods”) to create a 3D volume with a final isotropic resolution of 150 µm. Right: Cut-planes illustrate internal structures after each stage of reconstruction. The reconstructed tissue label volume is shown in Supplementary Fig. S4. VZ: ventricular zone. f The outer (pial) and inner (subplate) cortical plate boundaries were extracted as surface tessellations. The μBrain cortical labels were projected onto the surface vertices to form the final cortical atlas (see Supplementary Fig. S4). Cortical areas correspond to matched LMD microarray data (Supplementary Data S4 and Supplementary Fig. S4d). g Partial reconstructions of EOMES, FOXP1 and GRIK2 ISH data. ISH-stained sections were registered to the nearest Nissl-stained sections and aligned to the μBrain volume. Top row: selected axial and coronal sections of the μBrain volume and corresponding tissue labels with ISH expression of three developmental genes: EOMES, FOXP1 and GRIK2 overlaid. Expression intensity was derived from false-colour, semi-quantitative maps of gene expression. Bottom row: average expression intensity within each tissue or brain structure based on μBrain tissue labels. Averages were calculated only within sections where ISH was available for each gene. Source data are provided as a Source Data file.
Fig. 2
Fig. 2. Regional gene expression in the mid-gestation foetal brain.
a PCA of LMD microarray data (n = 8771 genes) in four prenatal brain specimens aged 15 PCW to 21 PCW. All tissue samples are shown (left) and coloured by tissue zones (main) and specimen (inset). PCA was applied to all samples in each tissue zone separately (right). Samples are coloured by specimen and clustered by age. PC: Principal component. b PC1 was associated with age-related change in all tissues and correlated between neighbouring zones. Plots show mean gene expression at 21 PCW (averaged over specimen and region) against fold change in gene expression between 15/16 PCW and 21 PCW for two tissue zones (cortical plate, top and ventricular zone, bottom). Genes with a log2(fold change) > 0.3 are shown in green (< − 0.3 in blue). Representative genes are highlighted. c Number of genes with differential expression over tissue zones (ZONE), cortical region (REGION) or timepoint (TIME). Venn diagram shows the overlap of gene sets. In total, n = 2145 were differentially expressed across zone, region and time (ZRT genes). d Foetal cell type enrichment of ZRT genes differentially expressed in the cortical plate and ventricular zones (left). Enrichments of other tissue zones are shown in Supplementary Fig. S10. Significant cell type enrichments in each zone are highlighted with black outline (one-sided hypergeometric test; p < 0.05 uncorr.). UMAP projection of cell types showing enriched clusters of OPCs and radial glia in the proliferative ventricular zone, and neuronal cell types in the cortical plate. Inset: UMAP projection coloured by cell type. CR: Cajal-Retzius cells; IPC: intermediate progenitor cells; OPC: oligodendrocyte progenitor cells; RG: radial glia. e ZRT gene expression over time and region. Wedge plots (left) show the pattern of expression of ZRT genes that decrease (left) or increase (right) between 15 and 21 PCW. Rows indicate tissue zones, and columns indicate cortical regions ordered from anterior to posterior poles. Boxes are coloured by changes in gene expression over time (Δ expression). Right: bar charts show mean change in gene expression for decreasing (top) and increasing (bottom) ZRT genes averaged within tissue zones. CP: cortical plate; SP: subplate; IZ: intermediate zone; SVZ: subventricular zone; VZ: ventricular zone. Source data are provided as a Source Data file.
Fig. 3
Fig. 3. Preferential cortical expansion during the third trimester.
a n = 195 foetal MRI scans were acquired during the third trimester of pregnancy. T2-weighted (T2W) scans were reconstructed using a motion-robust processing pipeline and used to generate tessellated cortical surface representations that were aligned to the dHCP foetal surface template b μBrain cortical labels projected onto dHCP foetal template surfaces from 21 to 36 weeks gestation using nonlinear surface registration. Surfaces are scaled to the same size for visualisation. c For each timepoint, weighted average vertex area maps are displayed on the respective surface templates. Foetal cortical area maps were calculated from individual, co-registered and resampled foetal surfaces using a Gaussian kernel (sigma = 1 week). d Total cortical surface area calculated across all surface vertices (excluding the midline) as a function of gestational age at scan. e Left: Models of allometric scaling were calculated for each vertex, modelling log10(vertex area) as a function of log10(total area) (top). In this framework, β> 1 indicates hyperallometric growth (a relative expansion faster than the global rate). Note that a faster growth rate does not necessarily equate to greater total area at any given time (bottom). Middle: Hyperallometric scaling with respect to total cortical surface area (β>1) plotted on the 36w template surface representing preferential cortical expansion during development. Right: Distribution of scaling coefficients for all vertices in each μBrain label in (a), ordered by mean scaling. Boxplots show quartiles (box) and range (whiskers) of areal scaling for all vertices in each region, markers indicate outliers (> 1.5 interquartile range). f Right: In total, the expression of 433 ZRT genes was correlated with areal scaling in gestation. Left: Significant associations (Kendall’s τ, pFDR < 0.01) were observed across both early (15/16 PCW) and mid-gestation (21 PCW) time points and in all tissue zones. g Enrichment of hypoallometric (left) and hyperallometric (right) ZRTscaling genes in cortical-type specific cell markers. Circle size denotes enrichment ratio, and significant associations (p < 0.05, one-sided hypergeometric test, uncorr.) are highlighted with black outline. OPC: oligodendrocyte precursors; Astro: astrocytes; RG: radial glia; IPC: intermediate progenitor cells. Source data are provided as a Source Data file.
Fig. 4
Fig. 4. Preferential neocortical expansion is associated with differential timing of neurogenesis and gliogenesis.
a 133 ZRT genes were associated (Kendall’s tau, pFDR < 0.01 corrected) with areal scaling of the neocortex (after excluding paleo- and archi-cortex; ZRTneo). Most significant associations were localised to the IZ. b normalised (Z-score) expression profiles for genes correlated with areal scaling in each tissue zone at 21 PCW. Associations at 15 PCW are shown in Supplementary Fig. S14. Negative associations (higher relative expression in hypoallometric regions) are shown in blue, and positive associations are in red. Lighter colours indicate higher relative expression. The most significant associations are in the IZ. c Mid-gestation cell clusters significantly enriched (one-sided hypergeometric test, p < 0.01 uncorr.) for genes associated with areal scaling in the IZ at 21 PCW. Territories of three cell types are shown. Negative and positive ZRTneo genes are enriched in progenitor cells and neurons, respectively. d Wedge plots are shown for two ZRTneo genes expressed by specific cell types: MDK (glial) and CUX1 (upper layer neurons). Rows indicate tissue zones, and columns indicate cortical regions ordered according to allometric scaling from hyper to hypoallometric. The colour bar indicates normalised expression levels (a.u.). CP: cortical plate; SP: subplate; IZ: intermediate zone; SVZ: subventricular zone; VZ: ventricular zone e Expression (Z-score) of MDK and CUX1 in all regions sampled in the IZ, ordered from hypo (top) to hyperallometric (bottom) scaling. f IZ expression of CUX1 (middle) and MDK (right) projected onto corresponding μBrain surface atlas labels and displayed on the 36w dHCP template surface. Regions where expression for a given gene was not available are shown in grey. For comparison, the average allometric scaling in each region is displayed (left). Source data are provided as a Source Data file.

Update of

Similar articles

References

    1. Petrides, M. & Pandya, D. N. Dorsolateral prefrontal cortex: comparative cytoarchitectonic analysis in the human and the macaque brain and corticocortical connection patterns. Eur. J. Neurosci.11, 1011–1036 (1999). - PubMed
    1. Brodmann, K. Vergleichende Lokalisationslehre der Grosshirnrinde. (Barth, Leipzig, 1909).
    1. Sanides, F. The cyto-myeloarchitecture of the human frontal lobe and its relation to the phylogenetic differentiation of the cerebral cortex. J. Hirnforsch.7, 269–282 (1964). - PubMed
    1. Barbas, H. & Rempel-Clower, N. Cortical structure predicts the pattern of corticocortical connections. Cereb. Cortex7, 635–646 (1997). - PubMed
    1. von Economo, C. & Koskinas, G. N. Die Cytoarchitektonik der Hirnrinde des erwachsenen Menschen. (J. Springer, Berlin, 1925).

MeSH terms

LinkOut - more resources