. 2024 Nov 4;22(1):504.
doi: 10.1186/s12916-024-03722-3.

Involvement of sphingosine-1-phosphate receptor 1 in pain insensitivity in a BTBR mouse model of autism spectrum disorder

Affiliations

Involvement of sphingosine-1-phosphate receptor 1 in pain insensitivity in a BTBR mouse model of autism spectrum disorder

Lili Fan et al. BMC Med. .

Abstract

Background: Abnormal sensory perception, particularly pain insensitivity (PAI), is a typical symptom of autism spectrum disorder (ASD). Despite the role of myelin metabolism in the regulation of pain perception, the mechanisms underlying ASD-related PAI remain unclear.

Methods: The pain-associated gene sphingosine-1-phosphate receptor 1 (S1PR1) was identified in ASD samples through bioinformatics analysis. Its expression in the dorsal root ganglion (DRG) tissues of BTBR ASD model mice was validated using RNA-seq, western blot, RT-qPCR, and immunofluorescence. Pain thresholds were assessed using the von Frey and Hargreaves tests. Patch-clamp techniques measured KCNQ/M channel activity and neuronal action potentials. The expression of S1PR1, KCNQ/M, mitogen-activated protein kinase (MAPK), and cyclic AMP/protein kinase A (cAMP/PKA) signaling proteins was analyzed before and after inhibiting the S1P-S1PR1-KCNQ/M pathway via western blot and RT-qPCR.

Results: Through integrated transcriptomic analysis of ASD samples, we identified the upregulated gene S1PR1, which is associated with sphingolipid metabolism and linked to pain perception, and confirmed its role in the BTBR mouse model of ASD. This mechanism involves the regulation of KCNQ/M channels in DRG neurons. The enhanced activity of KCNQ/M channels and the decreased action potentials in small and medium DRG neurons were correlated with PAI in a BTBR mouse model of ASD. Inhibition of the S1P/S1PR1 pathway rescued baseline insensitivity to pain by suppressing KCNQ/M channels in DRG neurons, mediated through the MAPK and cAMP/PKA pathways. Investigating the modulation and underlying mechanisms of the non-opioid pathway involving S1PR1 will provide new insights into clinical targeted interventions for PAI in ASD.

Conclusions: S1PR1 may contribute to PAI in the PNS in ASD. The mechanism involves KCNQ/M channels and the MAPK and cAMP/PKA signaling pathways. Targeting S1PR1 in the PNS could offer novel therapeutic strategies for the intervention of pain dysesthesias in individuals with ASD.

Keywords: Autism spectrum disorder; BTBR model mice; KCNQ/M potassium channels; Pain insensitivity; Sphingosine-1-phosphate.


Conflict of interest statement

The authors declare no competing interests.

Figures

Fig. 1
Fig. 1
Overall workflow diagram for discovering and verifying the roles and mechanisms of PAI in ASD
Fig. 2
Fig. 2
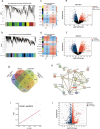
Identification of key gene modules from the GSE113834 and GSE64018 datasets via WGCNA. a and b Clustering tree diagram of the co-expression network module. The bottom of the graph represents different colored clustering gene modules. c and d Heatmap showing module-trait relationships. The cells represent the correlation and p value of the corresponding color module in the Con or ASD group. The redder the cell color, the stronger the positive correlation, and the bluer the stronger the negative correlation. e and f Volcano plot of DEGs. Red represents upregulated genes, and blue represents downregulated genes. g Identification of 18 common DEGs. WGCNA key gene modules from the GSE113834 and GSE64018 datasets. h PPI network of 18 genes. It consists of 18 nodes and 44 edges. i Correlation analysis between S1PR1 and pain. j Volcano plot showing the DEGs from the RNA-seq mice data 1 (Additional file 1: Table S1). The red color represents upregulated genes, and the blue color represents downregulated genes
Fig. 3
Fig. 3
BTBR mice exhibit reductions in baseline and inflammation-induced pain. a Von Frey test results for baseline mechanical sensitivity. n = 52 mice per group. b Hargreaves test for baseline heat sensitivity. n = 43 mice per group. c Alteration in the left hind paw on day 5 after CFA injection in mice. d Heat sensitivity after CFA injection in mice. n = 26 mice per group. e Mechanical sensitivity after CFA injection in mice. n = 26 mice per group. f Allodynia when von Frey thresholds are normalized to baseline thresholds for each mouse. n = 26 mice per group. g Alteration in the left hind paw after capsaicin injection. h Time course of capsaicin-induced spontaneous pain. n = 10 mice per group. i Alteration in the left hind paw after CCI. j Mechanical sensitivity after CCI. n = 10 mice per group. k Thermal sensitivity after CCI. n = 10 mice per group. All data are shown as bar diagrams, which reflect the arithmetic mean ± standard error of the mean. * p < 0.05, ** p < 0.01, *** p < 0.001, **** p < 0.0001, n.s. not significantly different
Fig. 4
Fig. 4
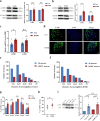
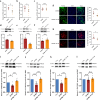
Characterization of S1PR1 and S1PR3 expression in mouse DRGs and spinal cord. a Representative western blotting results and quantification of the S1PR1 and S1PR3 protein in mouse spinal cord. n = 4 mice per group. b Representative western blotting results and quantification of the S1PR1 and S1PR3 protein in mouse DRGs; n = 7–9 mice per group. c Quantification of S1PR1 and S1PR3 mRNA expression in mouse DRGs; n = 7–10 mice per group. d Representative fluorescent images of S1PR1 (green) and nuclei (DAPI, blue) in DRG sections of Con and BTBR mice. Scale bars = 100 μm. e and f Distribution of S1PR1+ in neurons of different diameters in Con and BTBR mouse DRGs. n = 6 mice per group. g Comparison of the percentage of S1PR1+ neurons in the BTBR and Con group; n = 6 mice per group. h Total percentage of S1PR1+ neurons in the BTBR and Con group. n = 10–11 mice per group. i Representative western blotting results and quantification of the S1PR1 protein in mouse DRGs on day 5 after CFA injection in the left paw; n = 8 mice per group. All data are shown as bar diagrams, which reflect the arithmetic mean ± standard error of the mean. * p < 0.05, ** p < 0.01, *** p < 0.001, n.s. not significantly different
Fig. 5
Fig. 5
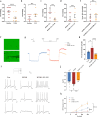
S1PR1 inhibitor modulates mechanical pain and quantitative analysis of DRG neurons in BTBR mice. a Effect of W146 on baseline mechanical pain in BTBR mice. n = 15 mice per group. b Effect of CAY on baseline mechanical pain in BTBR mice. n = 12 mice per group. c Effect of W146 on inflammatory pain in BTBR mice. n = 8–10 mice per group. d Effect of CAY on inflammatory pain in BTBR mice. n = 9 mice per group. e Normalized pain thresholds after W146 intervention in BTBR mice. n = 10 mice per group. f Morphological observation of DRG neurons in acutely isolated culture for 24 h. g Representative traces of an average current in a single neuron. h Quantitative analysis of the KCNQ tail current density. n = 6–7 cells per group. i Example traces of a single action potential in DRG neurons of mice, the excitation currents were 50 pA, 100 pA, and 150 pA. j RMP in DRG neurons of mice. n = 5–18 cells per group. k Action potential firing frequency in DRG neurons of mice. n = 5–8 cells per group. All data are shown in bar and line diagrams, which reflect the arithmetic mean ± standard error of the mean. * p < 0.05, ** p < 0.01, *** p < 0.001, **** p < 0.0001, n.s. not significantly different
Fig. 6
Fig. 6
Increased expression of KCNQ2 and KCNQ5 neurons in DRG of BTBR mice. ac Quantification of KCNQ2, KCNQ5, and KCNQ3 mRNA; n = 8–11 mice per group. df Representative western blotting results and quantification of the KCNQ2, KCNQ3, and KCNQ5 proteins. n = 8 mice per group. g and h Comparison of the percentage of KCNQ2+ and KCNQ5+ neurons in the BTBR and Con group. n = 8–14 mice per group. i and j Representative images of KCNQ2 and KCNQ5 immunofluorescence in mice DRGs. Scale bars = 100 μm. k and l Distribution of KCNQ2+ and KCNQ5+ neurons of different diameters in the Con and BTBR group. n = 5 mice per group. m XE-991 induced nociceptive behavior in BTBR mice. n = 6 mice per group. All data are shown in bar diagrams, which reflect the arithmetic mean ± standard error of the mean. * p < 0.05, ** p < 0.01, *** p < 0.001, **** p < 0.0001, n.s. not significantly different
Fig. 7
Fig. 7
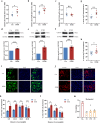
M channel and abnormal MAPK cAMP/PKA signaling pathways rescued by inhibition of S1PR1 in mice DRGs. ac Quantification of KCNQ2, KCNQ3, and KCNQ5 mRNA levels after the W146 intervention. n = 6–12 mice per group. df Representative western blotting results and quantification of the KCNQ2, KCNQ3, and KCNQ5 proteins after W146 intervention. n = 8 mice per group. g and h Representative images of KCNQ2 and KCNQ5 immunofluorescence in mice DRGs. Scale bars = 100 μm. Comparison of the percentage of KCNQ2+ neurons in the BTBR + W146 and BTBR group; n = 6–9 mice per group. il Representative western blotting results and quantification of P-ERK/ERK, P-P38/P38, P-PKA/PKA, and P-PKC/PKC proteins. n = 8 mice per group. All data are shown in bar diagrams, which reflect the arithmetic mean ± standard error of the mean. * p < 0.05, ** p < 0.01, *** p < 0.001, n.s. not significantly different
Fig. 8
Fig. 8
S1P/S1PR1 signaling is a critical factor in PAI in BTBR mice. a and b Mechanical and thermal sensitivity after SK I II intervention in the BTBR group. n = 8–14 mice per group. c Mechanical sensitivity after SK I II intervention in the BTBR + CFA group. n = 8 mice per group. d Volcano map showing differentially expressed genes. Red represents upregulated genes, and blue represents downregulated genes. e Effect of SK I II on S1PR1 protein expression in BTBR mice, representative western blotting results, and quantification of the S1PR1 protein. n = 8 mice per group. f S1P induced nociceptive behavior in Con mice. n = 8 mice per group. All data are shown as bar diagrams, which reflect the arithmetic mean ± standard error of the mean. ** p < 0.01, *** p < 0.001

Similar articles

References

    1. Orefice LL, Mosko JR, Morency DT, Wells MF, Tasnim A, Mozeika SM, et al. Targeting peripheral somatosensory neurons to improve tactile-related phenotypes in ASD models. Cell. 2019;178(4):867-86.e24. - PMC - PubMed
    1. First MB, Yousif LH, Clarke DE, Wang PS, Gogtay N, Appelbaum PS. DSM-5-TR: overview of what's new and what's changed. World Psychiatry. 2022;21(2):218–9. - PMC - PubMed
    1. Marco EJ, Hinkley LB, Hill SS, Nagarajan SS. Sensory processing in autism: a review of neurophysiologic findings. Pediatr Res. 2011;69(5 Pt 2):48R-54R. - PMC - PubMed
    1. Robertson CE, Baron-Cohen S. Sensory perception in autism. Nat Rev Neurosci. 2017;18(11):671–84. - PubMed
    1. Balasco L, Provenzano G, Bozzi Y. Sensory abnormalities in autism spectrum disorders: a focus on the tactile domain, from genetic mouse models to the clinic. Front Psychiatry. 2020;10:1016. - PMC - PubMed

Publication types

Substances