. 2024 Nov 4;10(1):126.
doi: 10.1038/s41540-024-00454-1.

Multiscale, mechanistic model of Rheumatoid Arthritis to enable decision making in late stage drug development

Affiliations

Multiscale, mechanistic model of Rheumatoid Arthritis to enable decision making in late stage drug development

Dinesh Bedathuru et al. NPJ Syst Biol Appl. .

Abstract

Rheumatoid Arthritis (RA) is a chronic autoimmune inflammatory disease that affects about 0.1% to 2% of the population worldwide. Despite the development of several novel therapies, there is only limited benefit for many patients. Thus, there is room for new approaches to improve response to therapy, including designing better trials e.g., by identifying subpopulations that can benefit from specific classes of therapy and enabling reverse translation by analyzing completed clinical trials. We have developed an open-source, mechanistic multi-scale model of RA, which captures the interactions of key immune cells and mediators in an inflamed joint. The model consists of a treatment-naive Virtual Population (Vpop) that responds appropriately (i.e. as reported in clinical trials) to standard-of-care treatment options-Methotrexate (MTX) and Adalimumab (ADA, anti-TNF-α) and an MTX inadequate responder sub-population that responds appropriately to Tocilizumab (TCZ, anti-IL-6R) therapy. The clinical read-outs of interest are the American College of Rheumatology score (ACR score) and Disease Activity Score (DAS28-CRP), which is modeled to be dependent on the physiological variables in the model. Further, we have validated the Vpop by predicting the therapy response of TCZ on ADA Non-responders. This paper aims to share our approach, equations, and code to enable community evaluation and greater adoption of mechanistic models in drug development for autoimmune diseases.


Conflict of interest statement

DB, RM, MC, TR, PP and RK all declare that they have no competing financial or non-financial interests.

Figures

Fig. 1
Fig. 1. Model compartments and components.
The synovial compartment is the site of the inflammation with several immune cells, mediators, and structural cells present. The cells secrete multiple pro and anti-inflammatory cytokines, chemokines, and growth factors as shown in the figure (Macrophages as an exemplar). All the cells in the synovium undergo proliferation and apoptosis in the synovial compartment. Immune cells can also migrate into the synovium from the serum while FLS does not. The serum compartment is the source of immune cells and therapeutics in synovium. The life cycle and regulation of one representative cell type in the model is shown here with regulators of proliferation, migration, apoptosis, and cytokine secretion. The life cycle of the other cells in the model and their regulators shown in Fig. 7.
Fig. 2
Fig. 2. The workflow to go from model equations to a RA Vpop.
Once the equations are set up, based on a survey of literature, some cell life cycle and cytokine clearance rates have been fixed. Other parameters are estimated to match dynamic steady-state values of cells reported. Once a Reference Virtual Patient at steady state with physiologically reasonable parameters has been developed, a subset of parameters is varied to create a Virtual Cohort of plausible VPs. Based on their response to therapy, a Vpop that responds appropriately to therapies of interest is selected from the Virtual Cohort.
Fig. 3
Fig. 3. Distribution of cell densities and clinical scores at baseline in the Vpop.
A Comparison of baseline distributions of the synovial cell densities of the Vpop with the ranges from public literature. The histogram shows the distribution of cell densities in the Vpop while the red line above indicates the range of cell densities of different cell types obtained from literature. B and C Comparison of DAS28-CRP histogram of the Vpop at baseline with the reported mean and standard deviation from the clinical trials for ADA (B) and TCZ (C) clinical trials. The red and black bars denote the values reported in the trials and the simulated Vpop outcome, respectively.
Fig. 4
Fig. 4. The Vpop and the order in which MTX, ADA and TCZ were simulated.
Initially all comers were administered MTX and ADA monotherapy and the VPop was calibrated to be consistent with both. Then, MTX IRs were administered TCZ and the subset of MTX IRs were also consistent with TCZ monotherapy. The VPop was validated against Emery P. et al. which administered TCZ to MTX & ADA IRs and without any further adjustment, was able to fit the data. The smooth lines of the figure show the trials used to calibrate the VPop and the dotted lines were validation where no further edits were made and the fit of the Vpop to the trial was examined. The definition of IR was not always explicit in the papers. When this definition was not mentioned, we defined IR as stated in the figure.
Fig. 5
Fig. 5. The calibrated response of the Vpop to MTX, ADA and TCZ.
The calibrated response of the Vpop to MTX and ADA (A) MTX (Week 12), (B) ADA (Week 24 for ACR and Week 26 for DAS28-CRP) and (C) TCZ (Week 24), showing a good match to the trial data in terms of reported DAS and ACR scores. Simulation conditions are taken from published clinical trials protocols as reported in the Methods. ‘Data’ refers to the clinical trial outcomes after placebo correction. TCZ clinical trial was run on MTX inadequate responder population, hence the Vpop is calibrated such that its MTX IR subpopulation (ACR < 50% and DAS28-CRP > 3.2 post therapy) matches the clinical trial outcome.
Fig. 6
Fig. 6. Prediction of ACR categories and DAS28-CRP scores on TCZ therapy at week 24 for a dosing regimen of 8 mg/kg at Q4W, on a subpopulation which is ADA and MTX IR.
The results were validated against a clinical trial of patients with similar characteristics i.e. with ADA and MTX IR patients. The fractions of patients which are ACR 50, ACR 70 and DAS28-CRP < 2.6 is within 5% of reported values.
Fig. 7
Fig. 7. The life cycle and regulation of different cells and cytokines included in the model.
The life cycle of each cell type is regulated by three processes - Proliferation, Migration and Apoptosis while it can contribute to secretion of one or more cytokines, chemokines or growth factors. Each of these processes can in turn be regulated by positive and negative regulators which increase or decrease the rates of these processes respectively. Here, the impact of positive regulators is denoted by green lines leading into the respective process while the impact of negative regulators is denoted by red lines. Note that there is no migration of FLS represented in the model; being a structural cell, it is not assumed to migrate via the blood into the synovium (in an analogous manner to the migration of the other cell types in the model). A to H represent FLS, Macrophages, Th1, Th17, Treg, CTLs, B Cells and Plasma cells and Endothelial cells respectively.
Fig. 8
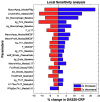
Fig. 8. Local sensitivity analysis of a representative Virtual patient from the Vpop, showing the top 20 most sensitive parameters in this patient.
The figure shows the percent change in DAS28-CRP score observed when introducing 2x variability to the parameter values of the virtual patient with the blue bars representing the outcomes of a 2x increase and the red bars representing the outcomes of a 2x decrease in the value of the parameter. E.g., on increasing the parameter MacroApop_MaxbyIFng from its baseline value by 2x, there is a 25% increase in the DAS28-CRP score while a 2x reduction in the same parameter leads to an 8% reduction in the DAS28-CRP score.
Fig. 9
Fig. 9. Global sensitivity analysis of the model showing the top 20 most sensitive parameters, showing the total order and first order sensitivities of these parameters.
The total order (represented by the blue bars) indicates the contribution of a particular parameter to total variance in the outcome; including its impact due to joint parameter variations while the first order sensitivity (represented by the red bars) indicates sensitivity to the particular parameter alone. E.g., we can see that kg_FLS_Baseline contributes maximally to the total variation seen in the DAS-28CRP score, both directly and through its interactions with other parameters.
Fig. 10
Fig. 10. The process of creation and calibration of a Vpop from a virtual cohort.
Flow chart depicting the process of creation of a virtual cohort and its calibration to multiple therapies to generate a Virtual population.
Fig. 11
Fig. 11. Distribution of DAS-28 score in the Vpop.
The DAS28-CRP score distribution in the Vpop (A) at baseline, (B) post MTX, (C) post Adalimumab and (D) post Tocilizumab therapies. The red dot indicates the mean while the red line indicates standard deviation. The figures show the distribution of DAS28-CRP scores before and after each therapy. The average baseline DAS28-CRP scores were matched to the mean and standard deviation reported in clinical trials (See Supplementary Data 1). Post therapy DAS28-CRP scores indicate that there is a broad distribution of responses seen in the simulations; indicative of phenotypic diversity in the Vpop.
Fig. 12
Fig. 12. Distribution plots for the parameters varied to generate the Vpop.
A Distribution plots for the parameters varied to generate the Vpop (1-64) (B) Distribution plots for the parameters varied to generate the virtual population (65-129). The parameter distribution shows a broad range, indicating that there is sufficient phenotypic diversity in the Vpop. See Table 4 for the key to read these plots and the bounds for the distribution plot corresponding to each parameter.
Fig. 13
Fig. 13. Distribution plots for the baseline cell densities of the cells in the model.
Distribution plots for the Baseline Cell Densities in the Vpop for (A) FLS, (B) Endothelial cells, (C)Macrophages, (D) Th1,(E) Th17,(F) CTL, (G) Bcells, (H)Plasma cells and (I)Tregs respectively. The mean/ median values of these cell densities and their ranges are derived from literature (see Supplementary Data 1). The plots show that Vpop has a broad distribution of cell densities at baseline that spans the range determined from the literature. See Table 5 for the ranges for these distributions for cells.
Fig. 14
Fig. 14. Distribution plots for baseline cytokine concentrations in the Vpop for the cytokines in the model.
Distribution plots for the Baseline cytokine concentrations in the Vpop for (A)VEGF (B)RANTES (C) TGF-b (D) TNF-a (E) IL-23 (F) IL6 (G)MCP-1 (H) MIP-3a (I)IL-1b (J)GMCSF (K)IFN-g (L)IL-10 (M) IL-12 (N) IL-17 (O)BAFF (P)CAM (Q) AutoAb. The mean/ median values of these cytokine concentrations and their ranges are derived from literature (see Supplementary Data 1). The plots show that the Vpop has a broad distribution of concentrations at baseline that spans the range determined from the literature. See Table 6 for the ranges for these distributions for cytokines.

Similar articles

References

    1. Almutairi, K. A.-O. et al. The Prevalence of Rheumatoid Arthritis: A Systematic Review of Population-based Studies. J. Rheumatol.48, 669–676 (2021). (0315-162X (Print)). - PubMed
    1. Smolen, J. S. et al. Rheumatoid arthritis. Nat. Rev. Dis. Prim.4, 18001 (2018). - PubMed
    1. van Riel, P. L., The development of the disease activity score (DAS) and the disease activity score using 28 joint counts (DAS28). Clin Exp Rheumatol, 32: p. S-65–74. 2014) - PubMed
    1. Kay, J. & Upchurch, K. S. ACR/EULAR 2010 rheumatoid arthritis classification criteria. Rheumatology51, vi5–vi9 (2012). - PubMed
    1. Singh, J. A. et al. 2015 American College of Rheumatology Guideline for the Treatment of Rheumatoid Arthritis. Arthritis Care Res (Hoboken)68, 1–25 (2016). - PubMed

MeSH terms