. 2024 Nov 4;15(1):9534.
doi: 10.1038/s41467-024-53784-3.

Genome-guided isolation of the hyperthermophilic aerobe Fervidibacter sacchari reveals conserved polysaccharide metabolism in the Armatimonadota

Affiliations

Genome-guided isolation of the hyperthermophilic aerobe Fervidibacter sacchari reveals conserved polysaccharide metabolism in the Armatimonadota

Nancy O Nou et al. Nat Commun. .

Abstract

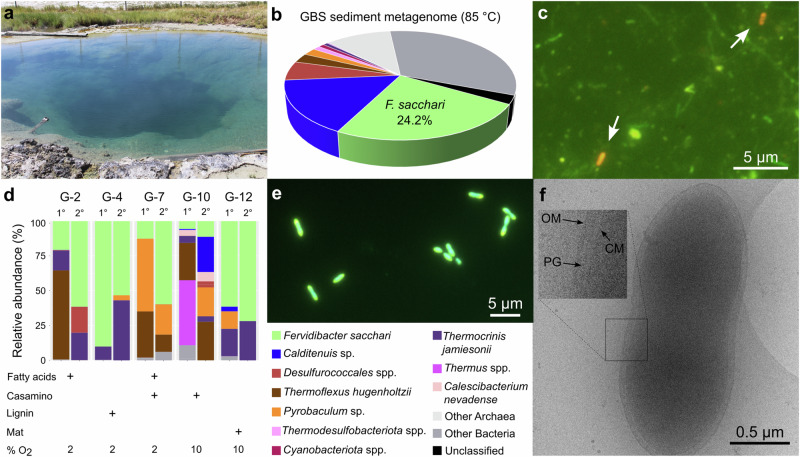
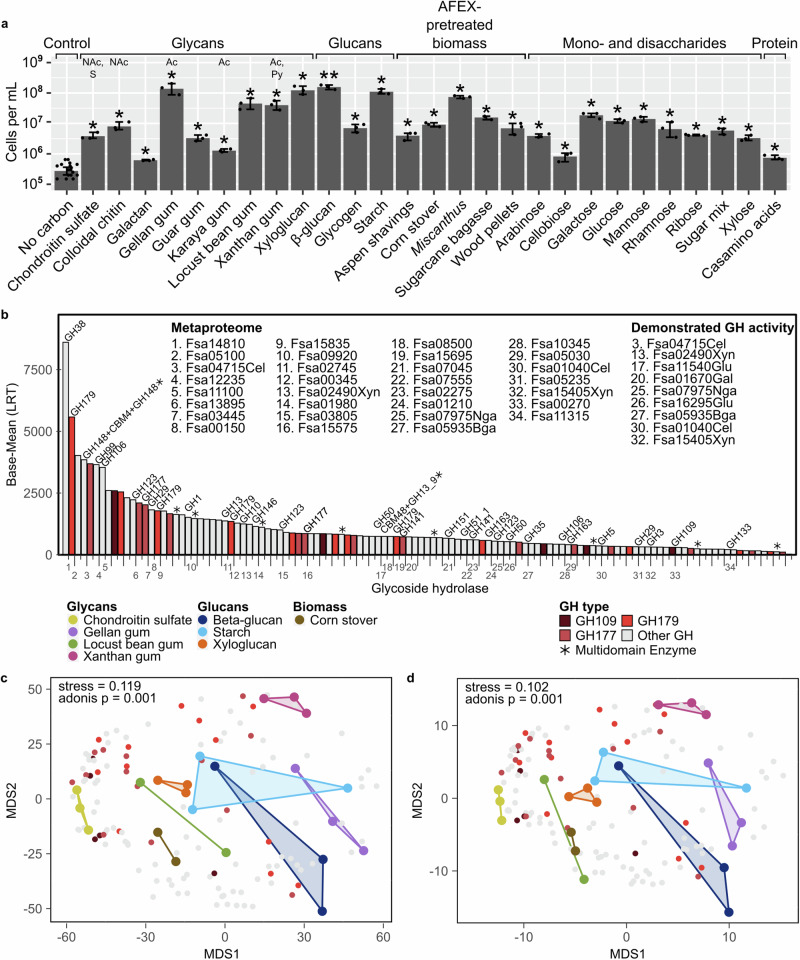
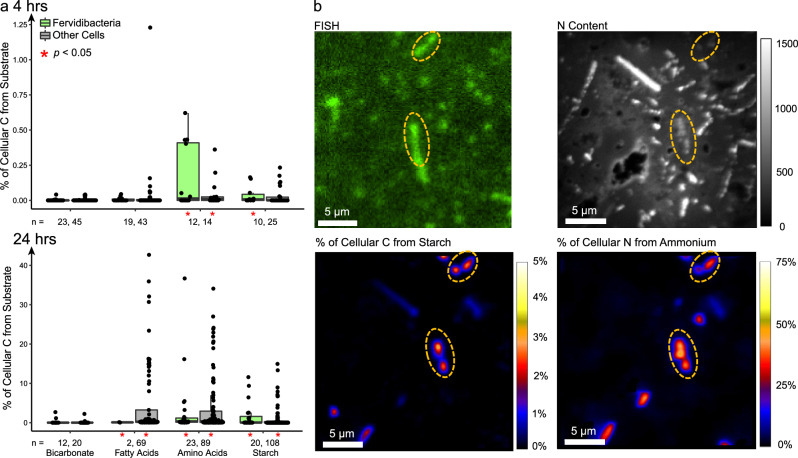
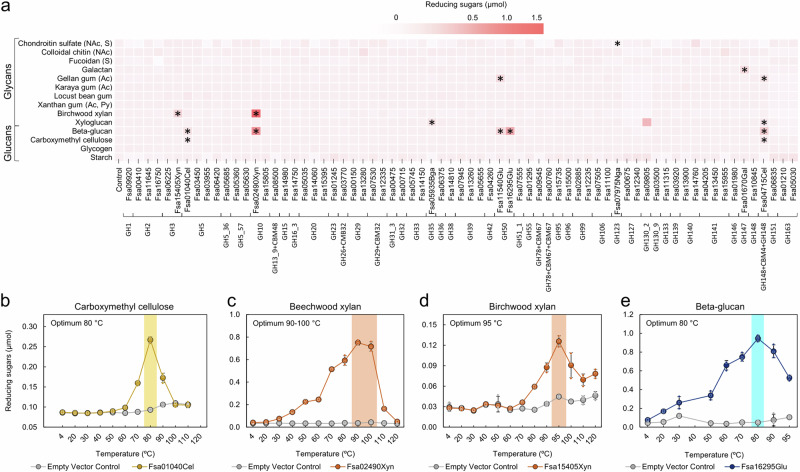
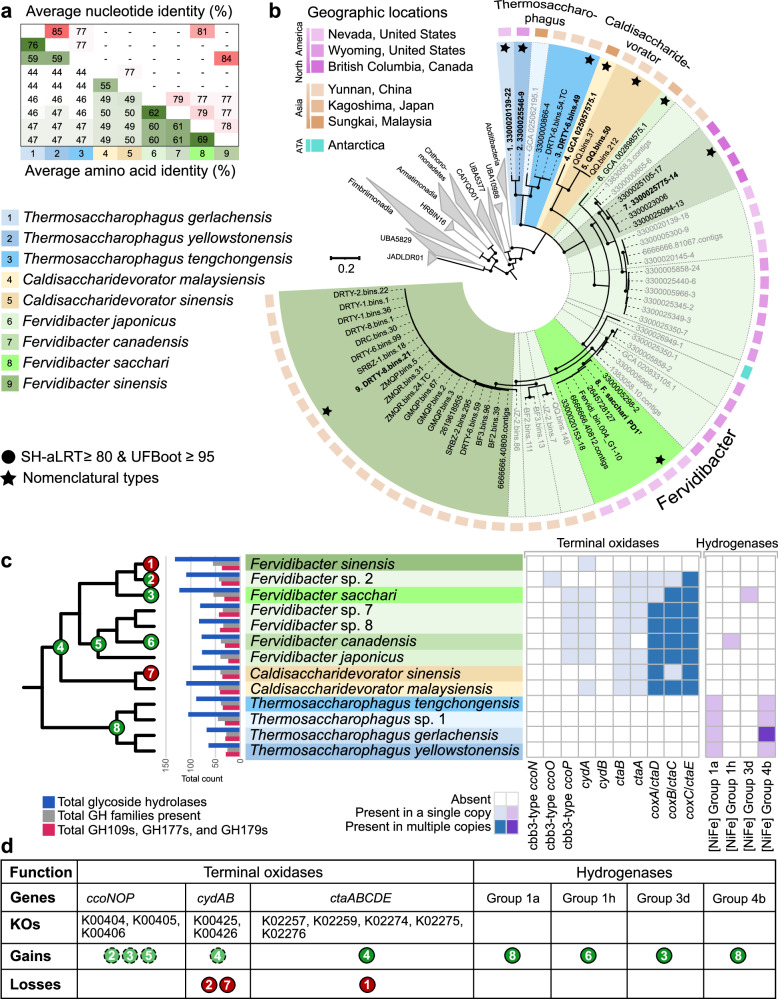
Few aerobic hyperthermophilic microorganisms degrade polysaccharides. Here, we describe the genome-enabled enrichment and optical tweezer-based isolation of an aerobic polysaccharide-degrading hyperthermophile, Fervidibacter sacchari, previously ascribed to candidate phylum Fervidibacteria. F. sacchari uses polysaccharides and monosaccharides for growth at 65-87.5 °C and expresses 191 carbohydrate-active enzymes (CAZymes) according to RNA-Seq and proteomics, including 31 with unusual glycoside hydrolase domains (GH109, GH177, GH179). Fluorescence in-situ hybridization and nanoscale secondary ion mass spectrometry confirmed rapid assimilation of 13C-starch in spring sediments. Purified GHs were optimally active at 80-100 °C on ten different polysaccharides. Finally, we propose reassigning Fervidibacteria as a class within phylum Armatimonadota, along with 18 other species, and show that a high number and diversity of CAZymes is a hallmark of the phylum, in both aerobic and anaerobic lineages. Our study establishes Fervidibacteria as hyperthermophilic polysaccharide degraders in terrestrial geothermal springs and suggests a broad role for Armatimonadota in polysaccharide catabolism.


Conflict of interest statement

The authors declare no competing interests.

Figures

Fig. 1
Fig. 1. In situ abundance, enrichment, and isolation of F. sacchari PD1T.
a Great Boiling Spring in Gerlach, NV. b Abundance of metagenomic reads from 85 °C sediments mapping to F. sacchari and other abundant prokaryotes. c Visualization of F. sacchari in 85 °C sediments by FISH using a Cy-3 label. The image is representative of >20 fields of view examined. d Enrichment of F. sacchari in lab cultures with biomass substrates, casamino acids, or volatile fatty acids; media composition and additional results are shown in Supplementary Figs. 1 and 2 (n = 1). e FISH of 6-FAM labeled F. sacchari in locust bean gum lab enrichment containing >99.5% F. sacchari. The image is representative of >20 fields of view examined. f cryo-electron tomogram of pre-divisional F. sacchari cells. The image is representative of ~20 cells examined. A single color legend for taxa is used for (b, d). Source data are provided as a Source Data file.
Fig. 2
Fig. 2. Growth of strain PD1T on carbohydrates and expression of CAZymes.
a F. sacchari growth on carbohydrates, lignocellulosic biomass, and casamino acids versus no-carbon source control (n = 3 experimental replicates; Welch’s one-tailed t-test, *p < 0.05; **p < 0.001). Bars represent the mean. Error bars represent 95% confidence intervals. Sugar mix, 0.005% m v-1 each of D-glucose/D-ribose/D-xylose; AFEX, ammonia fiber expansion. No corrections were applied for multiple statistical tests because each growth experiment had its own negative controls. b Rank-abundance plot of putative GHs based on mean mRNA abundance following growth on eight different polysaccharides (n = 3 experimental replicates). GHs present in the culture G-10 metaproteome, multi-domain GHs, and expressed GHs are highlighted. c NMDS based on F. sacchari RNA-Seq data with PD1T grown on eight different polysaccharides (n = 3 experimental replicates; global one-way ANOSIM p < 0.001). d NMDS based on only CAZymes from the same RNA-Seq data (n = 3 experimental replicates; global one-way ANOSIM p < 0.001). Source data for the figure panels and p values for panel a are provided as Source Data files.
Fig. 3
Fig. 3. 13C and 15N incorporation by F. sacchari in GBS sediments by FISH-nanoSIMS.
a Isotopic enrichments in F. sacchari identified by FISH (green bars) and other cells (gray bars). Each point reflects the percent of cellular 13C in a single cell following stable isotope probing with 13C-labeled substrates (n = number of cells within a single labeling experiment). Boxes represent 25th and 75th percentiles and central mark is the median. Vertical black lines show standard deviations. Asterisks show significance versus unlabeled controls (Wilcoxon rank-sum, *p < 0.05; **p < 0.001). b FISH showing F. sacchari cells (6-FAM, dotted circles), N content mapping (upper right), and nanoSIMS ion ratio images reflecting 13C assimilation (lower left) and 15N assimilation from 15N-ammonium (lower right) in representative F. sacchari cells and other cells (no 6-FAM label). Images shown are representative of 20 F. sacchari cells imaged after labeling with 13C- starch and 15N-ammonium for 24 h. Source data for both panels and p values for panel a are provided as a Source Data file.
Fig. 4
Fig. 4. F. sacchari PD1T GHs are active on diverse polysaccharides with high temperature optima.
a Activity of F. sacchari GHs expressed in E. coli and screened against 15 polysaccharides. Red color represents activity compared with negative controls containing pET21b without a GH gene (n = 1). Asterisks show activities confirmed after repeating in triplicate (n = 3 experimental replicates; unpaired student’s t test p < 0.05). No adjustments were made for multiple statistical tests because significance was confirmed in triplicate separately versus the empty-vector control. be Temperature optima for selected GHs, tested after one hour of incubation compared to negative controls (gray circles). Boxes represent 25th and 75th percentiles and central mark is the mean. Shading shows optimal enzyme activity (n = 3 experimental replicates; ANOVA with post-hoc Tukey’s HSD p < 0.05). Source data and p-values are provided as a Source Data file.
Fig. 5
Fig. 5. Genomic relatedness, phylogeny, and evolution of polysaccharide catabolism in the Fervidibacteria.
a Average nucleotide identity (ANI) and average amino acid identity (AAI) among nomenclatural types for each Fervidibacteria species. The same color scheme used in a is used for taxa indicated with numbers. A full ANI and AAI matrix for all medium- and high-quality genomes is shown in Supplementary Data 18. b A maximum-likelihood phylogeny based on the concatenated, partitioned sequence alignment of 120 conserved bacterial marker sequences (bac120), with appropriate evolutionary models for each partition. Filled circles represent supported nodes at the species level and above based on >90% support from 1000 pseudoreplicates. Species are indicated with different colors, with species within the same genus indicated in different shades of the same color. Taxon names in bold and indicated with a star are the proposed nomenclatural types. Gray sequence IDs represent MAGs below quality standards for the SeqCode. c Phylogeny of Fervidibacteria species showing glycoside hydrolase data for each species based on the mean abundance of each category in high-quality genomes assigned to each species. The presence of terminal oxidase subunits for aerobic respiration and hydrogenases are shown in the matrix, with gene gain/loss events numbered. d Key of terminal oxidases and hydrogenases gained and lost; dashed circles show partial gains. Phylogenetic trees generated with different marker gene sets are shown in Supplementary Fig. 15 and an expanded ancestral state reconstruction is shown in Supplementary Fig. 19. Source data are provided as a Source Data file.

Similar articles

References

    1. Seidi, F. et al. Crystalline polysaccharides: a review. Carbohydr. Polym.275, 118624 (2022). - PubMed
    1. Blumer-Schuette, S. E., Kataeva, I., Westpheling, J., Adams, M. W. & Kelly, R. M. Extremely thermophilic microorganisms for biomass conversion: status and prospects. Curr. Opin. Biotechnol.19, 210–217 (2008). - PubMed
    1. Brochier-Armanet, C., Talla, E. & Gribaldo, S. The multiple evolutionary histories of dioxygen reductases: implications for the origin and evolution of aerobic respiration. Mol. Biol. Evol.26, 285–297 (2009). - PubMed
    1. Murali, R., Gennis, R. B. & Hemp, J. Evolution of the cytochrome bd oxygen reductase superfamily and the function of CydAA’ in Archaea. ISME J.15, 3534–3548 (2021). - PMC - PubMed
    1. Murali, R., Hemp, J. & Gennis, R. B. Evolution of quinol oxidation within the heme‑copper oxidoreductase superfamily. Biochim. Biophys. Acta (BBA) - Bioenerg.1863, 148907 (2022). - PubMed