. 2024 Nov 2;15(1):9480.
doi: 10.1038/s41467-024-53791-4.

Live imaging of airway epithelium reveals that mucociliary clearance modulates SARS-CoV-2 spread

Affiliations

Live imaging of airway epithelium reveals that mucociliary clearance modulates SARS-CoV-2 spread

Mark E Becker et al. Nat Commun. .

Abstract

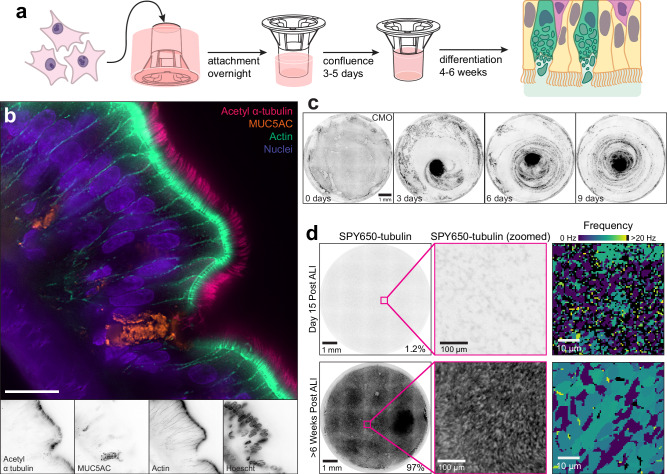
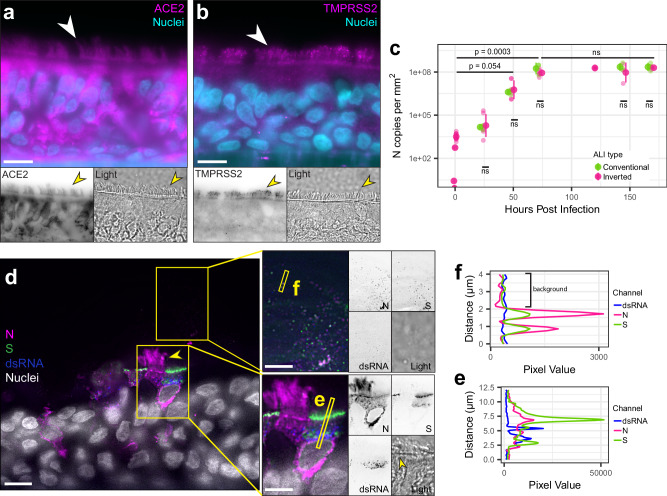
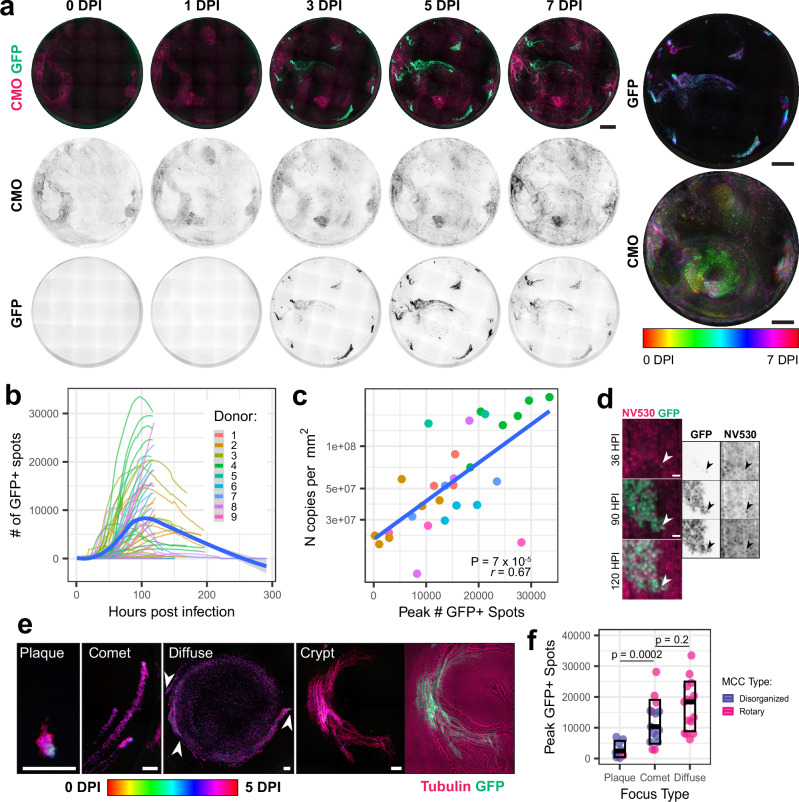
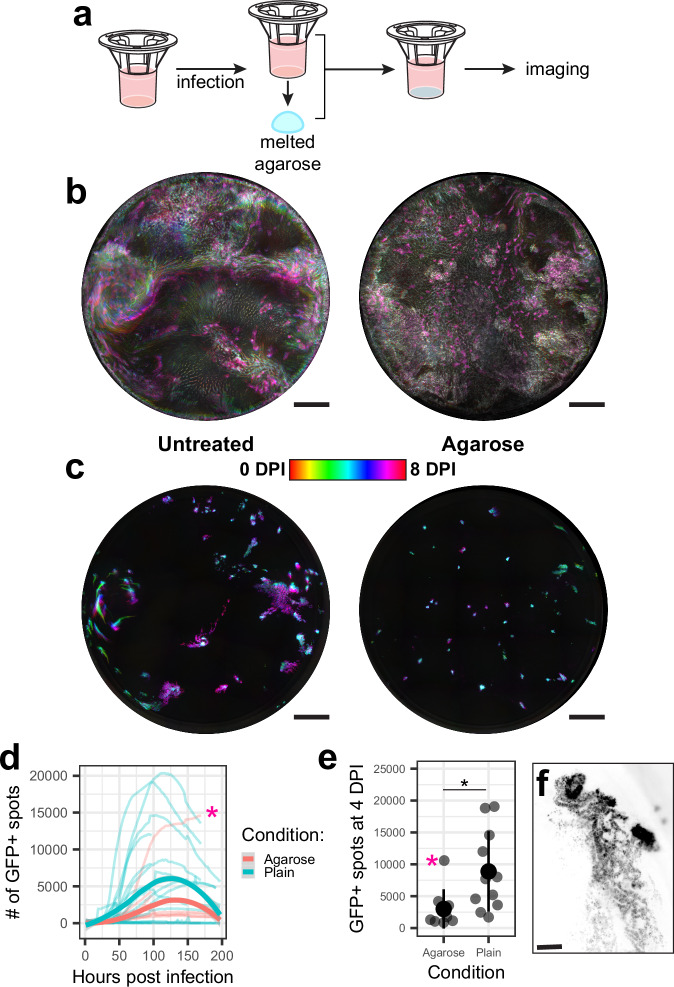
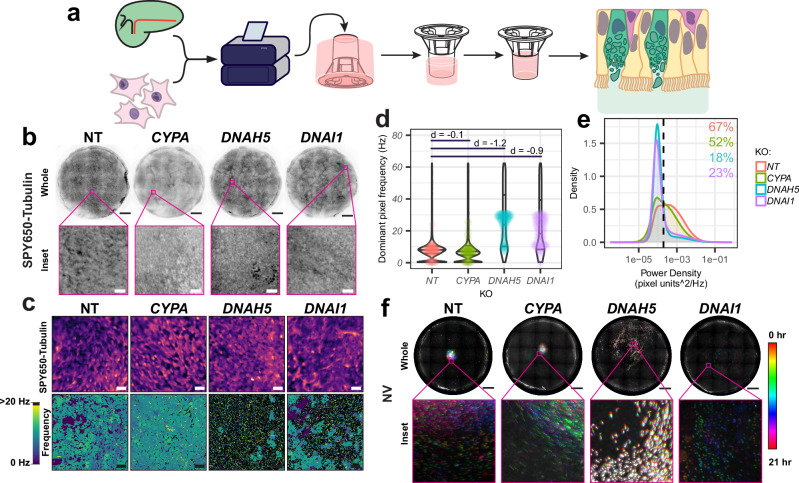
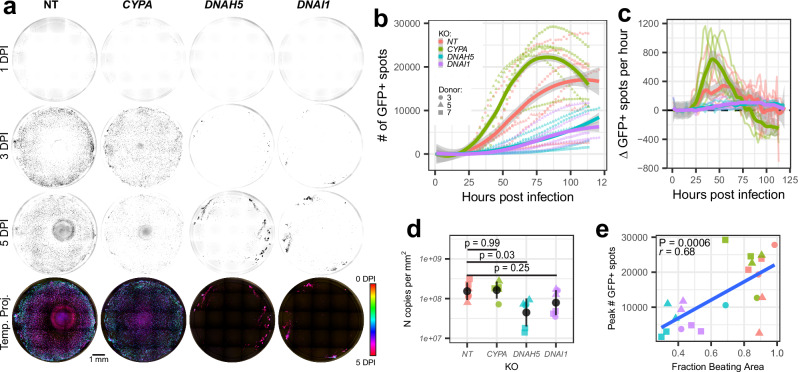
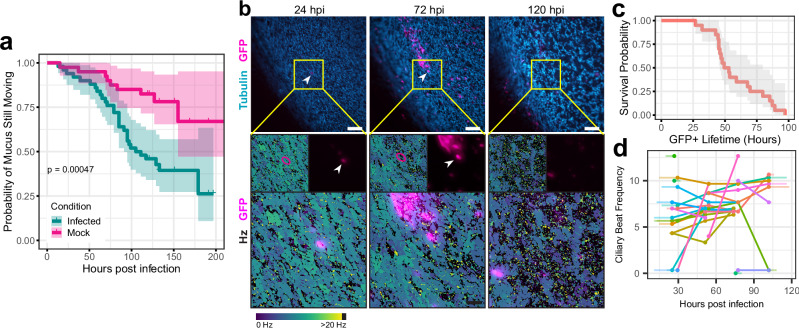
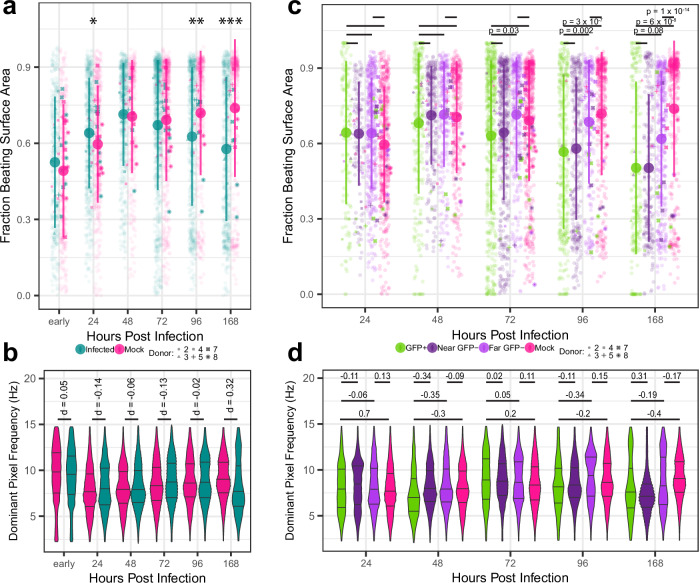
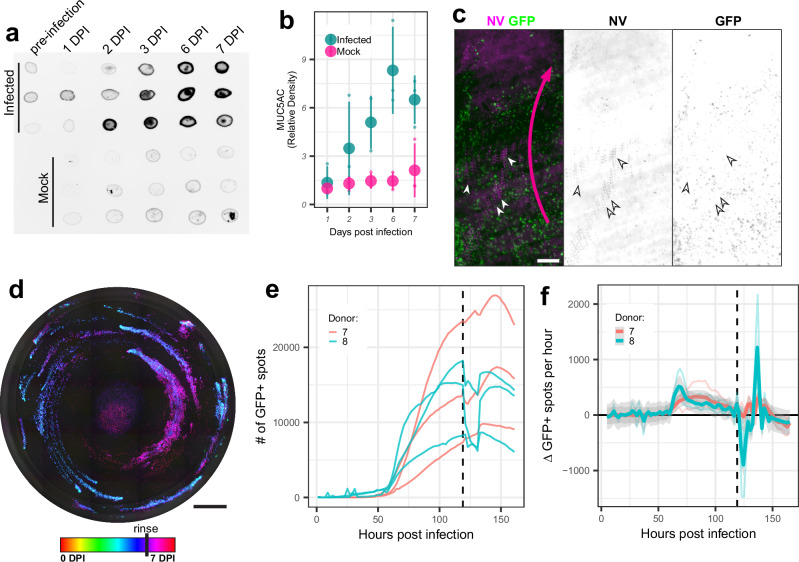
SARS-CoV-2 initiates infection in the conducting airways, where mucociliary clearance inhibits pathogen penetration. However, it is unclear how mucociliary clearance impacts SARS-CoV-2 spread after infection is established. To investigate viral spread at this site, we perform live imaging of SARS-CoV-2 infected differentiated primary human bronchial epithelium cultures for up to 12 days. Using a fluorescent reporter virus and markers for cilia and mucus, we longitudinally monitor mucus motion, ciliary motion, and infection. Infected cell numbers peak at 4 days post infection, forming characteristic foci that tracked mucus movement. Inhibition of MCC using physical and genetic perturbations limits foci. Later in infection, mucociliary clearance deteriorates. Increased mucus secretion accompanies ciliary motion defects, but mucociliary clearance and vectorial infection spread resume after mucus removal, suggesting that mucus secretion may mediate MCC deterioration. Our work shows that while MCC can facilitate SARS-CoV-2 spread after initial infection, subsequent MCC decreases inhibit spread, revealing a complex interplay between SARS-CoV-2 and MCC.


Conflict of interest statement

J.F.H. has received research support, paid to Northwestern University, from Gilead Sciences and is a paid consultant for Merck. All other authors declare no conflicts of interest.

Figures

Fig. 1
Fig. 1. Inverted ALI culture models support MCC.
a Schematic of inverted ALI culture. b Representative immunofluorescent image of a section of a differentiated ALI culture stained for: cilia (acetyl α-tubulin, bright pink), cell-cell junctions (actin (phalloidin), spring green) mucus (MUC5AC, amber), and nuclei (Hoescht, electric indigo). Below, single channels in inverted grayscale. Scale bar = 20 µm. Staining was repeated for cultures from 9 donors with comparable results. c Time-lapse of an inverted ALI culture incubated with CellMask Orange Plasma Membrane stain (CMO, inverted greyscale) demonstrating rotary mucociliary clearance over 9 days. Scale bar = 1 mm. d SPY650-tubulin signal in immature and mature ALI cultures. Left panels are images of whole cultures at different stages with SPY-650 tubulin in inverted grayscale, with zoomed field of view outlined in pink. Right panels are the frequency of SPY650-tubulin signal in high-speed videos of fields of view of the cultures shown in the left panels. Frequency is shown using the viridis colormap, with high-frequency noisy pixels in black. Scale bar for whole cultures is 1 mm; for insets 100 µm; for frequency 10 µm. Comparable results for differentiated cultures were observed across at least 5 experiments and 6 donors. Undifferentiated results were typical for 2 cultures.
Fig. 2
Fig. 2. Inverted ALI culture model supports SARS-CoV-2 infection.
Immunofluorescent images of sections of ALI cultures stained for SARS-CoV-2 entry factors (magenta) and nuclei (Hoescht, cyan). Bottom panels show entry factor staining in inverted grayscale and brightfield. Cilia marked with arrowheads. Scale bar = 20 µm. Cultures from 2 donors were stained with comparable results. a ACE2. b TMPRSS2. c Copies of nucleoprotein (N) RNA per square millimeter of culture area in mucus collected from inverted (pink) and conventional (green) ALI cultures immediately prior to or at several time points after infection. 1 HPI = post-infection rinse, as an approximation of input virus. Points represent the mean of technical duplicates (n = 3–6 ALI cultures across 3 donors per time point per condition). Error bars represent the mean of means ± standard deviation. Significance by two-sided Welch’s t-test. d Immunofluorescent images of a section of an ALI culture 72 h after SARS-CoV-2 infection stained for SARS-CoV-2 N (magenta), Spike (S, green), double-stranded RNA (dsRNA, blue), and nuclei (Hoescht, white). Results are typical from 3 independent experiments. Thresholding of viral antigens is altered in the right inset panels to highlight dim viral protein puncta among the cilia and mucus. Yellow arrowheads point to cilia. Rightmost panels show single channels in inverted grayscale. Skinny yellow rectangles surround the lines profiled in (e and f). Scale bar = 10 µm in large image and 5 µm in insets. e, f Line profile pixel intensities of cellular (e) and mucus (f) viral antigen (magenta N, green S) and dsRNA (blue) staining. Source data for all plots are provided as a Source Data file.
Fig. 3
Fig. 3. Spatiotemporal dynamics of SARS-CoV-2 spread in inverted ALI cultures.
ALI cultures from 9 donors were infected with icSARS-CoV-2-eGFP (green) in the presence of the indicated stains and imaged using a 4× air lens every other hour for 5–9 days. a Images of one representative culture (from a total of 60 infected cultures) stained with CellMask Orange Plasma Membrane dye (CMO, bright pink) and infected with icSARS-CoV-2/eGFP (spring green) are shown over 7 days of infection. Temporal color code projections of this culture are shown on the right. Scale bar = 1 mm. b Graph of GFP+ spots over time in SARS-CoV-2 infected ALI cultures (n = 3–11 cultures for each of 9 donors; 60 cultures total). The bold blue line is a Loess-smoothed trend with standard error in gray. Points are colored by the donor. c Scatterplot of peak GFP+ spots versus N RNA concentration per square millimeter of culture area at 5 days post-infection (mean of technical duplicate) from infections of ALI cultures from 8 donors (n ≥ 3 replicates per donor; 29 cultures total). Pearson’s correlation coefficient r = 0.67, p-value = 7 × 10-5. d Representative time-lapse images of a comet-shaped focus of infection, with SARS-CoV-2-eGFP in spring green & NucView 530 in bright pink. The white arrowhead indicates the first observed infected cell. Scale bar = 10 µm. Result is typical of 5 independent experiments. e Representative images of foci of various morphology. Scale bar = 100 µm. The first four images are temporal color code projections from 0 to 5 days post-infection; the image to the far right shows the crypt focus at a single time point with icSARS-CoV-2/eGFP in green and SPY650-tubulin in bright pink. Arrowheads mark comet heads which initiated the diffuse focus. Comparable results were observed in 15/15 independent experiments. f Peak GFP+ spots in each culture. N = 38 infected cultures from 9 donors, separated by focus morphology type. Points are colored by the MCC pattern of the culture. Black boxplots show the median and interquartile range.*p = 0.0006 by two-sided Wilcoxon rank sum test. Source data for all plots are provided as a Source Data file.
Fig. 4
Fig. 4. Agarose overlay restricts mucus flow and SARS-CoV-2 spread.
a Schematic of agarose overlay experimental design. b Temporal color code projection of CMO signal, and c SARS-CoV-2-eGFP signal in representative cultures with (right) and without (left) agarose overlay. Experiments were performed three times with comparable results. Scale bar = 1 mm. Color scale is the same for (b and c). d The number of GFP+ spots in each culture at each timepoint post-infection. Agarose overlay cultures are in red, and no overlay cultures are in blue (n ≥ 3 ALI cultures per donor per condition for 3 donors). The pink asterisk marks an outlier with infected crypts. Bold lines are Loess-smoothed trends with standard error in gray. e The number of GFP+ spots at 4 days post-infection for each culture shown in (d). The pink asterisk marks the same outlier. *p = 0.007 by two-sided Wilcoxon rank sum test. Mean ± standard deviation is shown by the bold points and lines. N = 10 ALI cultures from multiple donors per condition. f Inverted greyscale image of the GFP channel at 3 days post-infection of an infected crypt in the agarose overlay culture indicated with a pink asterisk in (d and e). Crypt infection was not typical in these experiments. Scale bar = 100 µm. Source data for all plots are provided as a Source Data file.
Fig. 5
Fig. 5. Genetic perturbation of ciliary motion.
a Schematic for the production of gene knockout in inverted ALI cultures. b Images of SPY650-tubulin signal (inverted greyscale) from representative KO cultures. Top panels are whole cultures (scale bar = 1 mm). Bottom panels are insets marked with pink in the whole culture images (scale bar = 50 µm). c Single frames of representative denoised SPY650-tubulin videos in knockout ALI cultures (top, magma colormap). The dominant beat frequency in Hz of each pixel of the same movies (bottom) with beating multiciliated cells visible as midtone gray patches. Scale bar = 20 µm. b, c Representative images are derived from the same 4 cultures. Results were typical across 2 experiments. d Plots of the distribution of beat in SPY650-tubulin movies of knockout ALI cultures (n = 5-6 cultures per KO, 3 donors). Bee swarms of median beat frequency in each FOV are overlaid on violin plots of pixel beat frequency. 0.3–0.6 mm2 per culture (~1–2% of total culture area) was surveyed per culture. Cohen’s d effect sizes on aggregate pixel distribution reported. e The distribution of power density in pixels from NT and each knockout. Dashed line is the 85th percentile of power density in frame-shuffled videos, and numbers in the top-right are the percentile of pixels falling above this threshold for NT and each knockout. d, e Points and lines are colored consistently by KO. f Temporal color code projections of 20-h time lapses of NucView 530 signal from representative ALI cultures during infection. Top panels are whole cultures (scale bar = 1 mm). Bottom panels are insets marked with pink (scale bar = 50 µm). Source data for all plots are provided as a Source Data file.
Fig. 6
Fig. 6. Ciliary motion KO inhibits SARS-CoV-2 spread.
a Snapshots of GFP signal (inverted grayscale) following SARS-CoV-2/eGFP infection of representative knockout cultures at the indicated time points. The bottom panels are temporal color code projections of the entire time course. Scale bar = 1 mm. Representative images are derived from the same 4 cultures. Results were typical across 2 experiments. b Number of GFP+ spots at each timepoint for each culture (n = 5–6 cultures per KO, 3 donors). Bold lines are Loess-smoothed trends with standard error in gray. c First derivative of splines fitted to GFP+ spots count at each frame of videos summarized in (b). Spar = 0.1 for spline fitting. Lines are colored by KO. Bold lines are Loess-smoothed trends with standard error in gray; span = 0.1. d Copies of nucleoprotein RNA per mm2 of culture area in mucus collected from all knockout ALI cultures at 5 days post-infection. N = 5–6 cultures from 3 donors (shapes) for each condition. Significance calculated by one-way ANOVA followed by post-hoc analysis using Tukey’s HSD (two-sided) where significant. Black dot and bars show mean ± standard error. e Scatterplot of peak GFP+ spots versus fraction beating area (power density > 2e-4) for all KO cultures. Pearson’s correlation coefficient r = 0.68, p-value = 0.0006. b, c, d, e Points and lines are colored consistently by KO. Source data for all plots are provided as a Source Data file.
Fig. 7
Fig. 7. Effects of SARS-CoV-2 infection on ciliary motion.
a Survival curves showing time to cessation of mucus motion in infected (blue) or mock (pink) cultures (n = 9 donors, ≥three ALI cultures per donor). p = 5 × 10-4 by log-rank. The translucent areas show 90% confidence intervals. b Live imaging snapshots of an infected cell identified at 24 hpi & followed to 72 hpi. Tubulin and SARS-CoV-2/eGFP are visualized in blue and bright pink, respectively (top). Scale bar = 200 µm. Beat frequency in Hz of the central (FOV) is shown below in greyscale with infected cells overlaid in magenta (bottom). Scale bar = 50 µm. Arrowheads (top) or pink circles (bottom) identify the initial infected cell. c Survival curve of GFP+ lifetime of tracked infected cells in ALI cultures. n = 28 cells from 4 cultures of 3 donors. Red line is the fraction of tracked cells remaining GFP+ and in the epithelium over time. Gray area is 90% confidence interval. d Plot of ciliary beat frequency over the lifetimes of tracked cells in (c). Lines and points of a single color reflect a single cell. Bold points and lines mark and span ciliary beat frequency measurements. Transparent lines extend to the time of initial cell detection and time of loss of GFP signal in whole culture time lapses when such time was captured.
Fig. 8
Fig. 8. Effects of SARS-CoV-2 infection on ciliary motion on a whole-culture scale.
a The fraction of pixels plausibly reflecting ciliary motion (frequency between 15 and 2 Hz) in each FOV for mock-infected (pink) and SARS-CoV-2 infected (blue) cultures over time. 5 independent experiments were conducted with variable timing scheme and culture allocation; 58 cultures from 6 donors were used in total with an average of 30 FOVs per culture per timepoint. Each FOV is 0.0274 mm2. Translucent dots are FOVs; mean and standard deviation are shown opaque; opaque signs are per culture means. Significance by two-sided Wilcoxon rank sum test with Bonferroni post hoc correction. *p = 0.003. **p = 1.7 × 10-7. ***p < 2 × 1016. b Violin plots of beat frequency of each beating pixel for all FOV shown in (a). Vertical lines within each violin mark the median and interquartile range. Cohen’s d is shown for infected-mock comparisons at each time point. c The fraction of beating pixels in subsets of FOVs from mock and infected cultures (shown in aggregate in a) stratified and colored by proximity to GFP signal. Near GFP− pixels are from FOVs that contain GFP+ pixels and far GFP− pixels are from FOVs in infected cultures that do not contain any GFP+ pixels. 5 independent experiments were conducted with variable timing scheme and culture allocation; 58 cultures from 6 donors were used in total with an average of 30 FOVs per culture per timepoint. Each FOV is 0.0274 mm2. Translucent dots are FOVs; mean and standard deviation of FOV values are shown opaque; opaque signs are per culture means. Significance by two-sided Wilcoxon rank sum with Bonferroni post hoc correction. d Violin plots of beat frequency of beating pixels in mock and infected cultures, with those from infected cultures stratified and colored by proximity to GFP+ pixels. Vertical lines within each violin mark the median and interquartile range. Cohen’s d is shown for infected-mock comparisons at each time point. Source data are available on Dryad, 10.5061/dryad.7wm37pw0r.
Fig. 9
Fig. 9. Effects of SARS-CoV-2 infection on mucociliary clearance.
a MUC5AC dot blot on apical rinsates from infected and uninfected cultures over time. DPI = days post-infection. N = 1 culture from each of 3 donors per time per condition. b Quantification of MUC5AC signal in a. Infected cultures in blue and mock in pink. Error bars are mean ± standard deviation. N = 1 culture from each of 3 donors per time per condition. c Projected image showing apoptotic nuclei tracks (NucView 530, magenta) moving over a focus of infection (GFP, green) over the course of 0.8 s shortly after mucus rinses at 120 HPI. Right panels are inverted greyscale single channels. Field of view is at the edge of a larger circular focus underlying a mucus disc. Arrowheads point to moving NV puncta; curved pink arrow shows the direction of rotation of the larger mucus disc. Scale bar = 200 µm. Representative image from one experiment with 3 replicates for each of two donors. d Temporal color code projection of the GFP channel of a whole infected culture with a mucus rinse at 120 hpi (one representative image). Scale bar = 1 mm. Representative image from one experiment with 3 replicates for each of two donors. e GFP+ spots at each timepoint for 120 hpi rinsed cultures (n = 3 replicates for two donors). The vertical dashed line marks the time of rinse. Lines are individual cultures colored by the donor. f First derivative of splines fitted to GFP+ spots count at each frame of videos summarized in (e). Spar = 0.1 for spline fitting. Lines are colored by the donor. Loess fit line with span = 0.05 shown in bold; the gray outline is the standard error. Source data for the blot and all plots are provided as a Source Data file.

Update of

Similar articles

References

    1. Hou, Y. J. et al. SARS-CoV-2 Reverse Genetics Reveals A Variable Infection Gradient In The Respiratory Tract. Cell182, 429–446.e14 (2020). - PMC - PubMed
    1. Killingley, B. et al. Safety, tolerability and viral kinetics during SARS-CoV-2 human challenge in young adults. Nat. Med.28, 1031–1041 (2022). - PubMed
    1. Zhou, J. et al. Viral emissions into the air and environment after SARS-CoV-2 human challenge: a phase 1, open label, first-in-human study. Lancet Microbe10.1016/s2666-5247(23)00101-5 (2023). - PMC - PubMed
    1. Knowles, M. R. & Boucher, R. C. Mucus clearance as a primary innate defense mechanism for mammalian airways. J. Clin. Invest.109, 571–577 (2002). - PMC - PubMed
    1. Zhang, L., Peeples, M. E., Boucher, R. C., Collins, P. L. & Pickles, R. J. Respiratory syncytial virus infection of human airway epithelial cells is polarized, specific to ciliated cells, and without obvious cytopathology. J. Virol.76, 5654–5666 (2002). - PMC - PubMed