[Preprint]. 2024 Oct 25:2024.10.23.619883.
doi: 10.1101/2024.10.23.619883.

How the Structure of Signaling Regulation Evolves: Insights from an Evolutionary Model

Affiliations

How the Structure of Signaling Regulation Evolves: Insights from an Evolutionary Model

Danial Asgari et al. bioRxiv. .

Abstract

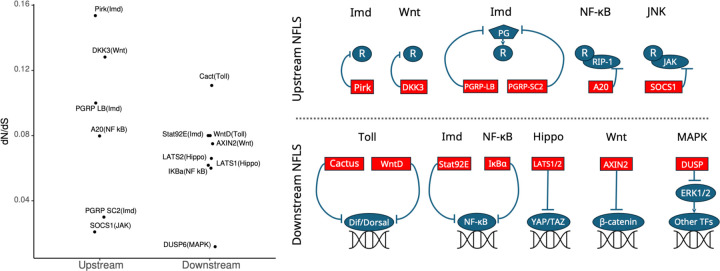
To remain responsive to environmental changes, signaling pathways attenuate their activity with negative feedback loops (NFLs), where proteins produced upon stimulation downregulate the response. NFLs function both upstream of signaling to reduce input and downstream to reduce output. Unlike upstream NFLs, downstream NFLs directly regulate gene expression without the involvement of intermediate proteins. Thus, we hypothesized that downstream NFLs evolve under more stringent selection than upstream NFLs. Indeed, genes encoding downstream NFLs exhibit a slower evolutionary rate than upstream genes. Such differences in selective pressures could result in the robust evolution of downstream NFLs while making the evolution of upstream NFLs more sensitive to changes in signaling proteins and stimuli. Here, we test these assumptions within the context of immune signaling. Our minimal model of immune signaling predicts robust evolution of downstream NFLs to changes in model parameters. This is consistent with their critical role in regulating signaling and the conservative rate of evolution. Furthermore, we show that the number of signaling steps needed to activate a downstream NFL is influenced by the cost of signaling. Our model predicts that upstream NFLs are more likely to evolve under a shorter half-life of signaling proteins, absence of host-pathogen co-evolution, and a high infection rate. Although it has been proposed that NFLs evolve to reduce the cost of signaling, we show that a high cost does not necessarily predict the evolution of upstream NFLs. The insights from our model have broad implications for understanding the evolution of regulatory mechanisms across signaling pathways.

Keywords: Negative feedback; downstream regulation; multi-level regulation; upstream regulation.


Figures

Fig.1.
Fig.1.. The distribution of dNdS values for genes encoding proteins involved in upstream and downstream NFLs across various signaling networks.
The rate of change for genes encoding upstream and downstream NFLs is shown on the left. The biological pathway is indicated in the parenthesis. The function of Upstream and downstream NFLs within various signaling pathways is summarized on the right. The upstream NFLs interact with a receptor (R), while downstream NFLs interact with transcription factors that activate target genes. These interactions are either direct or indirect (e.g., with peptidoglycan shown as PG). Genes involved in Imd and Toll are from D. melanogaster and the rest are human genes. The data for human genes are from Liu et al. (2014) except for IKBα which is from Song et al. (2012). The data for D. melanogaster is from Sackton et al. (2007) except for Pirk which is from Han et al. (2013). The downstream genes generally have low dNdS values (all except for Cactus ≤ 0.08) and the variance amongst downstream genes (sd=0.028) is lower than upstream ones (sd=0.053).
Fig.2.
Fig.2.. The model of the immune signaling network, capturing the core elements shared across immune signaling pathways.
A host has five proteins: R (receptor), A (activator), I (immunity), U (upstream regulator), and D (downstream regulator). The host is exposed to a pathogen (P) with a probability θ, and the pathogen replicates at a rate π. The dashed arrows show potential interactions that can be formed during the evolution of the network. The arrows point from protein j to i and μi,j is the strength of the interaction. The three domains of each protein (receiver, neutral, and sender) are shown in the top right. The neutral domain does not participate in protein-protein interactions. For a detailed description of the model see Materials and Methods.
Fig.3.
Fig.3.. The evolution of immune signaling when the protein degradation rate is zero.
The Y-axis in the left panel shows the coefficient of interaction (μi,j) from −1 (complete inhibition) to +1 (complete activation). The interaction does not evolve when μ fluctuates around 0. The X-axis shows the generation time. The right panel shows the evolved signaling pathway after 20,000 generations. The color of the arrows in the right panel corresponds to the color of the plots in the left panel. The oscillating lines represent co-evolution between the host and the pathogen. The dashed arrows show the interactions that did not evolve. Here θ=1; thus, all individuals are infected. The initial condition (P0) for the pathogen, its replication rate (π), and mutation rate for the host (MH) and pathogen (MP) are shown in the right panel.
Fig.4.
Fig.4.. A high cost of immunity results in the evolution of two types of signaling networks with a downstream NFL.
Panel a shows whether the first signaling step (activation of A by R) evolves. The Y-axis shows the coefficient of interaction (μ) and the X-axis is the generation time. The plots in panel b (10 plots showing 10 replicate simulations) show the effect of D (red) and A (blue) on I. In two simulations, the activator (A) activates the immune response and the downstream regulator (D) acts as an NFL. These are annotated as A+. In six simulations the downstream regulator activates immunity (D+) and the activator protein (A) functions as an NFL. In two simulations the receptor does not activate the activator protein (grey trajectories in panel a); thus, signaling is not transmitted to the host proteins. These two simulations are marked with grey crosses in panel b. The two types of evolved signaling networks are shown in panels c1 and c2, where the numbers indicate the number of steps needed to downregulate I.
Fig.5.
Fig.5.. The evolution of the upstream NFL is sensitive to changes in the parameter values.
In panel a, non-zero degradation rate for the host protein (ϕ=0.15) and the absence of co-evolution between the receptor and pathogen (μR,P=1) give rise to the evolution of the upstream NFL in most simulations along with the downstream NFL. In panel b, a more robust evolution of the upstream NFL is observed when amongst the host proteins only the receptor degradation rate is set to 0 (ϕiR=0.15 and ϕR=0). This condition is shown in green and is repeated in panels c and d. Panel c shows the combined effect of infection rate (θ) and population size (n). When the infection rate is less than 1 (θ=0.7), the upstream NFL does not evolve in some simulations. Increasing the population size (n=5,000) ensures the evolution of the upstream NFL even when θ=0.7. In panels a-c we set α=2 and β=1. Panel d shows the effect of the cost of the immune response under the conditions that favor the evolution of the upstream NFL. When the cost of immunity is high (β=2) the upstream NFL does not evolve in some simulation. Instead, the effect of A on I is reduced to attenuate the immune response. In all simulations presented here, D evolves as an NFL.
Fig. 6.
Fig. 6.. The downstream regulator evolves under conservative evolution, whereas the upstream regulator is under weak selective pressure.
Panel a shows a typical rate of change for the neutral domain (ks) of all host proteins across simulations. Panel b shows the distribution of pooled ω values across three simulations for all proteins of the host. Panel c shows the evolution of downstream and upstream regulators. The rate of evolution (ω) is calculated every five generations and only when ks<0.5. The X-axis shows the instances of calculation ω through the evolution, and the Y-axis shows the rate of evolution for the two domains (rows) of D (left column) and U (right column). The trajectories show the average rate of evolution across 10 simulations. The shaded regions specify the standard deviation. Positive values on the Y-axis show positive selection, 0 indicates neutral evolution and negative values specify negative selection. The evolution of D and U are shown under three parameter regimes. Under one regime D evolves as an NFL (purple). Under the second regime, there is polymorphism in the choice of the downstream NFL (either A or D), which is shown by the yellow trajectories. The cyan trajectories specify the parameter regime under which both U and D evolve as NFLs.

Similar articles

References

    1. Aggarwal K., & Silverman N. (2008). Positive and negative regulation of the Drosophila immune response. BMB Reports, 41(4), 267–277. - PubMed
    1. Asgari D., Stewart A. J., & Meisel R. P. (2024). The role of uncertainty and negative feedback loops in the evolution of induced immune defenses. G3 (Bethesda, Md.), jkae182. - PMC - PubMed
    1. Asgari D., & Tate A. T. (2024). Positioning of negative feedback loops within immune signaling pathways influences host fitness through noise in AMP expression. In bioRxiv (p. 2024.02.22.581613). 10.1101/2024.02.22.581613 - DOI
    1. Beg A. A., Sha W. C., Bronson R. T., & Baltimore D. (1995). Constitutive NF-kappa B activation, enhanced granulopoiesis, and neonatal lethality in I kappa B alpha-deficient mice. Genes & Development, 9(22), 2736–2746. - PubMed
    1. Bergqvist S., Alverdi V., Mengel B., Hoamann A., Ghosh G., & Komives E. A. (2009). Kinetic enhancement of NF-kappaBxDNA dissociation by IkappaBalpha. Proceedings of the National Academy of Sciences of the United States of America, 106(46), 19328–19333. - PMC - PubMed

Publication types

LinkOut - more resources