. 2024 Oct 29;18(1):61.
doi: 10.1186/s13036-024-00457-w.

Integrative analysis of gene expression, protein abundance, and metabolomic profiling elucidates complex relationships in chronic hyperglycemia-induced changes in human aortic smooth muscle cells

Affiliations

Integrative analysis of gene expression, protein abundance, and metabolomic profiling elucidates complex relationships in chronic hyperglycemia-induced changes in human aortic smooth muscle cells

Smriti Bohara et al. J Biol Eng. .

Abstract

Type 2 diabetes mellitus (T2DM) is a major public health concern with significant cardiovascular complications (CVD). Despite extensive epidemiological data, the molecular mechanisms relating hyperglycemia to CVD remain incompletely understood. We here investigated the impact of chronic hyperglycemia on human aortic smooth muscle cells (HASMCs) cultured under varying glucose conditions in vitro, mimicking normal (5 mmol/L), pre-diabetic (10 mmol/L), and diabetic (20 mmol/L) conditions, respectively. Normal HASMC cultures served as baseline controls, and patient-derived T2DM-SMCs served as disease controls. Results showed significant increases in cellular proliferation, area, perimeter, and F-actin expression with increasing glucose concentration (p < 0.01), albeit not exceeding the levels in T2DM cells. Atomic force microscopy analysis revealed significant decreases in Young's moduli, membrane tether forces, membrane tension, and surface adhesion in SMCs at higher glucose levels (p < 0.001), with T2DM-SMCs being the lowest among all the cases (p < 0.001). T2DM-SMCs exhibited elevated levels of selected pro-inflammatory markers (e.g., ILs-6, 8, 23; MCP-1; M-CSF; MMPs-1, 2, 3) compared to glucose-treated SMCs (p < 0.01). Conversely, growth factors (e.g., VEGF-A, PDGF-AA, TGF-β1) were higher in SMCs exposed to high glucose levels but lower in T2DM-SMCs (p < 0.01). Pathway enrichment analysis showed significant increases in the expression of inflammatory cytokine-associated pathways, especially involving IL-10, IL-4 and IL-13 signaling in genes that are up-regulated by elevated glucose levels. Differentially regulated gene analysis showed that compared to SMCs receiving normal glucose, 513 genes were upregulated and 590 genes were downregulated in T2DM-SMCs; fewer genes were differentially expressed in SMCs receiving higher glucose levels. Finally, the altered levels in genes involved in ECM organization, elastic fiber synthesis and formation, laminin interactions, and ECM proteoglycans were identified. Growing literature suggests that phenotypic switching in SMCs lead to arterial wall remodeling (e.g., change in stiffness, calcific deposits formation), with direct implications in the onset of CVD complications. Our results suggest that chronic hyperglycemia is one such factor that leads to morphological, biomechanical, and functional alterations in vascular SMCs, potentially contributing to the pathogenesis of T2DM-associated arterial remodeling. The observed differences in gene expression patterns between in vitro hyperglycemic models and patient-derived T2DM-SMCs highlight the complexity of T2DM pathophysiology and underline the need for further studies.

Keywords: Biomechanics; Diabetes; Gene expression; Hyperglycemia; Pathway analysis; Transcriptomics; Vascular smooth muscle cells.


Conflict of interest statement

The authors declare no competing interests.

Figures
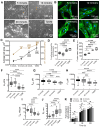
Fig. 1
Fig. 1
A. Representative phase-contrast images of adult human aortic SMCs cultured under varying glucose concentrations (5, 10, or 20 mmol/L), and T2DM SMCs. B. Representative confocal images of filamentous-actin (F-actin) and nuclei (blue) stained with Alexa Fluro 488-phalloidin and DAPI, respectively. C. Significant differences in average cell area and perimeter were noted between SMCs treated with various dosages of glucose and with T2DM SMCs. Data shown represents mean ± standard error in respective cases (n > 50 cells/condition). **** indicates p < 0.0001 vs. 5 mmol/L cultures; #### indicates p < 0.0001 vs. 10 mmol/L cultures; ++++ indicates p < 0.0001 vs. 20 mmol/L cultures. D. Quantitative analysis of area occupied by F-actin within SMCs exposed to various culture conditions. E. Quantitative analysis of fluorescence intensity of F-actin. Analysis of fluorescence intensity was done at the original magnification by measuring the mean gray value with Fiji ImageJ software. Data was pooled from n = 6 wells/ condition for each of these assays. Biomechanical characteristics such as elastic modulus (EY, F), forces of adhesion (Fad, G), membrane tether forces (FT, H), membrane tension (TM, I), and tether radius (RT, J) were quantified from the AFM data. EY data were calculated by applying Hertz model to force–indentation curves (n ≥ 100 cells/condition) obtained from cells. Fad and FT were measured by retraction of beaded-AFM probe from the cell surface. In plots D-J, the center line in the box plots denotes the median, and bound of box shows 25th to 75th percentiles, while upper and lower bounds of whiskers represent the maximum and minimum values, respectively. * indicates p < 0.05, ** indicates p < 0.01, *** indicates p < 0.001, and **** indicates p < 0.0001. K. Proliferation of human SCMs under various glucose conditions as well as that of T2DM-SMCs. * indicates p < 0.05 vs. initial cell seeding density, ## indicates p < 0.01 for control (5 mmol/L) vs. glucose treatment (10 mmol/L, 20 mmol/L; T2DM)
Fig. 2
Fig. 2
Heat maps of the levels of interleukins (A), cytokines & chemokines (B), growth factors (C), and MMPs/TIMPs (D) released in SMC cultures receiving various glucose concentrations and from T2DM cells over 21 days. Spent media was pooled from at least n = 6 wells/ condition and processed to measure the levels of these markers
Fig. 3
Fig. 3
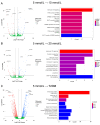
Volcano plots of differential gene expression patterns and enriched pathways in response to glucose concentration and diabetic conditions. (A) 10 mmol/L vs. 5 mmol/L glucose, (B) 20 mmol/L vs. 5 mmol/L glucose, and (C) T2DM Vs 5 mmol/L glucose. Cell pellets were pooled from n = 6 wells/ condition for RNA-seq analysis
Fig. 4
Fig. 4
Venn diagram indicating the overlap between differentially expression genes (DEG) in SMCs receiving various glucose concentrations (10 mmol/L and 20 mmol/L). RNA-seq data for each condition was compared to cells receiving 5 mmol/L glucose. T2DM cells were also shown for comparison. (A) Up-regulated differentially expressed genes; (B) down-regulated differentially expressed genes. Cell pellets were pooled from n = 6 wells/ condition for RNA-seq analysis
Fig. 5
Fig. 5
Correlation between ECM proteins and mRNA levels across various glucose conditions and T2DM patient samples for 448 genes. (A) 5 mmol/L: Spearman correlation coefficient of 0.438 (p = 1.67 × 10− 21). (B) 10 mmol/L: Spearman correlation coefficient of 0.453 (p = 4.11 × 10− 23). (C) 20 mmol/L: Spearman correlation coefficient of 0.439 (p = 1.53 × 10− 21). (D) T2DM: Spearman correlation coefficient of 0.533 (p = 7.55 × 10− 33). Cell pellets were pooled from n = 6 wells/ condition for RNA-seq and proteomic analysis
Fig. 6
Fig. 6
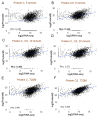
The correlation between mRNA expression levels and cytosol (C) / cytoskeletal (CS) protein levels for 2323 genes across different culture conditions. (A) 5 mmol/L glucose: Spearman correlation coefficient of 0.245 (p = 2.67 × 10− 33) for cytosol protein. (B) 5 mmol/L condition: Spearman correlation coefficient of 0.343 (p = 3.71 × 10− 65) for cytoskeleton protein. (C) 10 mmol/L: Spearman correlation coefficient of 0.363 (p = 2.61 × 10− 72) for both cytosol (C) and cytoskeleton (CS) protein. (D) 20 mmol/L: Spearman correlation coefficient of 0.371 (p = 7.58 × 10− 77) for both cytosol (C) and cytoskeleton (CS) protein. (E) T2DM: Spearman correlation coefficient of 0.461 (p = 1.19 × 10− 122) for cytosol protein. (F) T2DM patient samples: Spearman correlation coefficient of 0.606 (p = 7.57 × 10− 234) for cytoskeleton protein. Cell pellets were pooled from n = 6 wells/ condition for RNA-seq and proteomic analysis
Fig. 7
Fig. 7
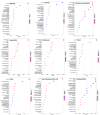
Nine enriched pathways from co-expression analysis associated with compounds involving L13a-mediated translational silencing of ceruloplasmin expression: aspartate, picolinate, adenosine-monophosphate, hypoxanthine, allothreonine, phenol, proline, taurocheno-desoxycholic acid, and phosphorylcholine. Cell pellets were pooled from n = 6 wells/ condition for metabolomic analysis
Fig. 8
Fig. 8
Seven enriched pathways from co-expression analysis associated with compounds involving Neutrophil degranulation: Malate, N-acetyltyrosine, glutathione reduced, Myristate, Histidine, undecenoic acid, and N-acetylserine. Cell pellets were pooled from n = 6 wells/ condition for metabolomic analysis

Similar articles

References

    1. Khan MAB, Hashim MJ, King JK, Govender RD, Mustafa H, Al Kaabi J. Epidemiology of type 2 diabetes - global burden of Disease and Forecasted trends. J Epidemiol Glob Health. 2020;10(1):107–11. 10.2991/jegh.k.191028.001. - PMC - PubMed
    1. De Rosa S, Arcidiacono B, Chiefari E, Brunetti A, Indolfi C, Foti DP. Type 2 diabetes Mellitus and Cardiovascular Disease: genetic and epigenetic links. Front Endocrinol (Lausanne). 2018;9:2. 10.3389/fendo.2018.00002. - PMC - PubMed
    1. Martín-Timón I, Sevillano-Collantes C, Segura-Galindo A, Del Cañizo-Gómez FJ. Type 2 diabetes and cardiovascular disease: have all risk factors the same strength? World J Diabetes. 2014;5(4):444–70. 10.4239/wjd.v5.i4.444. - PMC - PubMed
    1. Einarson TR, Acs A, Ludwig C, Panton UH. Prevalence of cardiovascular disease in type 2 diabetes: a systematic literature review of scientific evidence from across the world in 2007–2017. Cardiovasc Diabetol. 2018;17(1):83. 10.1186/s12933-018-0728-6. - PMC - PubMed
    1. Assar ME, Angulo J, Rodríguez-Mañas L. Diabetes and ageing-induced vascular inflammation. J Physiol. 2016;594(8):2125–46. 10.1113/JP270841. - PMC - PubMed

LinkOut - more resources