. 2024 Oct;28(20):e70186.
doi: 10.1111/jcmm.70186.

GOLM1 promotes prostate cancer progression via interaction with PSMD1 and enhancing AR-driven transcriptional activation

Affiliations

GOLM1 promotes prostate cancer progression via interaction with PSMD1 and enhancing AR-driven transcriptional activation

Guang Yan et al. J Cell Mol Med. 2024 Oct.

Abstract

Aberrant transcriptional activation of the androgen receptor (AR) is a predominant cause of prostate cancer (PCa), including both in the initial and androgen-independent stages. Our study highlights Golgi membrane protein 1 (GOLM1) as a key regulator of AR-driven transcriptional activity in PCa progression. Utilizing local clinical data and TCGA data, we have established a robust association between GOLM1 and AR target genes, and further demonstrated that GOLM1 can enhance the expression of AR target genes. We discovered that GOLM1 interacts with PSMD1, a component of the 19S regulatory complex in the 26S proteasome, using mass spectrometry and Co-IP analysis. It is well known that ubiquitin-proteasome plays a vital role in AR expression and transcriptional regulation. Our findings demonstrate that GOLM1 enhances ubiquitin proteasome activity by binding to PSMD1, thereby facilitating AR-driven transcriptional activity and PCa progression. These results indicate that GOLM1 and its associated proteins may become potential therapeutic targets for PCa characterized by dysregulated AR-driven transcriptional activation.

Keywords: AR; GOLM1; PSMD1; UPS; prostate cancer.


Conflict of interest statement

We declare no conflicts of interest.

Figures
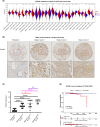
FIGURE 1
FIGURE 1
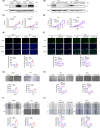
GOLM1 expression is correlated with the PCa progression and its poor prognosis. (A) Pan‐cancer analysis of GOLM1 expression using TCGA data. (Pan‐cancer GOLM1 expression data were acquired via the UCSC Xena data portal, performed log2 (x + 0.001) transformation on each expression value, and calculated by non paired Wilcoxon Rank Sum and Signed Rank Tests. *p < 0.05, **p < 0.01, ***p < 0.005, ****p < 0.001). (B) Immunohistochemical staining of TMA was used to assess GOLM1 expression in paracancer and PCa tissues of Glenn score 3, 4 and 5. Scale bar, 100 μm or 500 μm. (C) Relative expression level of GOLM1 in paracancer tissues and PCa tissues of gleason score 3, 4 and 5 grades (Data were means ± SEM. p values were calculated by one‐way ANOVA with Tukey's tests, *p < 0.05, **p < 0.01 and ****p < 0.001). (D) Kaplan–Meier survival curve on GOLM1 expression status in PCa patients. TCGA‐PRAD (496 canses), Kaplan–Meier analysis and log‐rank test were performed by the ‘UCSCXenaShiny’ R package.
FIGURE 2
FIGURE 2
GOLM1 promotes PCa cell proliferation, invasion and migration. (A, B) Western blot analysis of GOLM1 protein expression in GOLM1‐overexpressing cells, GOLM1‐silencing cells and control cells. (C– F) CCK8 assays and EdU assays were used to determine the proliferation ability of GOLM1‐overexpressing cells, GOLM1‐silencing cells and control cells. (G–J) Transwell assays analysis of cell invasion ability and Wound healing assays analysis of cell migration ability were performed in the GOLM1‐overexpressing cells, GOLM1‐silencing cells and control cells. Data were means ± SEM. p values were calculated by two‐way ANOVA with Sidak multiple comparisons tests (C, D); p values were calculated by two‐tailed t‐test (E, G, I); p values were calculated by one‐way ANOVA with Dunnett's multiple comparisons tests. (F, H, J) *p < 0.05, **p < 0.01. Scale bar, 200 μm.
FIGURE 3
FIGURE 3
GOLM1 promotes PCa tumour growth in vivo. (A, B) Subcutaneous tumours and growth curve of xenograft models derived from C4‐2‐Vector and C4‐2‐GOLM1. (C, D) Appearance and weight of tumours after 50 days. (E) GOLM1 and Ki‐67 expression of xenograft tumours were reflected by immunostaining. Data were means ± SEM. p values were calculated by two‐way ANOVA with Sidak multiple comparisons tests (B); p values were calculated by Mann–Whitney test (D); p values were calculated by two‐tailed t‐test (E). *p < 0.05, **p < 0.01. Scale bar, 50 μm or 500 μm.
FIGURE 4
FIGURE 4
GOLM1 has a close correlation with AR signalling. (A) Scatter‐correlation analysis between GOLM1and AR as well as its target genes (KLK3, NKX3‐1 and TMPRSS2) based on the TCGA‐PRAD data. (B) Real‐time RT‐PCR analysis of GOLM1 and KLK3 mRNA level in normal and PCa tissues (31 pairs). (C, D) The expression of GOLM1 and KLK3(PSA) in paracancer tissues and PCa tissues of gleason score 3, 4 and 5 grades based on the TMAs (34 PCa patients' samples, 89 points). Scale bar, 50 μm or 500 μm. (E) Correlation analysis of GOLM1 and KLK3 expression in PCa tissues (Pearson R = 0.6588). Data were means ± SEM. p values were calculated by two‐tailed t‐test (B); p values were calculated by two‐way ANOVA with Tukey's tests (D). *p < 0.05, **p < 0.01, ****p < 0.001.
FIGURE 5
FIGURE 5
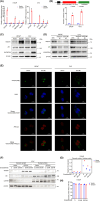
GOLM1 promotes AR protein expression and AR‐driven transcriptional activity. (A) Real‐time RT‐PCR analysis of AR and its target genes (KLK3, TMPRSS2, and NKX3.1) in stable GOLM1‐overexpressing and control LNCaP and C4‐2 cells. (B) KLK3‐promoter (−1 to −641) luciferase reporter assay in stable GOLM1‐overexpressing and control cells. (C, D) Western blot analysis of the protein expression of AR and its target KLK3(PSA) in stable GOLM1‐overexpressing cells, GOLM1‐silencing cells and control cells. (E) Immunofluorescence analysis of AR expression and nuclear translocation in stable GOLM1‐overexpressing and control cells. Scale bar, 20 μm. (F) Western blot analysis of cytosolic and nuclear AR protein in stable control and GOLM1‐overexpressing LNCaP cells treated with Enzalutamide (0, 50 and 200 nM). (G) Relative expression level of AR in cytosolic and nuclear. (H) Nuclear protein ratio of AR. Data were means ± SEM. p values were calculated by Multiple unpaired t‐tests (A, B); p values were calculated by three‐way ANOVA (G) and two‐way ANOVA with Tukey's multiple comparisons tests (H).*p < 0.05, **p < 0.01.
FIGURE 6
FIGURE 6
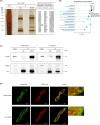
GOLM1 interacts with proteasome 26S subunit, non‐ATPases 1 (PSMD1) in PCa cells. (A) Mass spectrometry analysis of GOLM1‐interacted proteins. Silver stainning of IgG and anti‐GOLM1 Co‐immunoprecipitation samples from stable GOLM1‐overexpressing C4‐2 cells, and the bands were analysed by Mass spectrometry. Twenty‐three candidate molecules interacting with GOLM1 were identified (Abundances: GOLM1/IgG >= 5), detailed in the Table S4. (B) KEGG pathway enrichment analysis of 23 identified GOLM1 interactors. (C, D) Co‐immunoprecipitation analysis and Co‐localization analysis of GOLM1 and PSMD1 in stable GOLM1‐overexpressing LNCaP and C4‐2 cells. Scale bar, 20 μm.
FIGURE 7
FIGURE 7
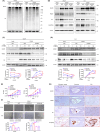
GOLM1 promotes AR‐driven transcriptional activity and PCa progression relies on interaction with PSMD1. (A, B) Western blot analysis of the levels ubiquitylated proteins, AR and its target KLK3(PSA) in stable GOLM1‐overexpressing LNCaP and C4‐2 cells transfected with siNC, siPSMD1#1 and siPSMD1#2. (C, D) Stable control and GOLM1‐overexpressing LNCaP and C4‐2 cells transfected with siNC or siPSMD1 and treated with CHX (50 μg/mL) for 0, 6 and 12 h. AR protein stability was analysed by Western blotting. (E, F) CCK8 assays analysis of cell viability and transwell assays analysis of cell invasion ability were performed in the above‐mentioned cells. (G) Immunohistochemistry analysis of GOLM1, PSMD1, AR and KLK3(PSA) in paracancer tissues and PCa tissues. Scale bar, 100 μm, 200 μm or 500 μm. Data were means ± SEM. Data were means ± SEM. P values were calculated by two‐way ANOVA with Sidak multiple comparisons tests (C–E); p values were calculated by one‐way ANOVA with Tukey's multiple comparisons tests (F). *p < 0.05, **p < 0.01.

Similar articles

References

    1. Sung H, Ferlay J, Siegel RL, et al. Global cancer statistics 2020: GLOBOCAN estimates of incidence and mortality worldwide for 36 cancers in 185 countries. CA Cancer J Clin. 2021;71(3):209‐249. doi:10.3322/caac.21660 - DOI - PubMed
    1. Karantanos T, Evans CP, Tombal B, Thompson TC, Montironi R, Isaacs WB. Understanding the mechanisms of androgen deprivation resistance in prostate cancer at the molecular level. Eur Urol. 2015;67(3):470‐479. doi:10.1016/j.eururo.2014.09.049 - DOI - PMC - PubMed
    1. Perlmutter MA, Lepor H. Androgen deprivation therapy in the treatment of advanced prostate cancer. Rev Urol. 2007;9(Suppl 1):S3‐S8. - PMC - PubMed
    1. Chandrasekar T, Yang JC, Gao AC, Evans CP. Mechanisms of resistance in castration‐resistant prostate cancer (CRPC). Transl Androl Urol. 2015;4(3):365‐380. doi:10.3978/j.issn.2223-4683.2015.05.02 - DOI - PMC - PubMed
    1. Attard G, Parker C, Eeles RA, et al. Prostate cancer [research support, N.I.H., extramural research support, non‐U.S. Gov't review]. Lancet. 2016;387(10013):70‐82. doi:10.1016/S0140-6736(14)61947-4 - DOI - PubMed