Study on serum metabolomics characteristics of obese patients with erectile dysfunction
- PMID: 39470567
- PMCID: PMC11521011
- DOI: 10.1097/MD.0000000000040093
Study on serum metabolomics characteristics of obese patients with erectile dysfunction
Abstract
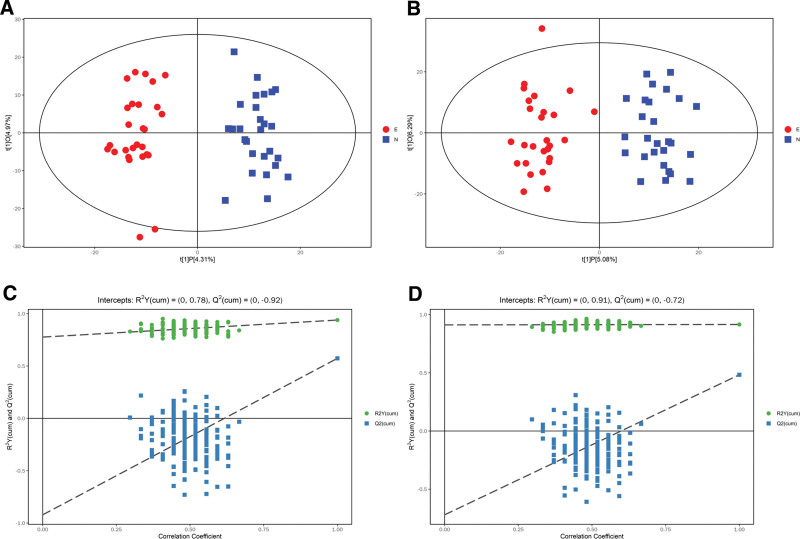
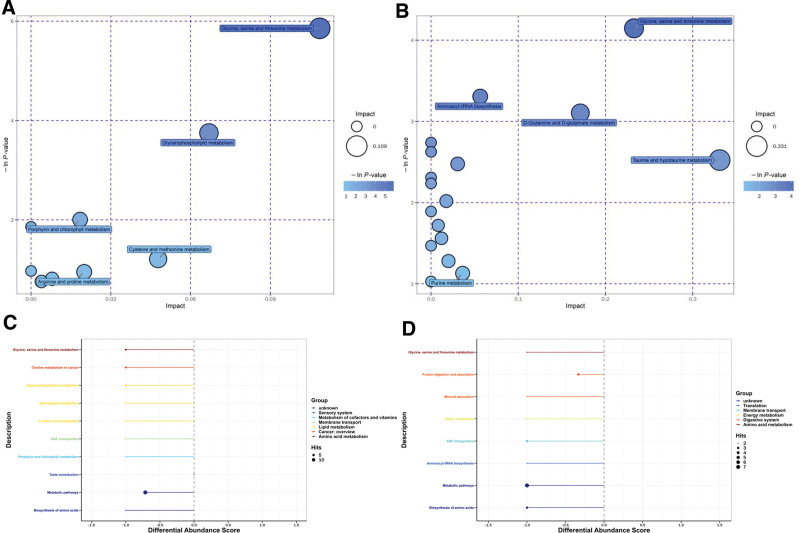
Erectile dysfunction (ED) is a common male sexual health problem that can be associated with obesity. This study aimed to identify serum metabolic differences and pathways related to ED in obese men using non-targeted metabolomics techniques. We included 54 obese male patients with (n = 27) and without (n = 27) ED. We collected 5 mL of fasting elbow vein blood and analyzed serum metabolites using ultra-high-performance liquid chromatography-mass spectrometry. Multivariate statistical methods (principal component analysis and orthogonal partial least squares discriminant analysis) were used to identify differential metabolites between the groups. Finally, pathway analysis using the Kyoto encyclopedia of genes and genomes database identified 4 differential metabolic pathways in obese men with ED compared to obese men without ED. A total of 77 differential metabolites were identified in obese men with ED compared to the control group (obese men without ED) using a threshold of variable importance in the projection > 1 and P < .05. Pathway analysis revealed 4 main differences: glycine, serine and threonine metabolism, glycerophospholipid metabolism, aminoacyl-tRNA biosynthesis, and D-glutamine and D-glutamate metabolism. Specific metabolites associated with these pathways included betaine aldehyde, choline, L-threonine, phosphatidylcholine, L-serine, and D-glutamine. Our findings suggest abnormalities in fatty acid metabolism, phospholipid metabolism, and amino acid metabolism between obese men with and without ED. Metabolites such as betaine aldehyde, choline, L-threonine, phosphatidylcholine, L-serine, and D-glutamine may be potential biomarkers for distinguishing obese men with ED.
Copyright © 2024 the Author(s). Published by Wolters Kluwer Health, Inc.
Conflict of interest statement
The authors have no conflicts of interest to disclose.
Figures
Similar articles
-
[Plasma metabolomics in a deep vein thrombosis rat model based on ultra-high performance liquid chromatography-electrostatic field orbitrap high resolution mass spectrometry].Se Pu. 2022 Aug;40(8):736-745. doi: 10.3724/SP.J.1123.2021.12024. Se Pu. 2022. PMID: 35903841 Free PMC article. Chinese.
-
Serum Metabolic Profiles of Chinese Women With Perimenopausal Obesity Explored by the Untargeted Metabolomics Approach.Front Endocrinol (Lausanne). 2021 Sep 24;12:637317. doi: 10.3389/fendo.2021.637317. eCollection 2021. Front Endocrinol (Lausanne). 2021. PMID: 34630316 Free PMC article.
-
Serum Untargeted Metabolomics Reveal Potential Biomarkers of Progression of Diabetic Retinopathy in Asians.Front Mol Biosci. 2022 Jun 9;9:871291. doi: 10.3389/fmolb.2022.871291. eCollection 2022. Front Mol Biosci. 2022. PMID: 35755823 Free PMC article.
-
Serum amino acid metabolic profiles of ankylosing spondylitis by targeted metabolomics analysis.Clin Rheumatol. 2020 Aug;39(8):2325-2336. doi: 10.1007/s10067-020-04974-z. Epub 2020 Mar 4. Clin Rheumatol. 2020. PMID: 32130577
-
Translational Metabolomics of Head Injury: Exploring Dysfunctional Cerebral Metabolism with Ex Vivo NMR Spectroscopy-Based Metabolite Quantification.In: Kobeissy FH, editor. Brain Neurotrauma: Molecular, Neuropsychological, and Rehabilitation Aspects. Boca Raton (FL): CRC Press/Taylor & Francis; 2015. Chapter 25. In: Kobeissy FH, editor. Brain Neurotrauma: Molecular, Neuropsychological, and Rehabilitation Aspects. Boca Raton (FL): CRC Press/Taylor & Francis; 2015. Chapter 25. PMID: 26269925 Free Books & Documents. Review.
References
-
- Zhang MJ. Integrated Traditional Chinese and Western Medicine Andrology. 2nd ed. Beijing: Science Press; 2017. (in Chinese).
-
- Goldstein I, Goren A, Li VW, Tang WY, Hassan TA. Epidemiology update of erectile dysfunction in eight countries with high burden. Sex Med Rev. 2020;8:48–58. - PubMed
-
- Cao ZQ, Du HL, Wu ZP, et al. . Analysis of disease perception and influencing factors in patients with erectile dysfunction. Chin J Androl. 2023;37:85–9 (in Chinese).
-
- Yang SW, Kang CM, Zhao H, et al. . Influencing factors of male erectile dysfunction and construction of nomogram risk model. Chin J Hum Sex. 2023;32:44–8. (in Chinese).
-
- Bacon CG, Mittleman MA, Kawachi I, Giovannucci E, Glasser DB, Rimm EB. Sexual function in men older than 50 years of age: results from the health professionals follow-up study. Ann Intern Med. 2003;139:161–8. - PubMed
MeSH terms
Substances
Grants and funding
- Guo Traditional Chinese Medicine Renjiao Letter [2022] No.75/National Famous Traditional Chinese Medicine Expert Inheritance Studio Construction Project
- Minwei Traditional Chinese Medicine Letter [2022] No. 554/Academic Experience Inheritance Project for Famous Traditional chineseMedicine Experts in Fujian Province
- JAT190252/Department of Education Young and Middle aged Teacher Education Research Project of Fujian Province
- Min Ren Yuan [2023] No.25/the research team supporting project of Fujian University of TraditionaChinese Medicine Affiliated People's Hospital
LinkOut - more resources
Full Text Sources
Medical