. 2024 Oct 29;15(1):9310.
doi: 10.1038/s41467-024-53582-x.

Using in vivo intact structure for system-wide quantitative analysis of changes in proteins

Affiliations

Using in vivo intact structure for system-wide quantitative analysis of changes in proteins

Ahrum Son et al. Nat Commun. .

Abstract

Mass spectrometry-based methods can provide a global expression profile and structural readout of proteins in complex systems. Preserving the in vivo conformation of proteins in their innate state is challenging during proteomic experiments. Here, we introduce a whole animal in vivo protein footprinting method using perfusion of reagents to add dimethyl labels to exposed lysine residues on intact proteins which provides information about protein conformation. When this approach is used to measure dynamic structural changes during Alzheimer's disease (AD) progression in a mouse model, we detect 433 proteins that undergo structural changes attributed to AD, independent of aging, across 7 tissues. We identify structural changes of co-expressed proteins and link the communities of these proteins to their biological functions. Our findings show that structural alterations of proteins precede changes in expression, thereby demonstrating the value of in vivo protein conformation measurement. Our method represents a strategy for untangling mechanisms of proteostasis dysfunction caused by protein misfolding. In vivo whole-animal footprinting should have broad applicability for discovering conformational changes in systemic diseases and for the design of therapeutic interventions.


Conflict of interest statement

The authors declare no competing interests.

Figures

Fig. 1
Fig. 1. Strategy for identifying dimethyl-labeled peptides.
Three mice per each age group (ranging 6 months to 15 months) were used for AD (APPNL-F) and NC (C57BL6/J). The first step of the CPP workflow consists of three sub-steps that were conducted via perfusion: (i) blood was washed by PBS, (ii) tissue was fixed by formaldehyde, and (iii) exposed lysine sites of the native proteins were labeled with light-dimethylation ([CD2H]2). Proteins from each of the seven organs were extracted and digested separately with chymotrypsin, after which the newly exposed lysine sites were labeled with heavy dimethylation ([C13D3]2). Created in BioRender. Kim, H. (2022) BioRender.com/d78w669.
Fig. 2
Fig. 2. Pattern of labeling across tissues.
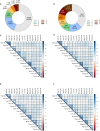
A More than half of the total labeled peptides were tissue-specific. Less than 3% of a total of labeled peptides were peptides common to all seven tissues. B The proportions of labeled proteins were determined by assigning proteins to the labeled peptides. Unlabeled proteins were not counted. The largest portion of labeled proteins was tissue-specific proteins, and the portion of proteins common to all 7 tissues was the third largest portion. CF Biological triplicates were correlated across 7 tissues at 6 months (C), 9 months (D), 12 months (E) and 15 months (F).
Fig. 3
Fig. 3. Variability of the conformational changes depending on the tissues.
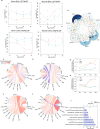
A Two representative peptides (ILETQKQF and GIQKELQF) were shown representatively. The normalized values were utilized to fit spline models. The accessibility of each peptide for both NC (blue) and AD (red) exhibited significantly distinct patterns from 6 to 15 months (Benjamin Hochberg, adjusted P-values = 0.0036 (brain), 0.0282 (muscle) for ILETQKQF, adjusted P-values = 0.0029 (brain), 0.0028 (muscle) for GIQKELQF). B Venn diagram shows the number of peptides exhibiting significant differences in the trend of accessibility changes between NC and AD. There were no peptides from AD that showed a significant difference in accessibility changes compared to NC in all 7 tissues during the period from 6 to 15 months. The value of zero was not indicated. CH During AD progression, 10 common peptides exhibited distinct patterns in accessibility between NC and AD in different four tissues. The variabilities for the structural changes in each tissue were calculated based on the value of brain using the formula: (fold-change of other tissue - fold-change of brain) / fold-change of brain at 6 mo (C), 9 mo (D), 12 mo (E), and 15 mo (F). Only the first three amino acids were shown. AGTAEAIKAL of Gatd3 (G) and GIQKELQF of Ldha (H) showed a difference in the magnitude of accessibility change in muscle and spleen compared to that in the brain as AD progressed. The number indicates the position of the labeled lysine site within the sequence. I. Enriched KEGG pathways with 10 proteins. P-value were corrected with Bonferroni. Source data are provided as a Source Data file.
Fig. 4
Fig. 4. Changes in the structures of proteins that are known to be associated with brain.
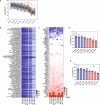
A, B Accessibility of 83 labeled peptides that mapped to 62 proteins were significantly changed. The accessibility values in AD groups decreased more steeply than those in NC groups (A). The proteins and peptides corresponding to each change in the accessibility are indicated B. C Expression of 60 brain proteins were compared to averaged expression in six other tissues, as enrichment factor (C). The minimum enrichment factor was 0.13 for Eef2 in NC at 15 months and the maximum enrichment factor was 1232 for Tuba1b in NC at 12 months. Expression of 6 proteins (Eef2, Gucy1b1, NARS1, Slc25a12, Wdr37, Ywhag) was lower in brain than the expression of the corresponding proteins in other tissues at all ages in NC and AD. The bar indicates the enrichment factor, with red indicating an enrichment factor more than 1, and blue indicating an enrichment factor less than 1. Proteins enriched more than 70-fold are marked in red. D, E Two of the three peptides of Cnp share one lysine site, and variations in accessibility for these two peptides are represented. KIIPGSRADF (D) is located at 87-96 amino acid of Cnp and QYQVVLVEPKTAW (E) is located at 141–153 amino acid of Cnp. While they exhibited a decreasing trend in AD, the accessibility values were lower in AD compared to NC, and the trend in AD was steeper than in NC. In the AD group, both peptides showed P-values below 0.05 (Kruskal-Wallis test, p = 0.0084 (D), p = 0.0008 (E)), indicating statistically significant changes in peptide accessibility during AD progression. Experiments were performed in biological triplicates per group, with each dot representing an individual mouse. The significance levels shown in the graph represent P-value from post-hoc analysis (Dunn’s test, adjusted p = 0.0327 for AD 6mo vs. AD 15mo). Blue indicates NC groups, pink indicates AD groups. Asterisk (*) denotes P-value < 0.05 from Dunn’s test. Error bars indicate the mean ± standard deviation. Source data are provided as a Source Data file.
Fig. 5
Fig. 5. The structural changes of the co-expressed proteins by WGCNA.
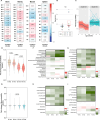
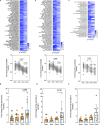
A Four of the seven tissues (brain, kidney, muscle and spleen) showed significant correlated modules (R2 > 0.4, Two-sided Student’s t-test, P-value < 0.05). B In module 3 (M3) of brain, the eigenprotein level between AD and NC was assessed, with dot colors indicating the age of the mice. Three mice per age were used for both NC and AD. The minima/maxima are the lowest/highest data point. Center line denotes median, box edges indicate the 25th and 75th percentiles, and whiskers extend to ±1.5 interquartile range (IQR). CE The labeled peptides of M3 proteins were clustered based on the fold-change of the accessibility (C). Distribution of the fold-change of the accessibility of cluster 1 (D) and cluster 2 (E). Of 481 labeled peptides that mapped onto 174 proteins in M3, fold-change of accessibility of 268 peptides showed a consistent decrease in progressing AD in cluster 1 and fold-change of accessibility of 213 peptides in cluster 2 did not significantly change in progressing AD. P-values from two-sided Student’s t-test are shown between the indicated groups. FI The fold changes of the accessibility for Map1a (F), Psat (G), Mag (H), and Plp1 (I) are presented. The peptides in the bold box were included in cluster 1. Peptides in the bold box clearly decreased. Source data are provided as a Source Data file.
Fig. 6
Fig. 6. The biological functions affected by structural changes of composed proteins.
AC Structural changes of proteins enriched in generation of precursor metabolite and energy (A), carbon metabolism (B), and metal ion homeostasis (C) are shown. The heatmap (top) showed variations in the fold-change of the accessibility based on peptide sequence. The scatter plots (bottom) were plotted irrespective of peptide sequences. The p-value was calculated using Student’s t-test. D–F Expression change of proteins enriched in generation of precursor metabolite and energy (D), carbon metabolism (E), and metal ion homeostasis (F). The fold-changes of the expression level are presented. Three mice per age were used for both NC and AD. Error bars indicate the mean ± standard deviation. P-values from two-sided Mann-Whitney test are shown between the indicated groups. Source data are provided as a Source Data file.
Fig. 7
Fig. 7. The physical interactions of the proteins in M3 of brain.
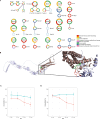
A Forty-five proteins in the brain dataset were physically interacted. Each node indicates a protein. The ring color of the node indicates the terms that the protein is associated with. The size of node represents the number of significantly changed lysine sites, with very small nodes indicating no significantly changed peptides, small nodes indicating one significantly changed peptide, medium nodes indicating 2–4 significantly changed peptides, and large nodes indicating more than 4 significantly changed peptides. B The structure of the Plp1-Mag complex was predicted using AlphaFold-Multimer. The structure in dark pink is Plp1 and the structure in light purple is Mag. FSKNYQDY of Plp1 and YFNSPYPKNYPPVVF of Mag were presented in green and red, respectively. The right panel is an enlarged view of the complex on the left. The distance between alpha-carbons of two lysine sites was 13.9 Å. C, D Structural changes in adjacent peptide regions with potential binding, with variation of the accessibility of site in AD (pink) and NC (green) for FSKNYQDY (C) and YFNSPYPKNYPPVVF (D). Three mice per age were used for both NC and AD. Error bars indicate the mean ± standard deviation. Source data are provided as a Source Data file.

Similar articles

References

    1. Jones, S. & Thornton, J. M. Principles of protein-protein interactions. Proc. Natl. Acad. Sci. USA93, 13–20 (1996). - PMC - PubMed
    1. Keskin, O., Gursoy, A., Ma, B. & Nussinov, R. Principles of protein-protein interactions: what are the preferred ways for proteins to interact? Chem. Rev.108, 1225–1244 (2008). - PubMed
    1. Kalheim, L. F., Fladby, T., Coello, C., Bjornerud, A. & Selnes, P. [18F]-Flutemetamol uptake in cortex and white matter: comparison with cerebrospinal fluid biomarkers and [18F]-Fludeoxyglucose. J. Alzheimers Dis.62, 1595–1607 (2018). - PMC - PubMed
    1. Sakakibara, D. et al. Protein structure determination in living cells by in-cell NMR spectroscopy. Nature458, 102–105 (2009). - PubMed
    1. Oikonomou, C. M. & Jensen, G. J. Cellular electron cryotomography: toward structural biology in situ. Annu. Rev. Biochem.86, 873–896 (2017). - PubMed