. 2024 Oct 28;15(1):9210.
doi: 10.1038/s41467-024-53610-w.

Ancestral neural circuits potentiate the origin of a female sexual behavior in Drosophila

Affiliations

Ancestral neural circuits potentiate the origin of a female sexual behavior in Drosophila

Minhao Li et al. Nat Commun. .

Abstract

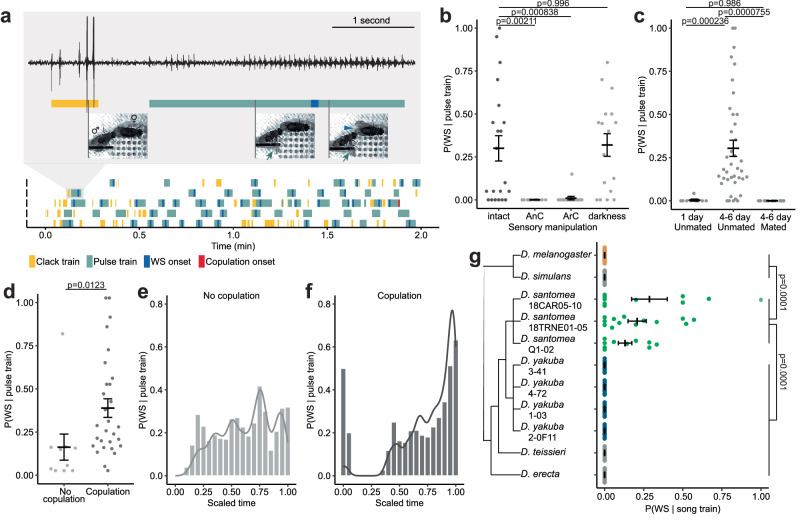
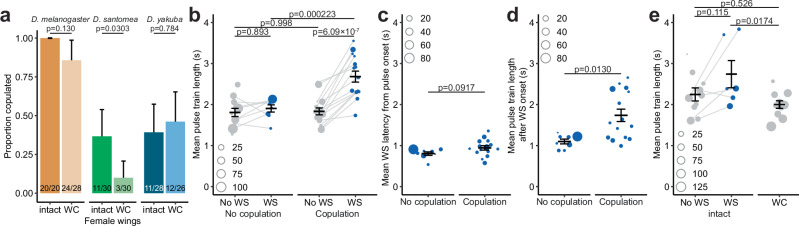
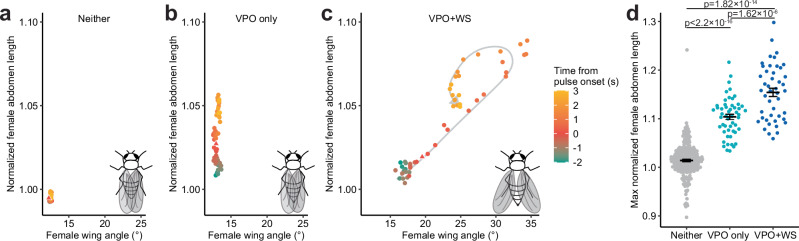
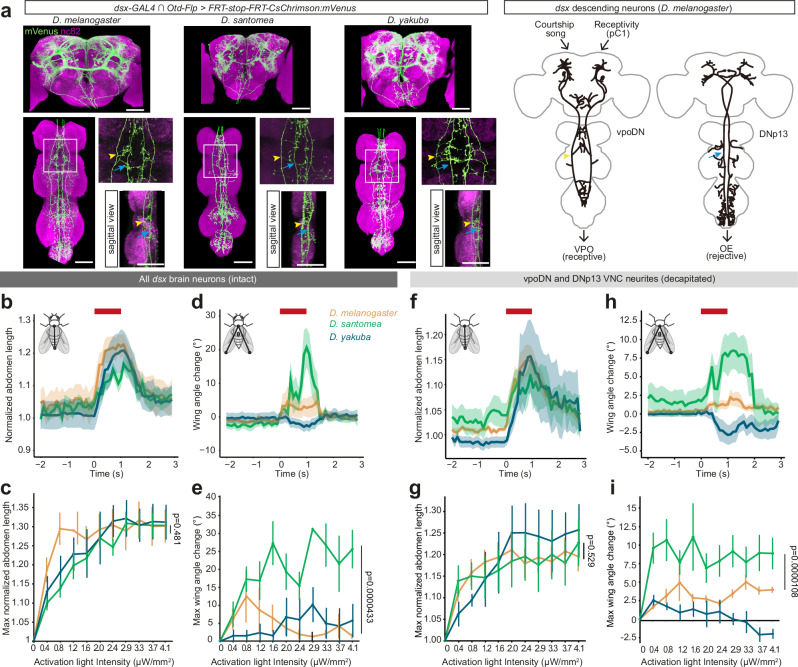
Courtship interactions are remarkably diverse in form and complexity among species. How neural circuits evolve to encode new behaviors that are functionally integrated into these dynamic social interactions is unknown. Here we report a recently originated female sexual behavior in the island endemic Drosophila species D. santomea, where females signal receptivity to male courtship songs by spreading their wings, which in turn promotes prolonged songs in courting males. Copulation success depends on this female signal and correlates with males' ability to adjust his singing in such a social feedback loop. Functional comparison of sexual circuitry across species suggests that a pair of descending neurons, which integrates male song stimuli and female internal state to control a conserved female abdominal behavior, drives wing spreading in D. santomea. This co-option occurred through the refinement of a pre-existing, plastic circuit that can be optogenetically activated in an outgroup species. Combined, our results show that the ancestral potential of a socially-tuned key circuit node to engage the wing motor circuit facilitates the expression of a new female behavior in appropriate sensory and motivational contexts. More broadly, our work provides insights into the evolution of social behaviors, particularly female behaviors, and the underlying neural mechanisms.


Conflict of interest statement

The authors declare no competing interests.

Figures

Fig. 1
Fig. 1. Wing spreading in D. santomea is a recently originated female receptive behavior in response to male pulse song.
a Representative behavioral ethograms of 2-min windows in 5 courting D. santomea pairs. Gray box: zoom-in showing song trace, ethogram annotation, and still photos of a courting pair during a clack and a pulse train. Arrows point to male single wing extension during a pulse train, and the arrowhead points to female wing spreading (WS). b Probability of observing WS in response to a male pulse train in intact, antennae cut (AnC), and aristae cut (ArC) females, and in pairs recorded in darkness. n = 21, 10, 15, 17. c, Probability of observing WS in response to a male pulse train in females separated by age-related sexual maturity and mating status. 1 day old females are sexually immature. n = 10, 39, 11. d Probability of observing WS in response to a male pulse train in sexually mature (4–6 day old) ummated females, separated by whether the pair copulated during the recording period. n = 10, 29. e, f Probability of observing WS in response to a male pulse train (bar, sliding windows of 0.1 width and 0.05 step size) over time and the corresponding density distributions (curve) in pairs that did not copulate (e) or copulated (f) during the recording period. Time was scaled for each pair such that 0.00 represents the start of recording, and 1.00 represents the end of recording (e) or the onset of copulation (f). n = 443 pulse trains from 12 pairs (e); 458 pulse trains from 16 pairs (f). g Probability of observing WS in response to conspecific male courtship songs in the melanogaster subgroup. n = 22, 11, 10, 13, 10, 10, 10, 10, 10, 8, 8. Error bars show mean ± SEM. Statistical significance was tested with two-sided ANOVA on linear models with post hoc Tukey test. Source data are provided as a Source Data file.
Fig. 2
Fig. 2. Wing spreading-dependent copulation success and song modulation in D. santomea.
a Proportion of pairs with intact or wing-cut (WC) females that succeeded in copulation in each species. Height of each bar represents the proportion. Error bars represent the 95% confidence interval. Fractions at the base of each bar denote “number of pairs that copulated”/“total pairs tested”. Significance tested by two-sided Fisher’s exact test. n = 20, 28, 30, 30, 28, 26. b Mean length of pulse trains separated by whether they elicited wing spreading (WS) and whether the pair copulated during the recording period. Dot size corresponds to the number of pulse trains of each type in each pair. n = 12, 8, 16, 15. c, d Mean latency of WS from pulse train onset (c) and mean pulse train length after WS onset (d), respectively, separated by whether the pair copulated during the recording period. In (d), the non-parametric two-sided Mann-Whitney U test is used to test for statistical difference between the two groups. n = 8, 15. e Mean length of pulse trains in pairs with intact females, separated by whether they elicited WS, and in pairs with WC females. Only pairs that did not copulate during the recording period are shown. n = 10, 6, 11. Dot size in (be) corresponds to the number of pulse trains of each type in each pair. Unless otherwise specified, error bars show mean ± SEM and statistical significance was tested with two-sided ANOVA on linear models (c), or linear mixed models using pair identity as a random effect (b, e), with post hoc Tukey test. Source data are provided as a Source Data file.
Fig. 3
Fig. 3. Wing spreading scales with VPO and co-occurs with VPO of higher intensity.
a–c Temporal relationship between normalized female abdomen length and female wing angle, averaged by event type: Neither (a), VPO only (b) and VPO + WS (c). Pulse onset is marked as a triangle. Gray arrow behind data points in (c) represents an approximate progression of data points. Inset diagrams illustrate each event type at maximum abdomen length and/or wing angle. n = 207 (a), 52 (b), 45 (c) events from 13 females. d Maximum normalized female abdomen length compared across all event types. Statistical significance was tested with two-sided ANOVA on linear mixed models, using pair identity as a random effect, with post hoc Tukey test. Error bars show mean ± SEM. n = 207, 52, 45. Source data are provided as a Source Data file.
Fig. 4
Fig. 4. Activation phenotypes of brain dsx neurons across three species.
a Confocal images of female dsx brain neurons in the brain (top) and VNC (bottom) of each species. Only two pairs of neurons, vpoDN and DNp13,, project into VNC. Arrowheads highlight VNC projections of vpoDN and arrows highlight that of DNp13. The neuron schematic of vpoDN is based on our confocal images and the neuron schematic of DNp13 was adapted from with permission from the publisher. Scale bars: 50 µm. n = 10 biological replicates for each species over 2 rounds. b–i, Behavioral phenotypes of optogenetically activating dsx brain neurons in intact (be) and decapitated (fi) females of each species. b, d, f, h Mean normalized abdomen length (b, f) and wing angle change (d, h) of intact females (b, d) at 1.6 μW/mm2 or decapitated females (f, h) at 0.8 μW/mm2. Activation window is denoted by bars above each plot. Shaded areas represent the SEM. Inset diagrams illustrate how abdomen lengths or wing angles were measured. n = 10 (D. melanogaster), 8 (D, yakuba), 9 (D. santomea). c, e, g, i Maximum normalized abdomen length (c, g) and wing angle change (e, i) of intact females (c, e) or decapitated females (g, i) under each activation intensity. Two-sided Mann-Whitney U tests were performed only between D. melanogaster and D. santomea (activation triggered female song in D. yakuba). Curve and error bars show mean ± SEM. n = 10 (D. melanogaster), 7 (D, yakuba), 8 (D. santomea). Source data are provided as a Source Data file.
Fig. 5
Fig. 5. Idiosyncratic and plastic latent potential of wing spreading in D. melanogaster.
a Confocal image of vpoDN neurons in D. melanogaster vpoDN-SS2 > UAS-CsChrimson:mVenus female brain and VNC. Scale bars: 50 µm. n = 12 biological replicates over 2 rounds. b Proportion of VPO and wing spreading (WS) events in response to 10 activation bouts with intensities ramping from 0.4 to 4.1 µW/mm2. Each dot represents an individual. Color represents whether an individual was scored as a WS responder or not. Error bars show mean ± SEM. c Schematic of how room temperature (RT) and high temperature (HT) groups were generated. d, e Mean normalized abdomen length (d) and wing angle change (e) of HT and RT flies at 4.1 µW/mm2. Activation window is denoted by bars above each plot. Shaded areas represent the SEM. Inset diagrams illustrate how abdomen lengths or wing angles were measured. f, g Maximum normalized abdomen length (f) and wing angle change (g) under each activation intensity. Curve and error bars show mean ± SEM. Two-sided Mann-Whitney U test was performed between RT and HT across all activation intensities. n = 91 (RT group), 80 (HT group). h WS onset frame of each of the 9 WS events observed in 7 courting wildtype pairs. Numbers denote “pair ID”.“event ID”. i Temporal relationship between normalized abdomen length and wing angle, averaged across all WS events. Pulse onset is marked as a triangle. Gray arrow behind data points represents an approximate progression of data points. n = 9 events from 7 females. Source data are provided as a Source Data file.
Fig. 6
Fig. 6. Wing spreading is found in multiple Drosophila lineages.
First two columns: proportion of females observed to exhibit VPO + WS, VPO, or neither behavior in pairwise matings under the designated social context (above). Asterisk denotes species where females were observed to sing courtship duets with males, and song-independent wing spreading behavior was not observed. Sample sizes are indicated in parentheses. Last column: published results from Spieth 1952 on whether the pre-copulatory acceptance behavior is VPO or VPO + WS. Numbers next to key nodes indicate estimated divergence times in Myr,–. Phylogeny is based on,,–. Source data are provided as a Source Data file.

Update of

Similar articles

Cited by

References

    1. Sturtevant, A. H. Experiments on sex recognition and the problem of sexual selection in Drosoophilia. J. Exp. Psychol. Anim. Behav. Process.5, 351 (1915).
    1. Greenspan, R. J. & Ferveur, J. F. Courtship in Drosophila. Annu. Rev. Genet.34, 205–232 (2000). - PubMed
    1. Egnor, S. R. & Seagraves, K. M. The contribution of ultrasonic vocalizations to mouse courtship. Curr. Opin. Neurobiol.38, 1–5 (2016). - PubMed
    1. Perkes, A., White, D., Wild, J. M. & Schmidt, M. Female Songbirds: The unsung drivers of courtship behavior and its neural substrates. Behav. Process.163, 60–70 (2019). - PubMed
    1. Mitoyen, C., Quigley, C. & Fusani, L. Evolution and function of multimodal courtship displays. Ethol.: Former. Z. fur Tierpsychologie.125, 503–515 (2019). - PMC - PubMed

LinkOut - more resources