. 2024 Oct 28;14(1):456.
doi: 10.1038/s41398-024-03158-6.

Understanding novel neuromodulation pathways in tDCS: brain stem recordings in rats during trigeminal nerve direct current stimulation

Affiliations

Understanding novel neuromodulation pathways in tDCS: brain stem recordings in rats during trigeminal nerve direct current stimulation

Alireza Majdi et al. Transl Psychiatry. .

Abstract

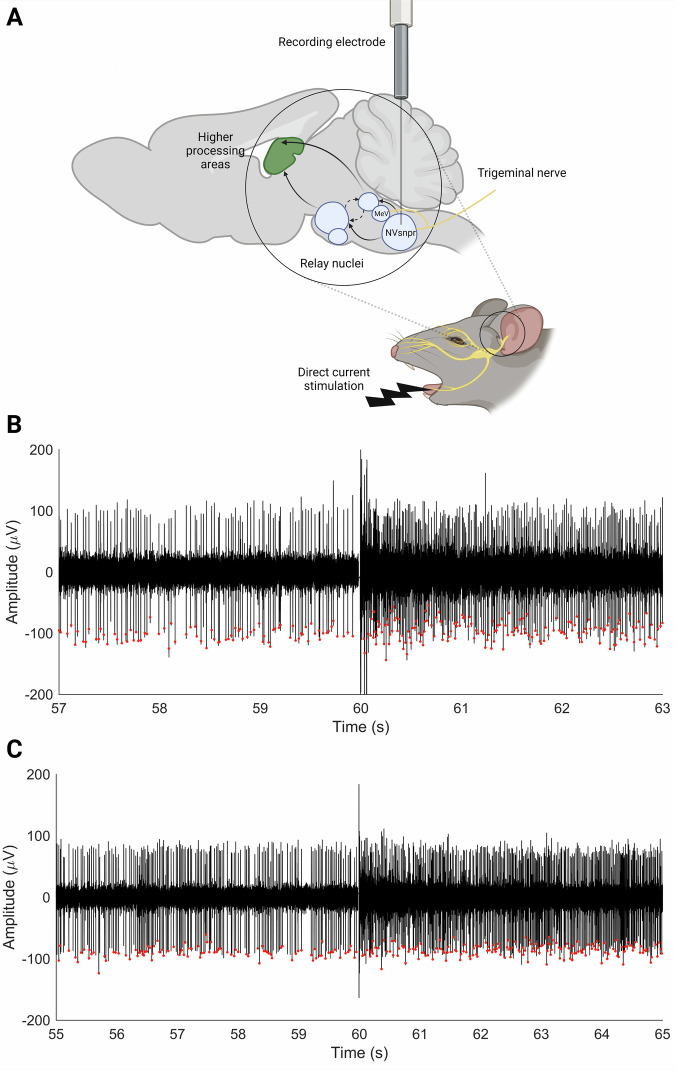
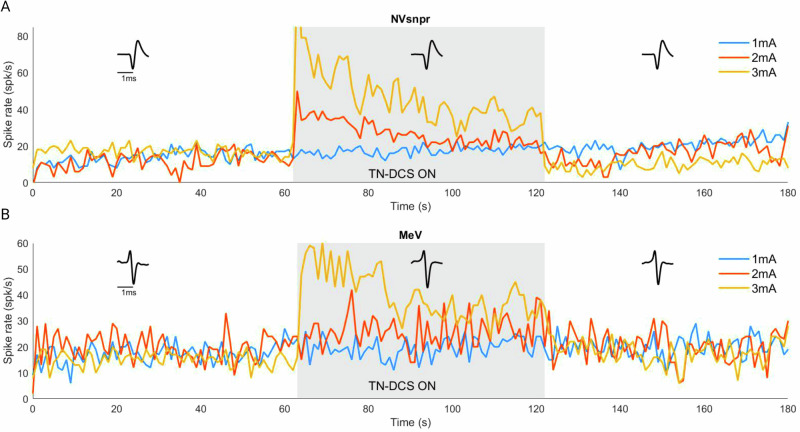
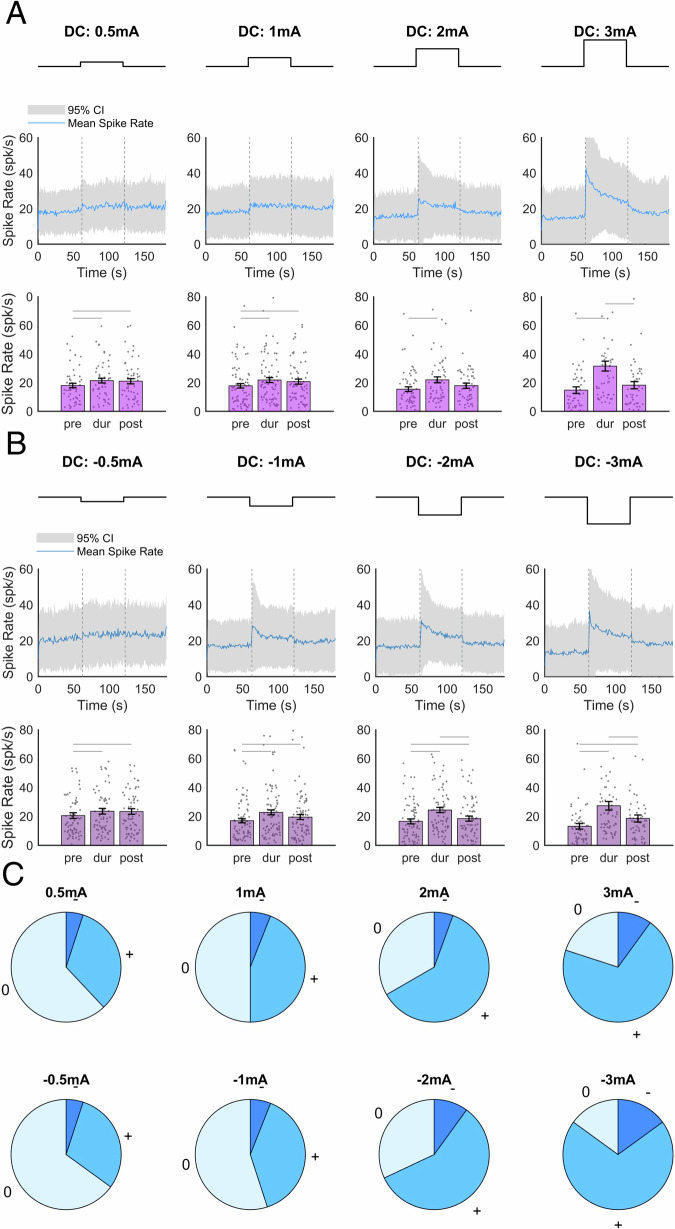
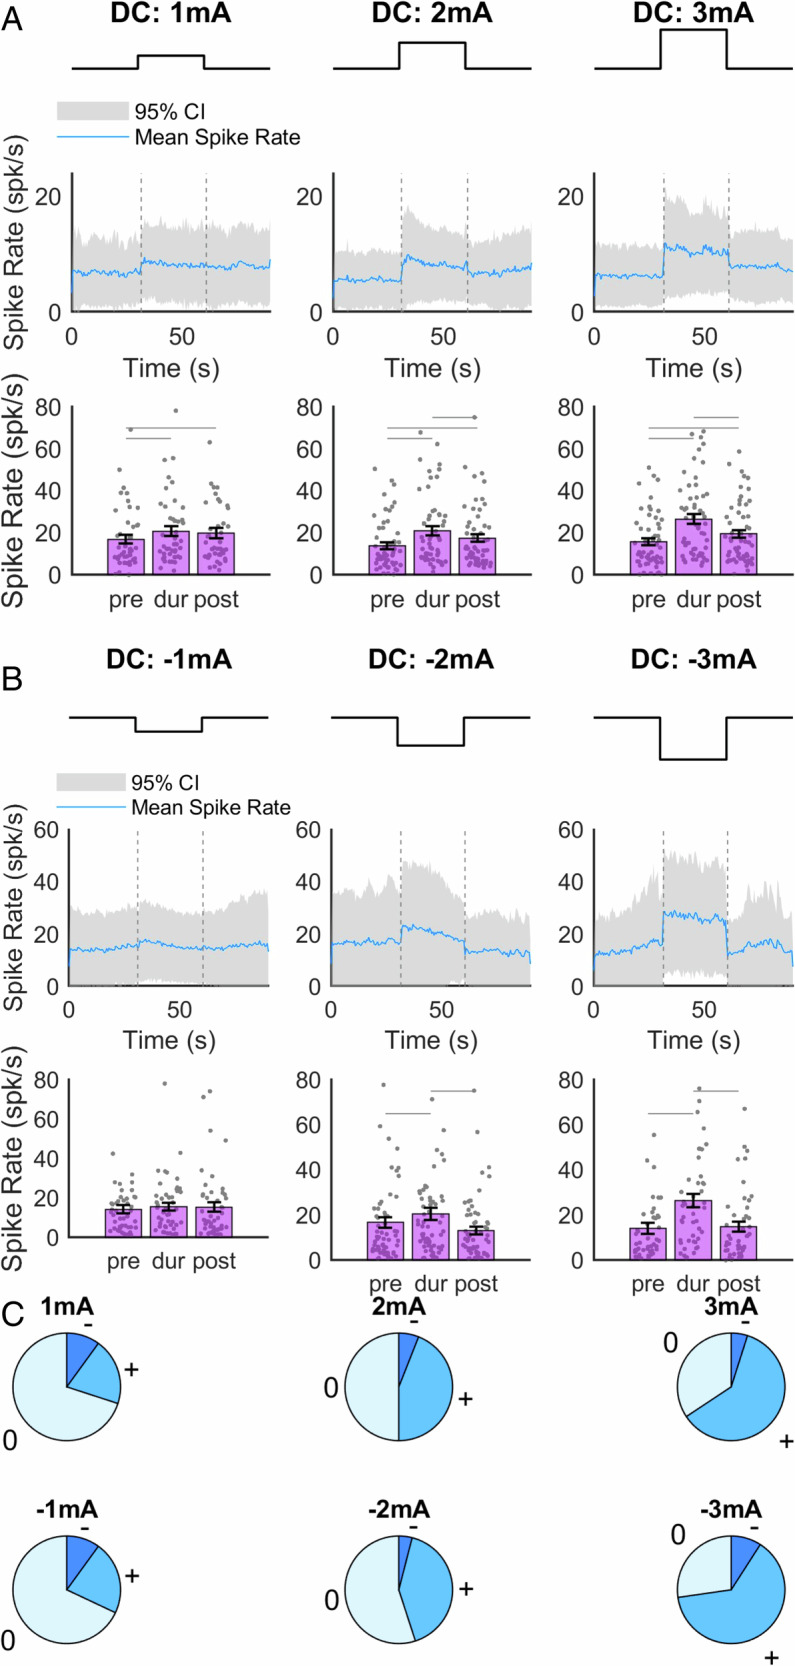
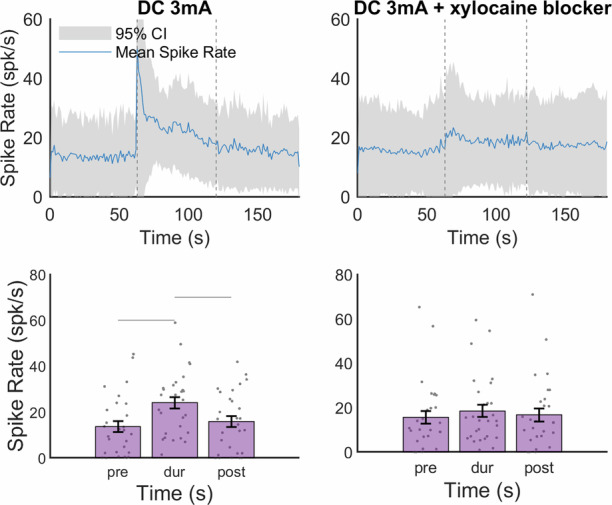
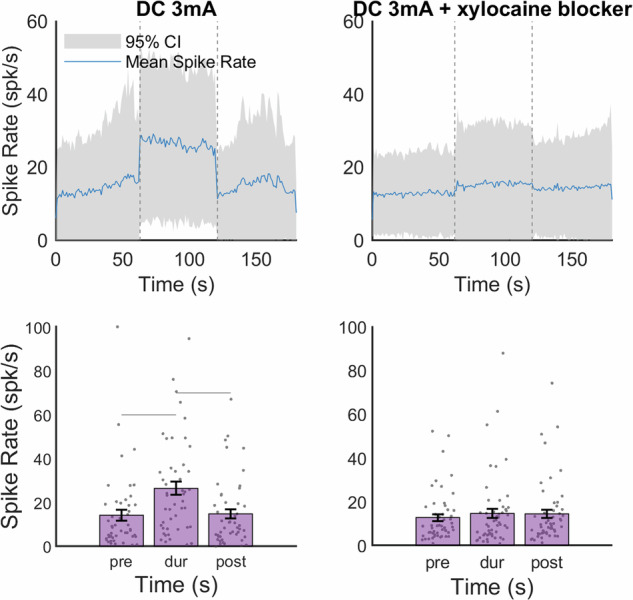
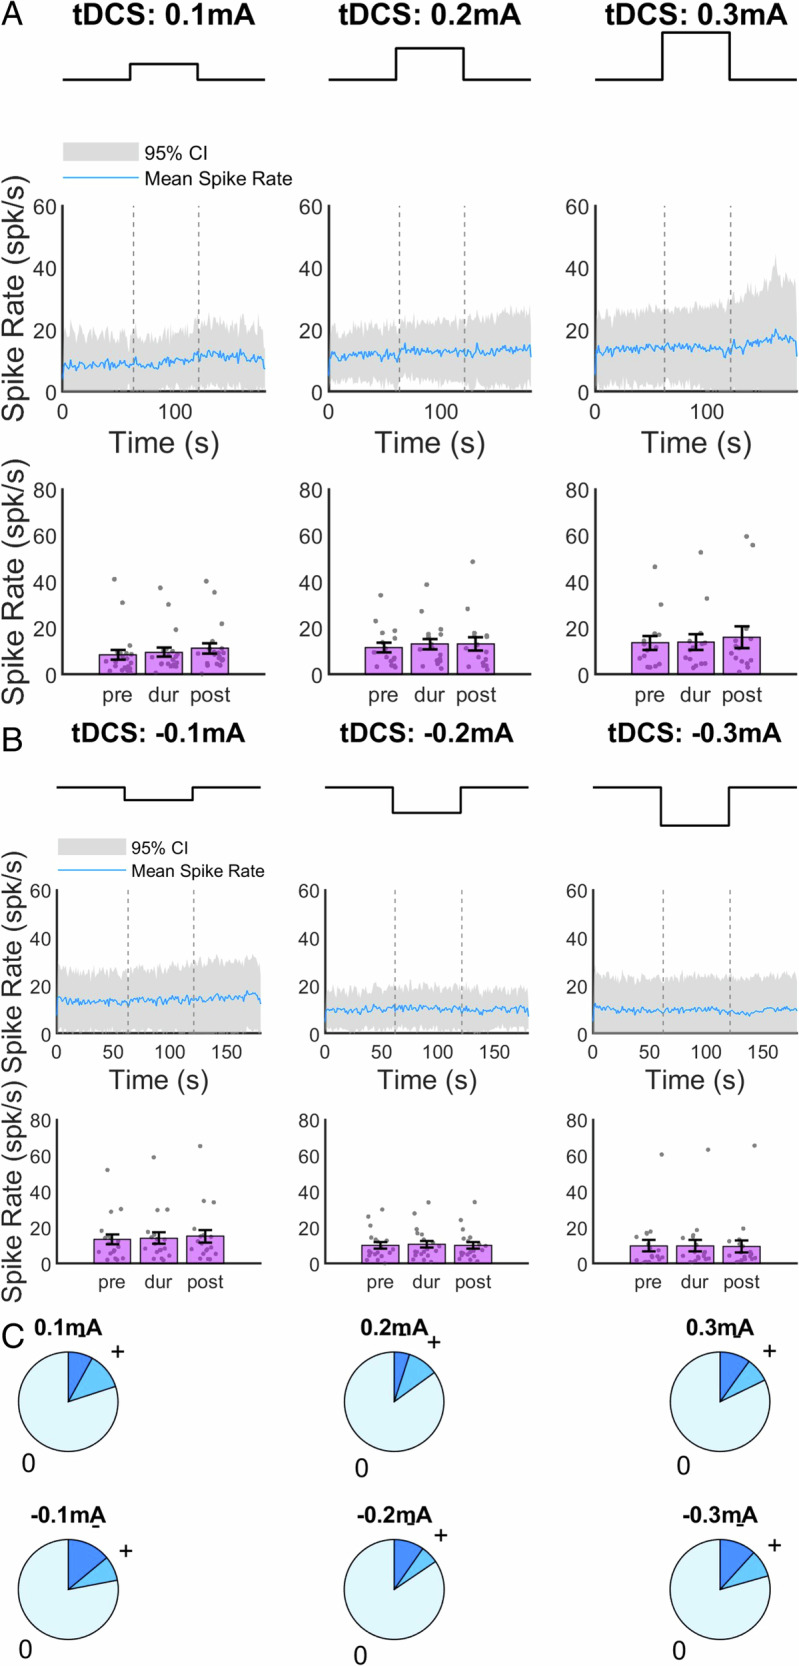
tDCS is widely assumed to cause neuromodulation via the electric field in the cortex acting directly on cortical neurons. However, recent evidence suggests that tDCS may indirectly influence brain activity through cranial nerve pathways, notably the trigeminal nerve, but these neuromodulatory pathways remain unexplored. To investigate the first stages in this potential pathway we developed an animal model to study the effect of trigeminal nerve direct current stimulation (TN-DCS) on neuronal activity in the principal sensory nucleus (NVsnpr) and the mesencephalic nucleus of the trigeminal nerve (MeV). We conducted experiments on twenty-four male Sprague Dawley rats (n = 10 NVsnpr, n = 10 MeV during anodic stimulation, and n = 4 MeV during cathodic stimulation). DC stimulation, ranging from 0.5 to 3 mA, targeted the trigeminal nerve's marginal branch. Concurrently, single-unit electrophysiological recordings were obtained using a 32-channel silicon probe, encompassing three 1-min intervals: pre, during, and post-stimulation. Xylocaine trigeminal nerve blockage served as a control. TN-DCS increased neuronal spiking activity in both NVsnpr and MeV, returning to baseline during the post-stimulation phase. The 3 mA DC stimulation of the blocked trigeminal nerve failed to induce increased spiking activity in the trigeminal nuclei. These findings provide empirical support for trigeminal nuclei modulation via TN-DCS, suggesting the cranial nerve pathways could play a role in mediating the tDCS effects in humans.


Conflict of interest statement

The authors declare no competing interests.

Figures

Fig. 1
Fig. 1. Representation of the electrode and recorded nuclei, and individual neuronal firing response to trigeminal nerve direct current stimulation (TN-DCS) in the Sprague Dawley Rat Brain.
A Schematic diagram showing stimulation and recording electrodes and the relative positional relationship of the recorded nuclei in the sagittal section of the Sprague Dawley rat brain. B Example of spike trains showing typical fast irregular firing of neurons in (B) the principle sensory nucleus (NVsnpr) and (C) the mesencephalic nucleus of the trigeminal nerve (MeV) before and after stimulation onset at 3 mA. A sharp increase in the number of spikes is observed upon the initiation of trigeminal nerve direct current stimulation (TN-DCS). Red dots represent spikes detected by the spike sorting process. Figure 1A is created with BioRender.com.
Fig. 2
Fig. 2. The effects of trigeminal nerve direct current stimulation (TN-DCS) on spike rate at individual neuron level.
Individual neuron examples of the effect of 3 different amplitudes (blue, red, and yellow representing 1, 2, and 3 mA, respectively) of trigeminal nerve direct current stimulation (TN-DCS) on spike rate and shape in principle sensory nucleus (NVsnpr; A) and mesencephalic nucleus of trigeminal nerve (MeV; B) neurons. Application of 3 mA TN-DCS increases spike rate during stimulation in both nuclei without affecting spike shape. The y-axis represents the spike rate per second and the x-axis depicts time in seconds.
Fig. 3
Fig. 3. Effect of different amplitudes and time epochs of trigeminal nerve direct current stimulation (TN-DCS) on neuronal spike rate in the principal sensory nucleus of the trigeminal nerve (NVsnpr).
A Anodic TN-DCS: The mean neuronal spike rate increased with increasing amplitude. The gray shadows and the blue lines (top) represent the 95% confidence intervals (CIs) and the average spike rate over time for all neurons. The bar graphs and error bars (bottom) display the mean spike rate and standard deviation (SD) for all pre, during, and post-TN-DCS time epochs across different amplitude levels. A horizontal line denotes a significant increase in mean neuronal spike rate when switching from the pre-time epoch to the during-time epoch or from the during-time epoch to the post-time epoch. Each grey dot (bottom) represents a single unit. B cathodic TN-DCS: The mean neuronal spike rate increased with increasing amplitude and remained significantly higher up to 1 min after stimulation discontinuation. All figures in (B) follow the same style convention as in (A). Data were analyzed using a linear mixed-effect model followed by a two-sided Wilcoxon signed rank test with a strict Bonferroni correction. C Pie chart representing the relative number of neurons based on their response to TN-DCS. The signs “0”, “−“, and “+” indicate no change, decrease, or increase in the spike rate in response to stimulation, respectively.
Fig. 4
Fig. 4. Effect of different amplitudes, time epochs, and polarities of trigeminal nerve direct current stimulation (TN-DCS) on neuronal spike rate in the mesencephalic nucleus (MeV) of the trigeminal nerve.
A Anodic TN-DCS (n = 10): The mean neuronal spike rate increased with amplitude. B Cathodic TN-DCS (n = 4): The mean neuronal spike rate increased with amplitude. The gray shadows and the blue lines represent the 95% confidence intervals (CIs) and the average spike rate over time for all neurons. The bar graphs and error bars display the mean spike rate and standard deviation (SD) for all pre, during, and post-TN-DCS time epochs across different amplitude levels and polarities. A horizontal line denotes a significant increase in mean neuronal spike rate when switching from the pre-time epoch to the during-time epoch or from the during-time epoch to the post-time epoch. Each grey dot represents a single unit. Data were analyzed using a linear mixed-effect model followed by a two-sided Wilcoxon signed rank test with a strict Bonferroni correction. C Pie chart representing the relative number of neurons based on their response to TN-DCS. The signs “0”, “−“, and “+” indicate no change, decrease, or increase in the spike rate in each amplitude, respectively.
Fig. 5
Fig. 5. Effect of trigeminal nerve direct current stimulation (TN-DCS) at 3 mA amplitude on neurons’ spike rate in the trigeminal nerve’s principal sensory nucleus (NVsnpr) with and without xylocaine injection.
A significant decrease in neuronal spike rate is observed after xylocaine injection (right panel). The gray shadows and the blue lines (top) represent the 95% confidence intervals (CIs) and the average spike rate over time for all neurons. The bar graphs and error bars (bottom) display the mean spike rate and standard deviation (SD) for all pre, during, and post-TN-DCS time epochs across different amplitude levels. A horizontal line denotes a significant increase in mean neuronal spike rate when switching from the pre-time epoch to the during-time epoch or from the during- to the post-time epoch. Each grey dot (bottom) represents a single unit. Data were analyzed using a linear mixed-effect model followed by a two-sided Wilcoxon signed rank test with a strict Bonferroni correction.
Fig. 6
Fig. 6. Effect of trigeminal nerve direct current stimulation (TN-DCS) at 3 mA amplitude on neurons’ spike rate in the trigeminal nerve’s mesencephalic nucleus (MeV) with and without xylocaine injection. Following xylocaine administration, a significant reduction in neuronal spike rate is seen (right panel).
The average spike rate over time for all neurons is shown by the blue lines at the top and the gray shadows on the 95% confidence intervals (CIs). The mean spike rate and standard deviation (SD) for each pre-, during-, and post-TN-DCS time epoch across various amplitude levels are shown in the bar graphs and error bars (bottom). A move from the pre-time to the during-time or from the during- to the post-time epoch results in a considerable rise in mean neuronal spike rate, as indicated by a horizontal line. Each grey dot (bottom) represents a single unit. Data were analyzed using a linear mixed-effect model followed by a two-sided Wilcoxon signed rank test with a strict Bonferroni correction.
Fig. 7
Fig. 7. Effect of different amplitudes, time epochs, and polarities of a standard transcranial direct current stimulation (tDCS) on neuronal spike rate in the mesencephalic nucleus (MeV) of the trigeminal nerve.
A Anodic tDCS (n = 4): As amplitude increased, the mean neuronal spike rate remained unchanged. B Cathodic tDCS (n = 4): As amplitude increased, the mean neuronal spike rate remained unchanged. The average spike rate over time for all neurons is shown by the blue lines and the gray shadows, respectively, and the 95% confidence intervals (CIs). For each before, during, and post-tDCS time epochs across various amplitude levels and polarities, the mean spike rate and standard deviation (SD) are shown in bar graphs and error bars. Every gray dot stands for a single unit. Data were analyzed using a linear mixed-effect model followed by a two-sided Wilcoxon signed rank test with a strict Bonferroni correction .C Pie chart representing the relative number of neurons based on their response to TN-DCS. The signs “0”, “−”, and “+” indicate no change, decrease, or increase in the spike rate in each amplitude, respectively.

Update of

Similar articles

References

    1. Nitsche MA, Paulus W. Sustained excitability elevations induced by transcranial DC motor cortex stimulation in humans. Neurology. 2001;57:1899–901. - PubMed
    1. Mutz J, Edgcumbe DR, Brunoni AR, Fu CHY. Efficacy and acceptability of non-invasive brain stimulation for the treatment of adult unipolar and bipolar depression: a systematic review and meta-analysis of randomised sham-controlled trials. Neurosci Biobehav Rev. 2018;92:291–303. - PubMed
    1. van Boekholdt L, Kerstens S, Khatoun A, Asamoah B, Mc Laughlin M. tDCS peripheral nerve stimulation: a neglected mode of action? Mol Psychiatry. 2021;26:456–61. - PubMed
    1. Nitsche MA, Paulus W. Excitability changes induced in the human motor cortex by weak transcranial direct current stimulation. J Physiol. 2000;527:633–9. - PMC - PubMed
    1. Vöröslakos M, Takeuchi Y, Brinyiczki K, Zombori T, Oliva A, Fernández-Ruiz A, et al. Direct effects of transcranial electric stimulation on brain circuits in rats and humans. Nat Commun. 2018;9:483. - PMC - PubMed

LinkOut - more resources