. 2024 Oct 11:15:1403155.
doi: 10.3389/fimmu.2024.1403155. eCollection 2024.

Protein kinase D1 in myeloid lineage cells contributes to the accumulation of CXCR3+CCR6+ nonconventional Th1 cells in the lungs and potentiates hypersensitivity pneumonitis caused by S. rectivirgula

Affiliations

Protein kinase D1 in myeloid lineage cells contributes to the accumulation of CXCR3+CCR6+ nonconventional Th1 cells in the lungs and potentiates hypersensitivity pneumonitis caused by S. rectivirgula

John D Snyder et al. Front Immunol. .

Erratum in

Abstract

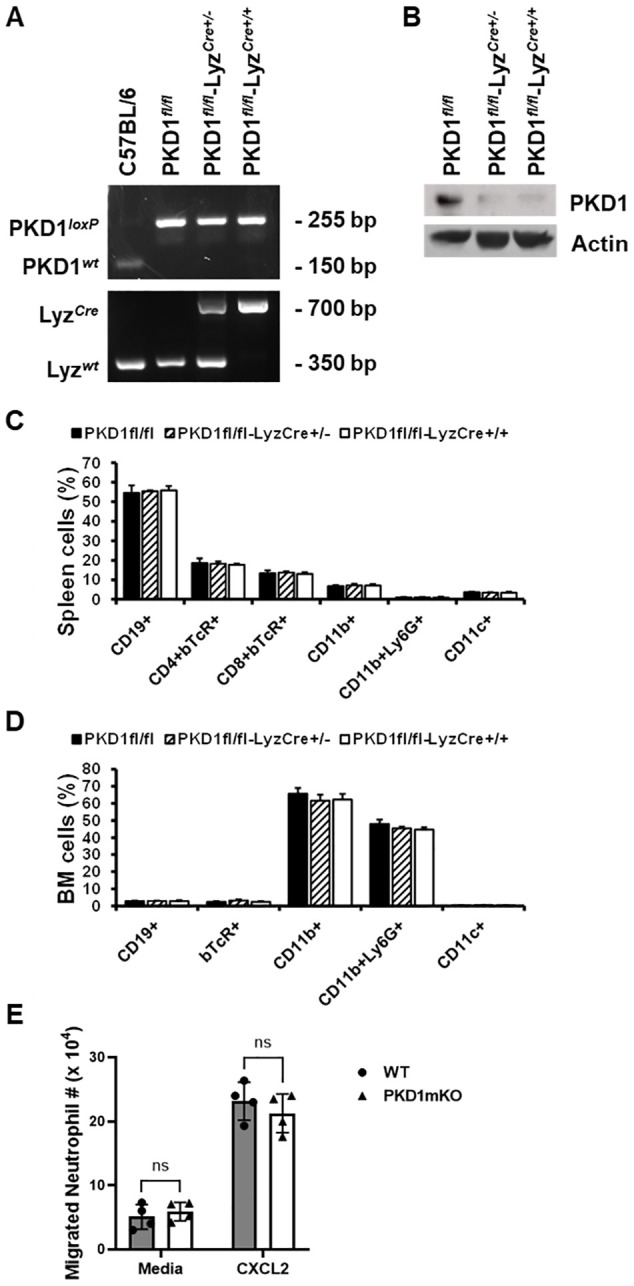
Introduction: Hypersensitivity pneumonitis (HP) is an extrinsic allergic alveolitis characterized by inflammation of the interstitium, bronchioles, and alveoli of the lung that leads to granuloma formation. We previously found that activation of protein kinase D1 (PKD1) in the lungs following exposures to Saccharopolyspora rectivirgula contributes to the acute pulmonary inflammation, IL-17A expression in the lungs, and development of HP. In the present study, we investigated whether PKD1 in myeloid-lineage cells affects the pathogenic course of the S. rectivirgula-induced HP.

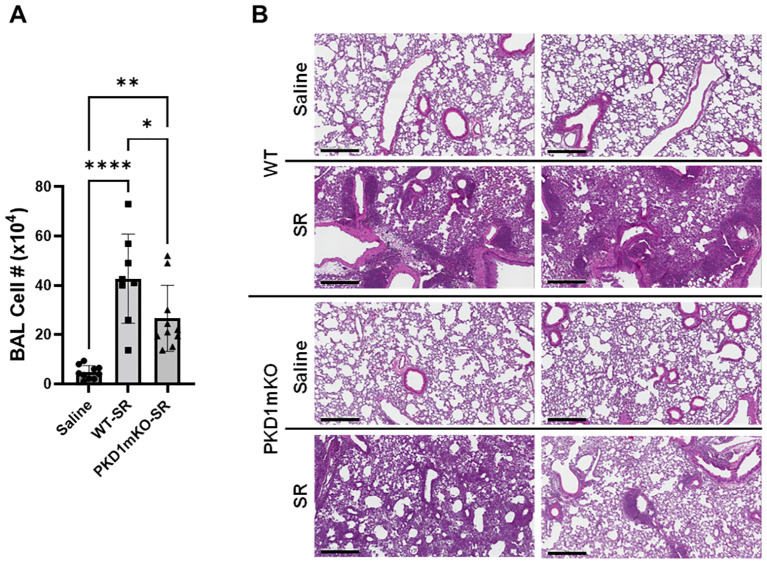
Methods: Mice were exposed intranasally to S. rectivirgula once or 3 times/week for 3 weeks. The protein and mRNA expression levels of cytokines/chemokines were detected by enzyme-linked immunosorbent assay and quantitative real-time PCR, respectively. Flow cytometry was used to detect the different types of immune cells and the levels of surface proteins. Lung tissue sections were stained with hematoxylin and eosin, digital images were captured, and immune cells influx into the interstitial lung tissue were detected.

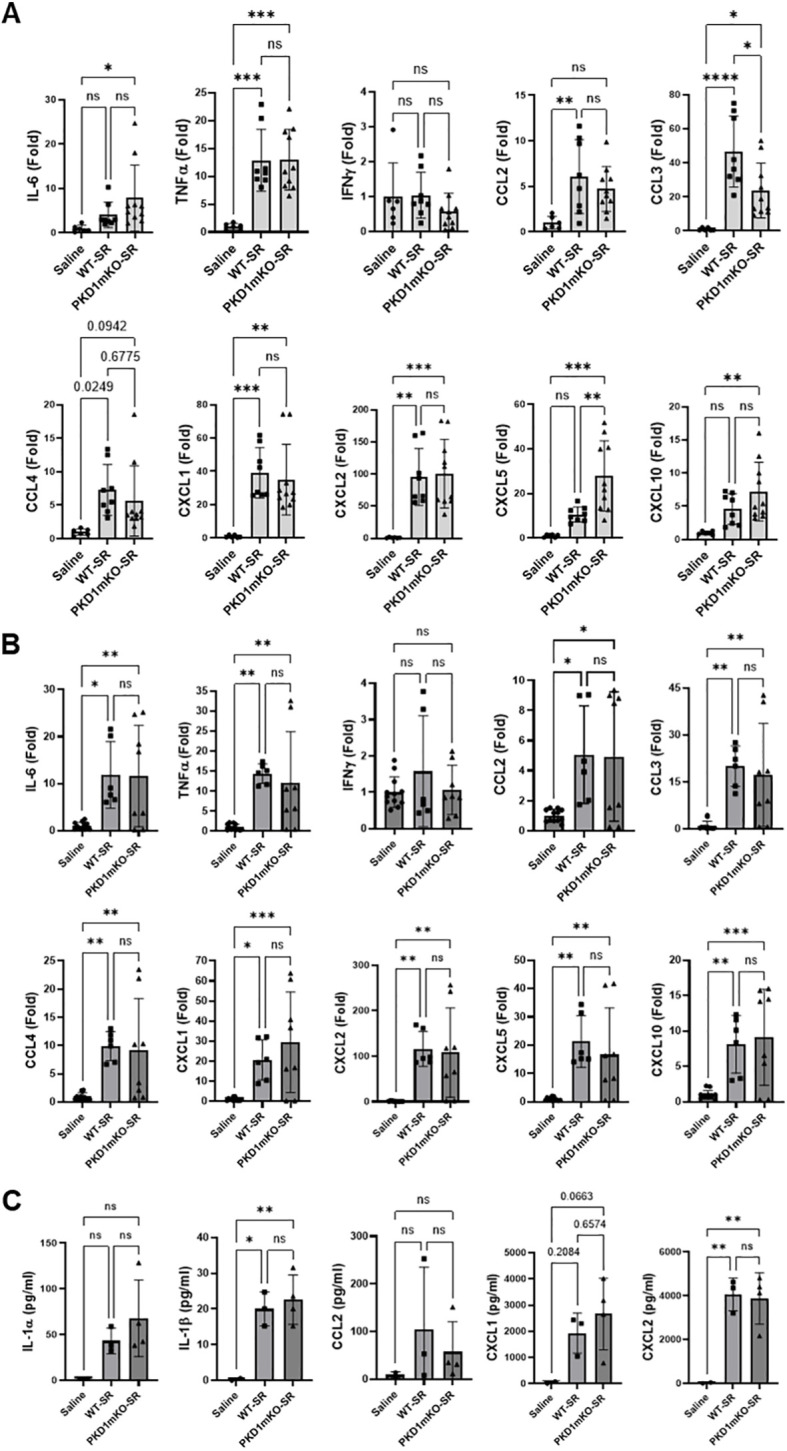
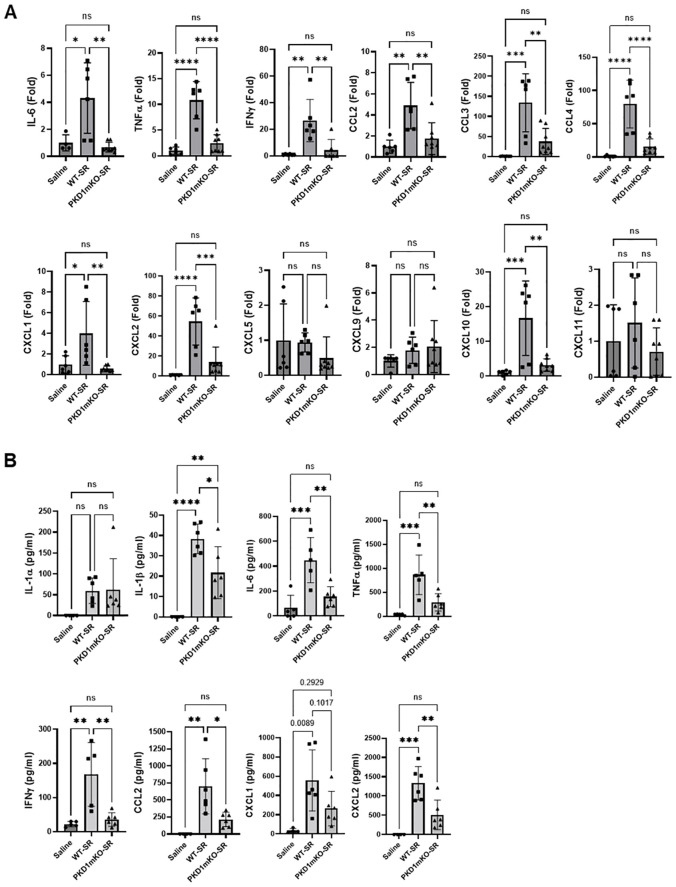
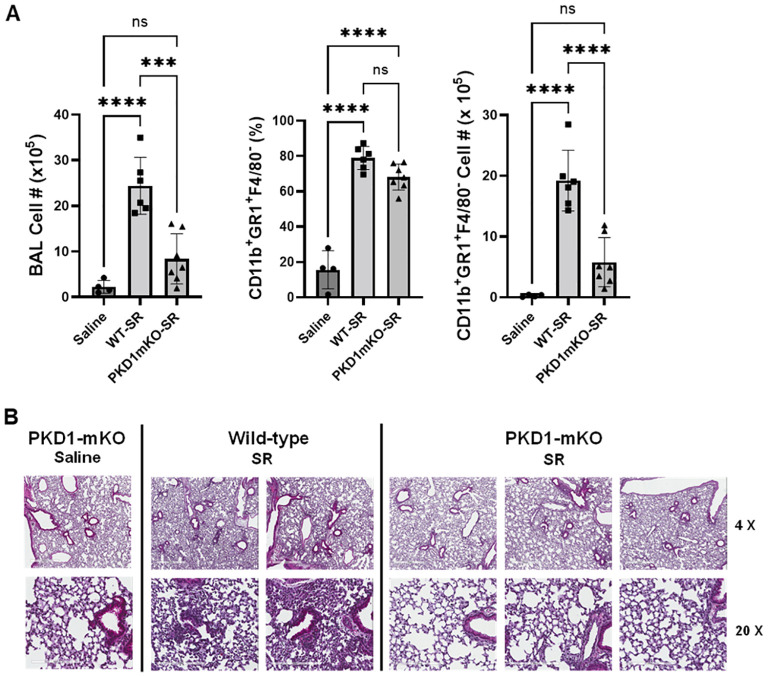
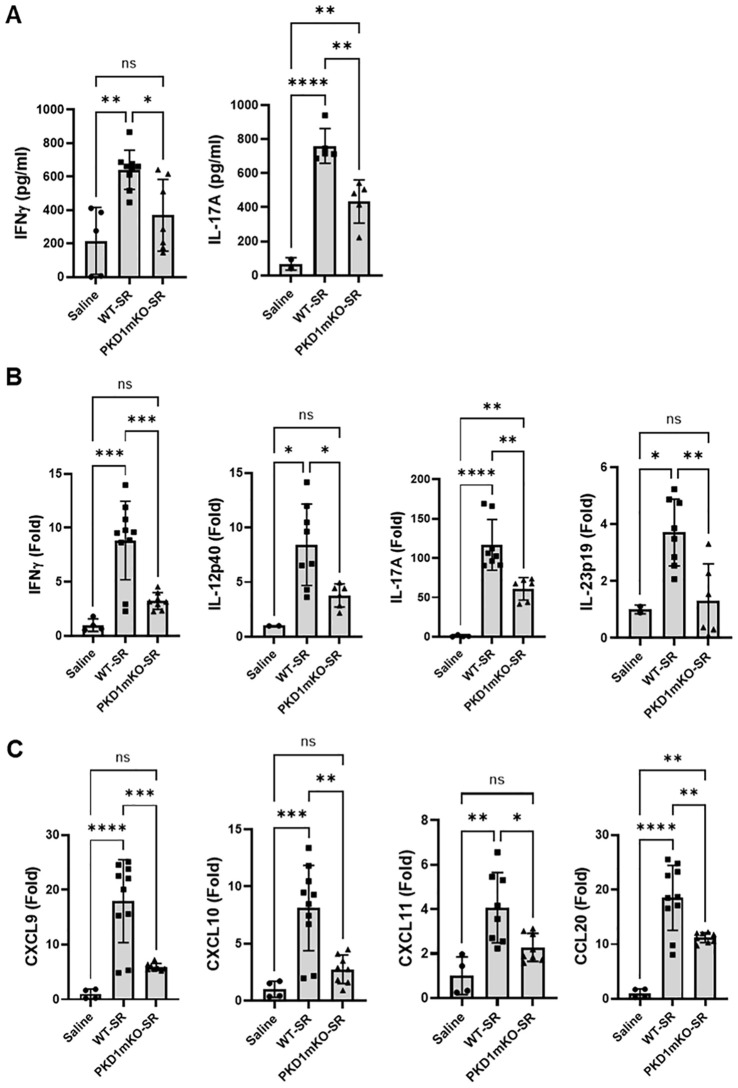
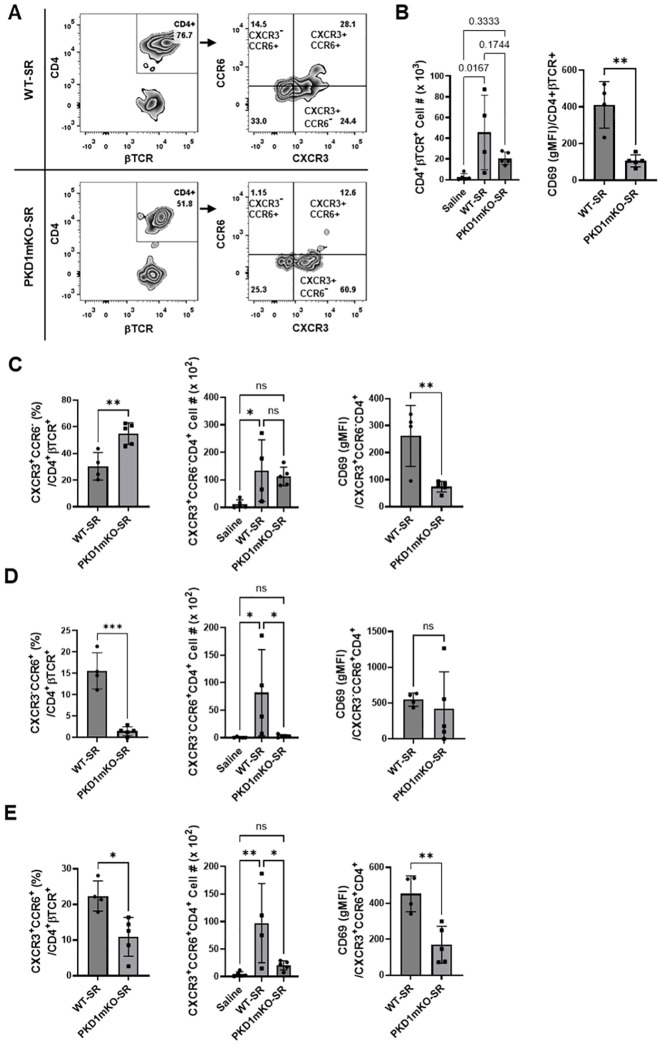
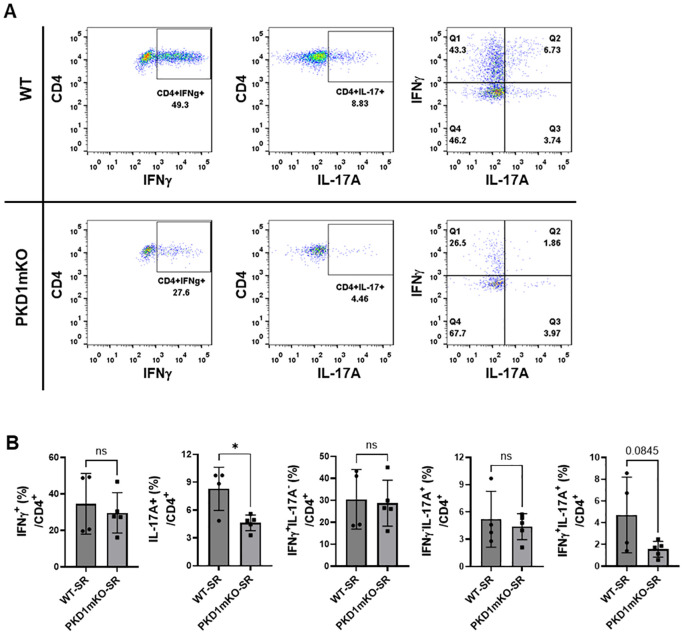
Results: Compared to control PKD1-sufficient mice, mice with PKD1 deficiency in myeloid-lineage cells (PKD1mKO) showed significantly suppressed expression of TNFα, IFNγ, IL-6, CCL2, CCL3, CCL4, CXCL1, CXCL2, and CXCL10 and neutrophilic alveolitis after single intranasal exposure to S. rectivirgula. Substantially reduced levels of alveolitis and granuloma formation were observed in the PKD1mKO mice repeatedly exposed to S. rectivirgula for 3 weeks. In addition, expression levels of the Th1/Th17 polarizing cytokines and chemokines such as IFNγ, IL-17A, CXCL9, CXCL10, CXCL11, and CCL20 in lungs were significantly reduced in the PKD1mKO mice repeatedly exposed to S. rectivirgula. Moreover, accumulation of CXCR3+CCR6+ nonconventional Th1 in the lungs were significantly reduced in PKD1mKO mice repeatedly exposed to S. rectivirgula.

Discussion: Our results demonstrate that PKD1 in myeloid-lineage cells plays an essential role in the development and progress of HP caused by repeated exposure to S. rectivirgula by contributing Th1/Th17 polarizing proinflammatory responses, alveolitis, and accumulation of pathogenic nonconventional Th1 cells in the lungs.

Keywords: Saccharopolyspora rectivirgula; alveolitis; cytokines/chemokines; hypersensitivity pneumonitis; inflammation; protein kinase D1; toll-like receptor signaling.


Conflict of interest statement

The authors declare that the research was conducted in the absence of any commercial or financial relationships that could be construed as a potential conflict of interest.

Figures

Figure 1
Figure 1
Genotypic and phenotypic analysis of myeloid lineage cell-specific PKD1-deficient mice. (A) Genomic DNA was isolated from tail and analyzed for PKD1 alleles and LyzCre by PCR. PCR products corresponding to PKD1 WT (151 bp), PKD1 loxP (255 bp), LyzWT (350 bp), and LyzCre (700 bp) are shown. (B) Neutrophils from bone marrow were isolated. Neutrophil lysates were prepared, and protein levels of PKD1 and actin were detected by Western blot assay. Actin was used as a loading control. (C, D) For immune cell profiling, cells isolated from spleen (C) and bone marrow (D) of PKD1 fl/fl (wild type; WT; n = 5), PKD1 fl/fl -Lyz Cre+/- (PKD1mKO; n = 3), or PKD1 fl/fl -Lyz Cre+/+ (PKD1mKO; n = 4) were analyzed by flow cytometry. Gating strategies for flow cytometric analysis of spleen cells and bone marrow (BM) cells are shown in Supplementary Figures 1A, B , respectively. Frequency of each cell population (mean % ± SD) is expressed as the percentage of CD45+ cells. Statistically significant differences determined by one-way ANOVA with Tukey’s post-hoc test. (E) One milliliter of media or murine recombinant CXCL2 (50 ng/mL) was placed into the bottom chamber of each designated well in a 24-well plate and 5 × 10⁵ bone marrow neutrophils (isolated from PKD1 fl/fl or PKD1 fl/fl -Lyz Cre+/- ) in 200 µL of media were placed into the top chamber. Two hours later, neutrophils that migrated into the bottom chamber and the bottom chamber side of the membrane were collected and counted. Data represent the mean cell # of quadruplicates ± SD. Significance was determined by two-tailed Student’s t-test. ns, not significant.
Figure 2
Figure 2
PKD1 in myeloid lineage cells is dispensable for the initial cytokine and chemokine expression in the lungs of mice in response to S. rectivirgula inhalation. PKD1 fl/fl mice (WT) and PKD1 fl/fl -LyZ Cre mice (PKD1mKO) were exposed intranasally to saline or S. rectivirgula (100 μg) for 2 h (A) or 6 h (B, C). (A, B) Total RNA was purified from lung lobes isolated from each individual mouse and reverse transcribed, and then mRNA levels of the indicated genes were analyzed in duplicate by real-time qPCR using SYBR Green Assay. The data on genes that were differentially expressed were normalized to the expression of the housekeeping gene [Actin for panel (A) and GAPDH for panel (B)]. Fold change comparing S. rectivirgula-exposed WT mice and S. rectivirgula-exposed PKD1mKO mice to control saline-exposed mice were calculated by comparative quantification algorithm-delta delta Ct method (fold difference = 2−ΔΔCt). Data represent the mean (Fold) ± SD. (C) Bronchoalveolar lavage (BAL) was performed. Levels of the indicated cytokines and chemokines in BAL fluid were detected by multiplex sandwich assay. Data present the mean concentration (pg/mL) ± SD. Number of mice used for each group is as follows: Saline, n = 2 to 6; WT-SR, n = 3 to 4; PKD1mKO-SR, n = 4 to 5. Statistically significant difference determined by one-way ANOVA with Tukey’s post-hoc test is indicated (*p < 0.05; **p < 0.01; ***p < 0.001; ****p < 0.0001). ns, not significant.
Figure 3
Figure 3
Contribution of PKD1 in myeloid lineage cells to the proinflammatory responses in the lung of mice following one-time exposure to S. rectivirgula. PKD1 fl/fl mice (WT) and PKD1 fl/fl -LyZ Cre mice (PKD1mKO) were exposed intranasally to saline or S. rectivirgula (80 μg) for 24 (h) (A) Total RNA was purified from lung lobes isolated from each individual mouse and reverse transcribed, and then mRNA levels of the indicated genes were analyzed in duplicate by real-time qPCR using SYBR Green Assay. The data on genes that were differentially expressed were normalized to the expression of the housekeeping gene, GAPDH. Fold change comparing S. rectivirgula-exposed WT mice and S. rectivirgula-exposed PKD1mKO mice to control saline-exposed mice were calculated by comparative quantification algorithm-delta delta Ct method (Fold difference = 2−ΔΔCt). Data represent the mean (Fold) ± SD. (B) Bronchoalveolar lavage (BAL) was performed. Levels of the indicated cytokines and chemokines in BAL fluid were detected by either ELISA (IL-6, TNFα, and IFNγ) or multiplex sandwich assay (IL-1α, IL-1β, CCL2, CXCL1, and CXCL2). Data represent the mean concentration (pg/mL) ± SD. Number of mice used for each group is as follows: Saline, n = 3 to 5; WT-SR, n = 3 to 6; PKD1mKO-SR, n = 4 to 6. Statistically significant difference determined by one-way ANOVA with Tukey’s post-hoc test is indicated (*p < 0.05; **p < 0.01; ***p < 0.001; ****p < 0.0001). ns, not significant.
Figure 4
Figure 4
PKD1 in myeloid lineage cells contributes significantly to the neutrophilic alveolitis developed following single exposure to S. rectivirgula. PKD1 fl/fl mice (WT) and PKD1 fl/fl -LyZ Cre mice (PKD1mKO) were exposed intranasally to saline or S. rectivirgula (80 μg) for 24 h. (A) BAL cells were counted using trypan blue exclusion and presented as the mean cell number ± SD (left panels). Total neutrophil cell count was derived by staining BAL cells with Abs to Gr-1, CD11b, and F4/80 followed by flow cytometric analysis. Gating strategy for flow cytometric analysis is shown in Supplementary Figure 2 . Neutrophils were identified as CD11b+Gr1+/F4/80-. The frequency of neutrophils is expressed as % in BAL cells, and data represent the mean (%) ± SD (middle panels). The number of neutrophils is presented as the mean cell number ± SD (right panels). Statistical differences were determined by one-way ANOVA with Tukey’s post-hoc test and significant differences are indicated (***p < 0.001; ****p < 0.0001). ns, not significant. (B) Representative H&E staining of the left lung lobe sections from mice exposed to saline or SR for 24 h are shown. The Aperio ScanScope®XT Slide Scanner system was used to capture whole-slide digital images. Each column represents the lung collected from an individual mouse. The images presented are 4× magnification (scale bar = 600 μm) and 20× magnification (scale bar = 200 µm). Number of mice used for each group is as follows: Saline, n = 3 to 11; WT-SR, n = 3 to 6; PKD1mKO-SR, n = 4 to 7.
Figure 5
Figure 5
Deletion of PKD1 in myeloid lineage cells results in significant reduction in alveolitis and granuloma formation following repeated exposures to S. rectivirgula. PKD1 fl/fl mice (WT) and PKD1 fl/fl -LyZ Cre mice (PKD1mKO) were exposed intranasally to saline or S. rectivirgula (100 μg) three times per week for 3 weeks. (A) Seventy-two hours after the last SR exposure, BAL was performed, and the BAL cells recovered. BAL cells were counted to determine the degree of alveolitis using trypan blue exclusion. Data represent the mean cell number ± SD (n = 8 to 10 mice/group). Significance was determined by one-way ANOVA with Tukey’s post-hoc test. Statistically significant differences are indicated (*p < 0.05; **p < 0.01; ****p < 0.0001). (B) Forty-eight hours after the last S. rectivirgula exposure, the left lung lobes were removed from the mice. Representative H&E staining of the left lung lobe sections are shown. The Aperio ScanScope®XT Slide Scanner system was used to capture whole-slide digital images. Each panel represents the lung collected from an individual mouse. Number of mice used for each group is as follows: Saline, n = 4; WT-SR, n = 4; PKD1mKO-SR, n = 3. The scale bar = 300 µm.
Figure 6
Figure 6
PKD1 in myeloid lineage cells contributes to the expression of MHC-II in neutrophils and macrophages infiltrated into the bronchial space and lung interstitium following repeated exposures to S. rectivirgula. WT (n = 5 to 6/group) or PKD1mKO mice (n = 5/group) were exposed intranasally to S. rectivirgula (100 μg) three times per week for 3 weeks. BAL cells (A) and LICs (B) were isolated from mice at 48 h after the last S. rectivirgula exposure. Cells were stained with fluorochrome-conjugated Abs and then analyzed by flow cytometry and FlowJo flow software. Gating strategies for flow cytometric analysis of BAL cells and LICs are shown in Supplementary Figures 3A, B , respectively. Levels of surface expression of MHC-II on cells were determined by geometric mean fluorescent intensity (gMFI) of each marker in the indicated cell population. Each dot or square represents individual mouse. Data represent the mean gMFI ± SD. Significance was determined by two-tailed Student’s t-test. Statistically significant differences are indicated (*p < 0.05; **p < 0.01). ns, not significant.
Figure 7
Figure 7
PKD1 in myeloid lineage cells contributes to the increased expression of Th1/Th17-related cytokines and chemokines in lungs following repeated exposures to S. rectivirgula. PKD1 fl/fl mice (WT) and PKD1 fl/fl -LyZ Cre mice (PKD1mKO) were exposed intranasally to saline or S. rectivirgula (100 μg) three times per week for 3 weeks. Forty-eight hours after the last S. rectivirgula exposure, BALF and the lungs were collected. (A) Levels of the indicated cytokines IFNγ and IL-17A in BALF were detected by ELISA. Data represent the mean (pg/mL) ± SD. Each symbol represents individual mouse. Significance was determined by one-way ANOVA with Tukey’s post-hoc test. Statistically significant differences are indicated (*p < 0.05; **p < 0.01; ****p < 0.0001). ns = not significant. Number of mice used for each group is as follows: Saline, n = 2 to 5; WT-SR, n = 5 to 9; PKD1mKO-SR, n = 5 to 7. (B, C) Total RNA was purified from lung lobes isolated from each individual mouse and reverse transcribed. mRNA levels of the indicated genes were analyzed in duplicates by RT-qPCR using SYBR Green Assay. The data on genes that were differentially expressed was normalized to the expression of the housekeeping gene, GAPDH. Fold change comparing SR-treated exposed WT mice and SR-treated PKD1mKO mice to control mice exposed to saline was calculated by comparative quantification algorithm-delta delta Ct method (Fold difference = 2−ΔΔCt). Data represent the mean (Fold) ± SD. Significance was determined by one-way ANOVA with Tukey’s post-hoc test. Statistically significant differences are indicated (*p < 0.05; **p < 0.01; ***p < 0.001; ****p < 0.0001). ns, not significant. Number of mice used for each group is as follows: Saline, n = 1 to 2; WT-SR, n = 4 to 5; PKD1mKO-SR, n = 3 to 4.
Figure 8
Figure 8
Effects of myeloid lineage cell-specific PKD1 on CXCR3+CCR6+ cell accumulation in the lungs following repeated exposures to S. rectivirgula. PKD1 fl/fl mice (WT) and PKD1 fl/fl -LyZ Cre mice (PKD1mKO) were exposed intranasally to saline or SR (100 μg) three times per week for 3 weeks. Seventy-two hours after the last S. rectivirgula challenge, BAL cells were stained with fluorochrome-conjugated Abs and then analyzed by flow cytometry and FlowJo flow software. Gating strategies for flow cytometric analysis of CD4+ T cells in BAL cells are shown in Supplementary Figure 3A . (A) Gating of CD4+ T cells for CXCR3 and CCR6 expression. (B–E) The frequency of CXCR3+CCR6- cells, CXCR3-CCR6+ cells, or CXCR3+CCR6+ cells in the CD4+ T-cell population is expressed as % in the CD4+βTCR+ cell population. The number of CD4+βTCR+ cells, CXCR3+CCR6-CD4+βTCR+ cells, CXCR3-CCR6+CD4+βTCR+ cells, and CXCR3+CCR6+CD4+βTCR+ recovered from BAL was derived by staining BAL cells with Abs to CXCR3, CCR6, CD4, and βTCR followed by flow cytometric analysis. Levels of surface expression of CD69 on CXCR3+CCR6-CD4+ T cells, CXCR3-CCR6+CD4+ T cells, or CXCR3+CCR6+CD4+ T cells were determined by geometric mean fluorescent intensity (gMFI) of CD69 in each cell population. Data represent the mean ± SD. Significance was determined by two-tailed Student’s t-test (for two groups) or by one-way ANOVA with Tukey’s post-hoc test (for three groups). Statistically significant differences are indicated (*p < 0.05; **p < 0.01; ***p < 0.001). ns, not significant. Each symbol represents individual mouse. Number of mice used for each group is as follows: Saline, n = 4; WT-SR, n = 4; PKD1mKO-SR, n = 5.
Figure 9
Figure 9
Effects of myeloid lineage cell-specific PKD1 on Th1/Th17 cell accumulation in the lungs following repeated exposures to S. rectivirgula. PKD1 fl/fl mice (WT) and PKD1 fl/fl -LyZ Cre mice (PKD1mKO) were exposed intranasally to SR (100 μg) three times per week for 3 weeks. Seventy-two hours after the last S. rectivirgula challenge, LICs were collected. LICs were stimulated with PMA plus ionomycin and then processed for intracellular IL-17A and IFNγ detection as described in Materials and Methods. Stained LICs were then subjected to flow cytometric analysis. (A) Gating of CD4+ T cells for IFNγ and/or IL-17A expression. (B) The frequency of IFNγ+, IL-17A+, IFNγ+IL-17A- cells (Q1), IFNγ+IL-17A+ cells (Q2), or IFNγ-IL-17A+ cells (Q3) in the CD4+ T-cell population is expressed as % in the CD4+ cell population. Data represent the mean ± SD. Significance was determined by two-tailed Student’s t-test. Statistically significant differences are indicated (*p < 0.05). ns, not significant. Each symbol represents individual mouse. Number of mice used for each group is as follows: WT-SR, n = 4; PKD1mKO-SR, n = 5.

Similar articles

References

    1. Barnes H, Troy L, Lee CT, Sperling A, Strek M, Glaspole I. Hypersensitivity pneumonitis: Current concepts in pathogenesis, diagnosis, and treatment. Allergy. (2022) 77:442–53. doi: 10.1111/all.15017 - DOI - PubMed
    1. Girard M, Lacasse Y, Cormier Y. Hypersensitivity pneumonitis. Allergy. (2009) 64:322–34. doi: 10.1111/j.1398-9995.2009.01949.x - DOI - PubMed
    1. Agostini C, Trentin L, Facco M, Semenzato G. New aspects of hypersensitivity pneumonitis. Curr Opin Pulm Med. (2004) 10:378–82. doi: 10.1097/01.mcp.0000133067.71469.b2 - DOI - PubMed
    1. Salvaggio JE, deShazo RD. Pathogenesis of hypersensitivity pneumonitis. Chest. (1986) 89:190s–3s. doi: 10.1378/chest.89.3_Supplement.190S - DOI - PubMed
    1. Richerson HB, Bernstein IL, Fink JN, Hunninghake GW, Novey HS, Reed CE, et al. . Guidelines for the clinical evaluation of hypersensitivity pneumonitis. Report of the Subcommittee on Hypersensitivity Pneumonitis. J Allergy Clin Immunol. (1989) 84:839–44. doi: 10.1016/0091-6749(89)90349-7 - DOI - PubMed

LinkOut - more resources