. 2024 Nov 27;52(21):12878-12894.
doi: 10.1093/nar/gkae949.

YY1 is a transcriptional activator of the mouse LINE-1 Tf subfamily

Affiliations

YY1 is a transcriptional activator of the mouse LINE-1 Tf subfamily

Karabi Saha et al. Nucleic Acids Res. .

Abstract

Long interspersed element type 1 (LINE-1, L1) is an active autonomous transposable element in human and mouse genomes. L1 transcription is controlled by an internal RNA polymerase II promoter in the 5' untranslated region (5'UTR) of a full-length L1. It has been shown that transcription factor YY1 binds to a conserved sequence at the 5' end of the human L1 5'UTR and primarily dictates where transcription initiates. Putative YY1-binding motifs have been predicted in the 5'UTRs of two distinct mouse L1 subfamilies, Tf and Gf. Using site-directed mutagenesis, in vitro binding and gene knockdown assays, we experimentally tested the role of YY1 in mouse L1 transcription. Our results indicate that Tf, but not Gf subfamily, harbors functional YY1-binding sites in 5'UTR monomers and YY1 functions as a transcriptional activator for the mouse Tf subfamily. Activation of Tf transcription by YY1 during early embryogenesis is also supported by a reanalysis of published zygotic knockdown data. Furthermore, YY1-binding motifs are solely responsible for the synergistic interaction between Tf monomers, consistent with a model wherein distant monomers act as enhancers for mouse L1 transcription. The abundance of YY1-binding sites in Tf elements also raise important implications for gene regulation across the genome.


Figures

Graphical Abstract
Graphical Abstract
Figure 1.
Figure 1.
Effect of YY1 motif mutants on Tf_I promoter activity in F9 cells. (A) Alignment of Tf_I monomer 2 (M2) and monomer 1 (M1) consensus sequences. A schematic of mouse L1 containing four monomers is shown at the top (not to scale; T, tether). In the M1 sequence, nucleotide positions identical to M2 are marked by asterisks. Sequence gaps are represented by dashes. A previously predicted YY1-binding motif is located between nts 77–88 (solid box, termed ‘motif 1’). Toward the 5′ end of the monomers is another stretch of nucleotides highly similar to the consensus YY1-binding motif (dashed box, termed ‘pseudo motif’, which will be examined in later sections). (B) Mouse and human YY1-binding motif models from the HOCOMOCO database. (C) Normalized promoter activity of M2 constructs. Mutation to consensus YY1-binding motif 1 (GCCAT) is indicated by lowercases in red. (D) Normalized promoter activity of M1 and M1–Tether (M1–T) constructs. (E) Normalized promoter activity of M2–M1–T constructs. Mutation to one monomer at a time showed activity from the other monomer and tether. For panels (C–E), sequence organization of the promoters is illustrated on the left side. The length of M2, M1 and tether for each promoter is annotated (in base pairs). The dashed line represents domain(s) that were removed in reference to the two-monomer 5′UTR sequence (M2–M1–T). The x-axis indicates the normalized promoter activity, which is also listed under column ‘promoter activity’ for each promoter variant. The positive control construct, pCH117, had a normalized promoter activity of 355.0. Error bars represent standard errors of the mean (n = 4).
Figure 2.
Figure 2.
Interaction of YY1 protein with motif 1 is weakened by cytosine methylation in a strand-specific manner. (A) Wild-type and mutant DNA fragments used in EMSA. Each fragment was formed by annealing a sense stranded oligo (shown) with the corresponding antisense oligo (not shown). Mutations in the core binding motif are indicated by lowercases in red. (B) EMSA with Tf_I motif 1 fragments. The presence or absence of a biotin-labeled WT probe, antibody and nuclear protein extract from F9 cells is indicated by ‘+’ or ‘−’ symbols. Lane 3 had YY1-specific antibody and lane 4 had mouse IgG as a control. Lanes 5–10 had unlabeled DNA fragments as competitors in molar excess as indicated. (C) EMSA using unmethylated and variably methylated Tf_I motif 1 DNA fragments as probes. The complete sequence of the unmethylated fragment is shown at the top with the CpG dinucleotide boxed. Probes used for specific lanes are indicated by the CpG position (m, 5-methylcytosine; *, the 5′ biotin label). (D) EMSA using unmethylated and variably methylated Tf_I motif 1 fragments as competitor. A biotin-labeled unmethylated WT probe is used. Competitors used for specific lanes are indicated by the central motif (m, 5-methylcytosine). To facilitate comparison, reactions were run on two gels, processed and imaged simultaneously. (E) EMSA using mutant fragments at CpG position as competitor. A biotin-labeled unmethylated WT probe is used. The presence or absence of nuclear protein extract from F9 cells is indicated by ‘+’ or ‘−’ symbols for all panels.
Figure 3.
Figure 3.
Knockdown of YY1 protein and its impact on the Tf_I promoter activity. (A) Western blot analysis of YY1 protein knockdown. NIH/3T3 cells were transfected with four YY1-specific siRNAs individually or as a pool. After 72 h whole cell lysates were probed for YY1 protein (top panel). Yy1_1 and Yy1_7 showed efficient knockdown compared to the control siRNA (Allstars). The YY1 protein signal was normalized to either histone H3 (middle panel) or fluorescent stain-free total protein signal (lower panel). (B) Normalized promoter activity for three Tf_I promoter constructs (M2, M1 and M2–M1–T) under siRNA knockdown. For each promoter variant, cells were cotransfected with the promoter construct and with or without a siRNA (y-axis; none = no siRNA). In reference to cells treated with Allstars, Yy1_1 siRNA treated cells showed 34.3%, 30.1% and 36.7% of the activity for M2, M1 and M2–M1–T, respectively. In comparison, Yy1_7 treated cells showed 44.7%, 46.7% and 54.0% of the activity for M2, M1 and M2–M1–T (marked as 2MT), respectively. The positive control construct, pCH117, had a normalized promoter activity of 1222.8. Error bars represent standard errors of the mean (n = 4). The inset illustrates the promoter constructs used. (C) Mouse L1 Tf_I promoter activity from a chromosomally integrated reporter under siRNA knockdown. A stable HCT116 cell line carrying an integrated mouse L1 Tf_I 5′UTR-Fluc reporter transgene was transfected with or without a siRNA (y-axis; none = no siRNA). In reference to cells treated with Allstars, Yy1_1h and Yy1_7 siRNA treated cells showed 44.7% and 42.3% in Fluc activity, 69.3% and 67.1% in cell viability (via CellTiter Blue assays), and 64.6% and 63.1% in normalized promoter activity (i.e. ratio of Fluc over cell viability), respectively. Error bars represent standard errors of the mean (n = 4).
Figure 4.
Figure 4.
Effect of YY1 on human L1 promoter activity. (A) Western blot analysis of YY1 protein knockdown. HCT116 cells were transfected with individual YY1-specific siRNAs. After 72 h whole cell lysates were probed for YY1 protein (top panel). Yy1_1h and Yy1_7 showed efficient knockdown compared to the control siRNA (Allstars). The YY1 protein signal was normalized to either histone H3 (middle panel) or fluorescent stain-free total protein signal (lower panel). F9 cells were used as a control. (B) Competition EMSA using wild-type and mutant human L1 promoter fragments. Each fragment was formed by annealing a sense stranded oligo (shown) with the corresponding antisense oligo (not shown). Mutation in the core binding motif is indicated by lowercase in red. The presence or absence of a biotin-labeled Tf_I WT probe and nuclear protein extract from F9 cells is indicated by ‘+’ or ‘−’ symbols. Lanes 3–5 had unlabeled DNA fragments as competitors in 200-fold molar excess as indicated. A shift was observed in the presence of nuclear protein extract (lane 2). The shift was diminished by unlabeled WT Tf_I fragment (lane 3) and WT human L1 promoter fragment (hWT, lane 4) but not by unlabeled mutant human L1 promoter fragment (hMut, lane 5). All five lanes were from the same gel but they were separated by other unrelated samples; for clarity, lanes 1–3 and 4–5 were juxtaposed here. (C) Normalized promoter activity for wild-type and mutant human L1 5′UTR-Fluc reporters. Cells were transfected with either pCH117 or pKS07. The negative control construct, pLK037 is set to 1. Error bars represent standard errors of the mean (n = 4). (D) Promoter activity for human L1 5′UTR-Fluc reporter under siRNA knockdown. Cells were cotransfected with the reporter construct pCH117 and with or without an siRNA (y-axis; none = no siRNA). In reference to cells treated with the negative control siRNA (Allstars), Yy1_1h and Yy1_7 siRNA treated cells showed 73.8% and 63.0% in Fluc luminescence signal (left panel), respectively, and 57.0% and 56.8% in normalized promoter activity (right panel; the negative control construct, pLK037 is set to 1), respectively, after normalizing against Rluc luminescence (middle panel). In this assay, pCH117 without siRNA had a normalized promoter activity of 246. Error bars represent standard errors of the mean (n = 4). (E) Human L1 promoter activity from a chromosomally integrated reporter under siRNA knockdown. A stable HCT116 cell line carrying an integrated human L1 5′UTR-Fluc reporter transgene was transfected with or without an siRNA (y-axis; none = no siRNA). In reference to cells treated with the negative control siRNA (Allstars), Yy1_1h and Yy1_7 siRNA treated cells showed 64.9% and 54.6% in Fluc activity, 91.3% and 94.7% in cell viability, and 70.1% and 56.9% in normalized promoter activity (i.e. ratio of Fluc over cell viability), respectively. Error bars represent standard errors of the mean (n = 4).
Figure 5.
Figure 5.
Promoter activities of YY1 motif variants of the Gf_I subfamily in F9 cells. (A) Alignment of Gf_I M2 and M1 consensus sequences. In the M1 sequence, nucleotide positions identical to M2 are marked by asterisks. Sequence gaps are represented by dashes. A previously predicted YY1-binding motif is located between nt 54–65 (solid box, termed ‘Gf_I motif’). Promoter activity is assessed using dual-luciferase reporter assay. (B) Normalized promoter activity of M2 constructs. Mutation to Gf_I motif (GCCCT) is indicated by lowercases in red. The m2a showed minimal change in promoter activity. However, changing to the consensus YY1 motif (m2b) elevated the M2 promoter activity by 29.8-fold. (C) Normalized promoter activity of M1 constructs. The mutant monomer 1 (m1a) showed minimal change in promoter activity. Changing to the consensus (m1b) showed 6.6 times higher signal compared to M1. (D) Normalized promoter activity of monomer2–monomer1–tether (M2–M1–T or 2MT) constructs. A 3.5-fold higher activity was observed upon changing both Gf_I motifs to the consensus sequence. The positive control construct, pCH117, had a normalized promoter activity of 493.0. Error bars represent standard errors of the mean (n = 4).
Figure 6.
Figure 6.
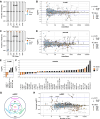
Zygotic knockdown of YY1 reduces Tf_I and Tf_II transcription in early mouse embryos. (A–F) Differential expression of genes and TEs in eight-cell embryos or morulas upon zygotic YY1 knockdown. Data were from Sakamoto et al. (38,43) and reanalyzed with TEtranscripts using repeat library db20140131. The proportions of upregulated (up), non-differentially expressed (non-DE) and downregulated (down) genes or TE subfamilies in eight-cell embryos (A) or morulas (C) are color-coded and plotted as stacked bar charts; the corresponding numbers of genes or TE subfamilies are marked. TEs are shown together (allTE) or as individual classes. log2FC of all TE subfamilies in eight-cell embryos (B) or morulas (D) are shown in MA plots. The four TE classes are color-coded as filled dots. TE subfamilies that display a statistically significant change in transcription (P < 0.05) are outlined in black. All statistically significant L1 subfamilies (black line and font; P < 0.05) as well as any remaining A, Gf and Tf subfamilies (gray line and font; P > 0.05) are labeled. Bar graphs list all statistically significant TE subfamilies in eight-cell embryos (E) or morulas (F). Note panels (B) and (D) use abbreviated subfamily names (e.g. Tf_I) while panels (E) and (F) display full names (e.g. L1MdTf_I). (G, H) Enrichment of YY1-binding among TE subfamilies in mouse embryonic stem cells (mESCs). Data were from Cusack et al. (45) and reanalyzed with T3E using repeat library db20140131. In panel G, each inner circle corresponds to the number of TE subfamilies enriched for YY1-binding in one of the three replicates (P < 0.01). (H) shows enrichment analysis of YY1-binding across 1159 TE subfamilies. The log2FC (y-axis) for each subfamily is plotted against its number of loci in the mouse genome. All statistically significant L1 subfamilies (black line and font; P < 0.01) as well as any remaining A, Gf and Tf subfamilies (gray line and font; P > 0.01) are labeled. Note the top ranked LTR subfamily RLTR43A (with log2FC of 2.9 and 3 genomic loci) is not shown on the graph.

Update of

Similar articles

References

    1. Hoyt S.J., Storer J.M., Hartley G.A., Grady P.G.S., Gershman A., de Lima L.G., Limouse C., Halabian R., Wojenski L., Rodriguez M.et al. .. From telomere to telomere: the transcriptional and epigenetic state of human repeat elements. Science. 2022; 376:eabk3112. - PMC - PubMed
    1. Singer M.F. SINEs and LINEs: highly repeated short and long interspersed sequences in mammalian genomes. Cell. 1982; 28:433–434. - PubMed
    1. Smit A.F., Toth G., Riggs A.D., Jurka J.. Ancestral, mammalian-wide subfamilies of LINE-1 repetitive sequences. J. Mol. Biol. 1995; 246:401–417. - PubMed
    1. Feusier J., Watkins W.S., Thomas J., Farrell A., Witherspoon D.J., Baird L., Ha H., Xing J., Jorde L.B.. Pedigree-based estimation of human mobile element retrotransposition rates. Genome Res. 2019; 29:1567–1577. - PMC - PubMed
    1. Saha P.S., An W.. eLS. 2019; (Chichester: John Wiley & Sons, Ltd Ed; 1–10.

LinkOut - more resources