. 2024 Sep 27;12(10):2202.
doi: 10.3390/biomedicines12102202.

Hepatocellular Carcinoma in Mice Affects Neuronal Activity and Glia Cells in the Suprachiasmatic Nucleus

Affiliations

Hepatocellular Carcinoma in Mice Affects Neuronal Activity and Glia Cells in the Suprachiasmatic Nucleus

Mona Yassine et al. Biomedicines. .

Abstract

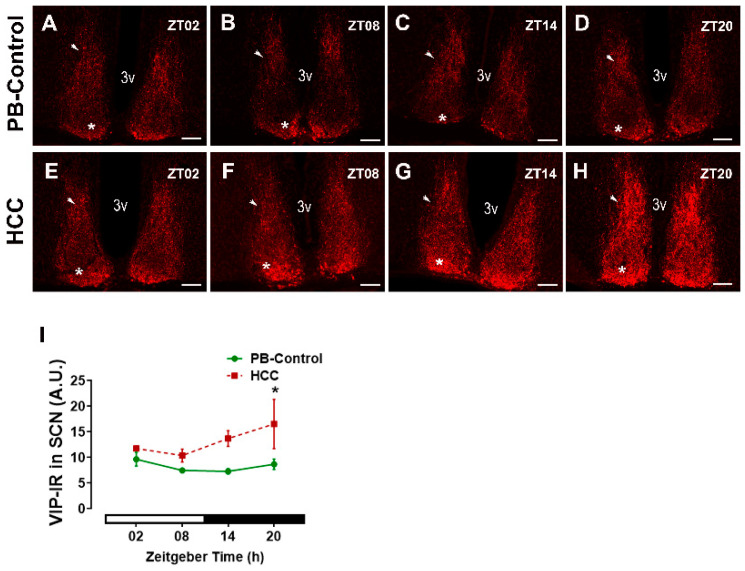
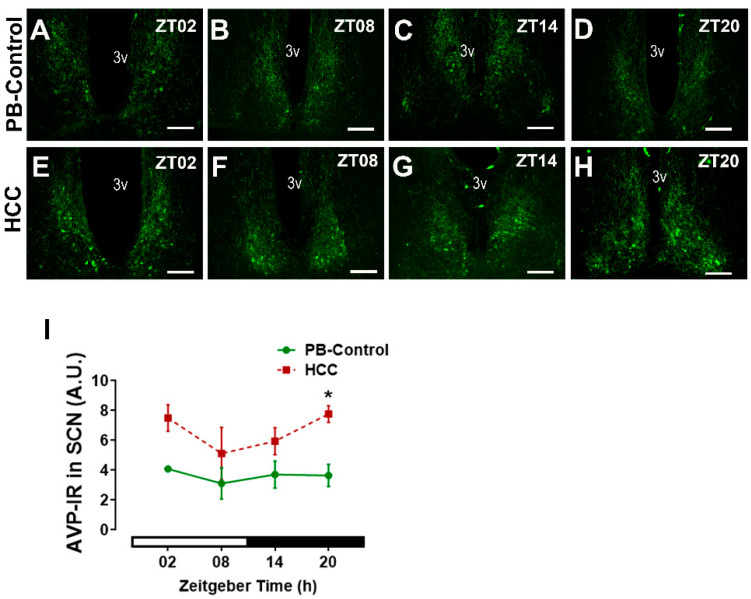
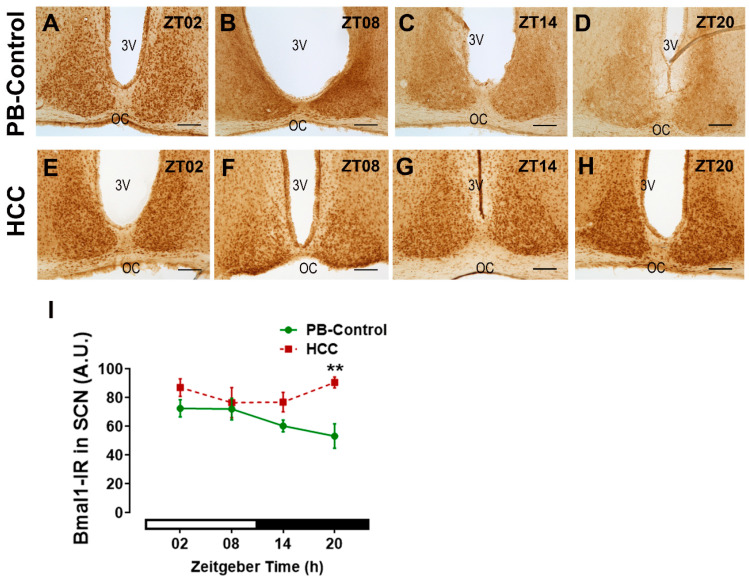
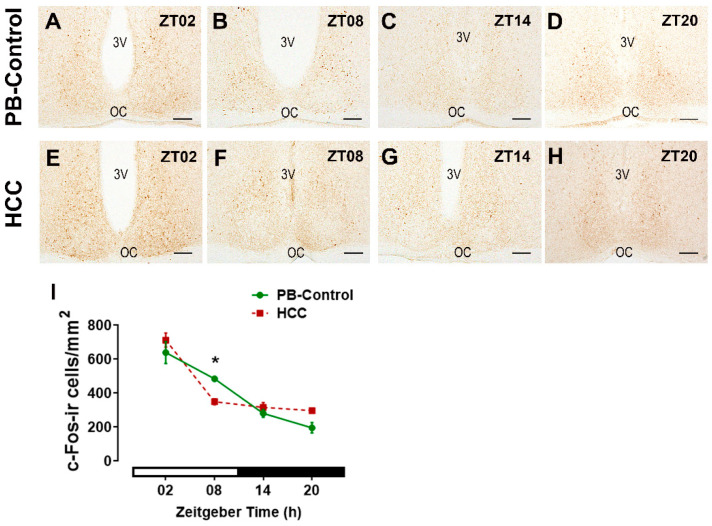
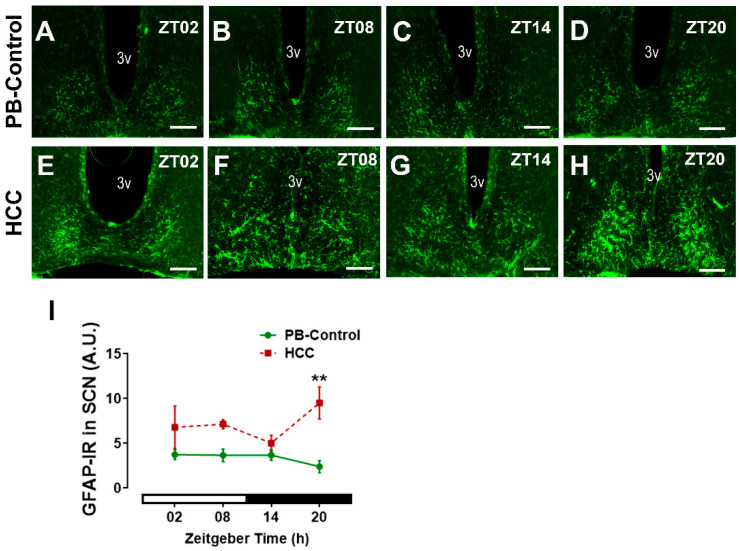
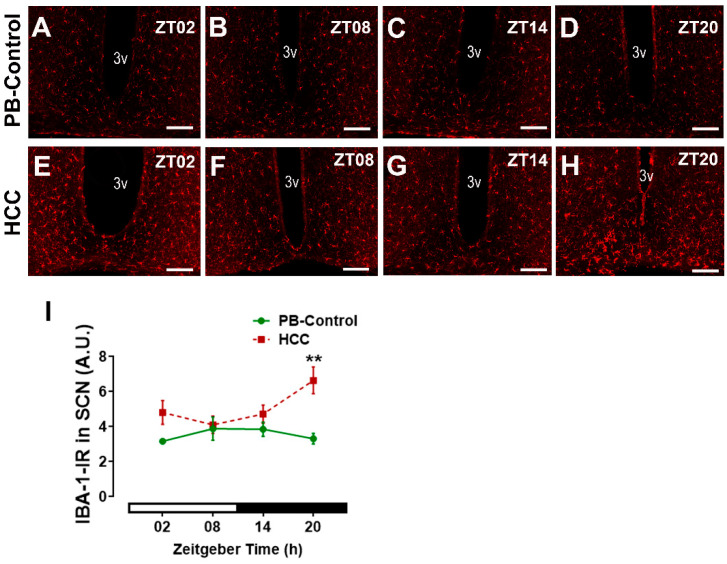
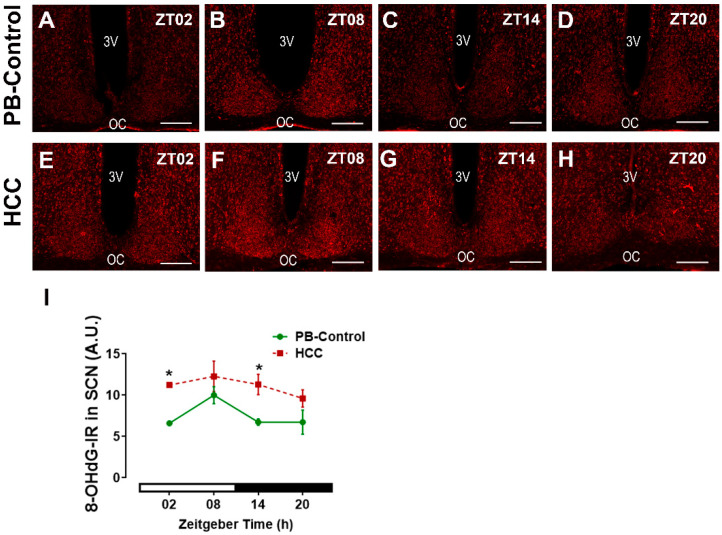
Background: Chronic liver diseases such as hepatic tumors can affect the brain through the liver-brain axis, leading to neurotransmitter dysregulation and behavioral changes. Cancer patients suffer from fatigue, which can be associated with sleep disturbances. Sleep is regulated via two interlocked mechanisms: homeostatic regulation and the circadian system. In mammals, the hypothalamic suprachiasmatic nucleus (SCN) is the key component of the circadian system. It generates circadian rhythms in physiology and behavior and controls their entrainment to the surrounding light/dark cycle. Neuron-glia interactions are crucial for the functional integrity of the SCN. Under pathological conditions, oxidative stress can compromise these interactions and thus circadian timekeeping and entrainment. To date, little is known about the impact of peripheral pathologies such as hepatocellular carcinoma (HCC) on SCN. Materials and Methods: In this study, HCC was induced in adult male mice. The key neuropeptides (vasoactive intestinal peptide: VIP, arginine vasopressin: AVP), an essential component of the molecular clockwork (Bmal1), markers for activity of neurons (c-Fos), astrocytes (GFAP), microglia (IBA1), as well as oxidative stress (8-OHdG) in the SCN were analyzed by immunohistochemistry at four different time points in HCC-bearing compared to control mice. Results: The immunoreactions for VIP, Bmal1, GFAP, IBA1, and 8-OHdG were increased in HCC mice compared to control mice, especially during the activity phase. In contrast, c-Fos was decreased in HCC mice, especially during the late inactive phase. Conclusions: Our data suggest that HCC affects the circadian system at the level of SCN. This involves an alteration of neuropeptides, neuronal activity, Bmal1, activation of glia cells, and oxidative stress in the SCN.

Keywords: AVP; HCC; SCN; VIP; circadian system; glia; oxidative stress.


Conflict of interest statement

The authors have no competing interests.

Figures

Figure 1
Figure 1
Vasoactive intestinal peptide (VIP) immunoreaction (IR) in the SCN. Representative fluorescent microphotographs showing the immunoreaction (IR) of VIP (red) in the suprachiasmatic nucleus (SCN) of (AD) PB control mice and (EH) HCC mice. The white asterisk indicates the ventral core region, while white arrowhead indicates the dorsal shell region of SCN. 3v: third ventricle. Scale bar = 100 μm. Mice were sacrificed at different time points at 6 h intervals starting at Zeitgeber time (ZT) 02 = 2 h after the light on. (I) Quantification of VIP-immunoreaction (IR) in arbitrary unit (A.U.) in the SCN. White and black bar indicates light/dark phase, respectively. Two-way ANOVA followed by Sidak’s multiple comparisons test. Total of 12 mice per group, n = 3 mice at each time point. *: p < 0.05 between PB control and HCC.
Figure 2
Figure 2
Arginine vasopressin (AVP) immunoreaction (IR) in the SCN. Representative fluorescent microphotographs showing the immunoreaction (IR) of AVP (green) in the SCN of (AD) PB control mice and (EH) HCC mice. 3v: third ventricle. Scale bar = 100 μm. Mice were sacrificed at different time points at 6 h intervals starting at ZT02 = 2 h after the light was on. (I) Quantification of AVP-immunoreaction (IR) in arbitrary unit (A.U.) in the SCN. White and black bar indicates light/dark phase, respectively. Two-way ANOVA followed by Sidak’s multiple comparisons test. Total of 12 mice per group, n = 3 mice at each time point. *: p < 0.05 between PB control and HCC.
Figure 3
Figure 3
Orexin-immunoreactive (ir) cells in the lateral hypothalamus. Representative fluorescent microphotographs showing orexin-ir cells (green) in the lateral hypothalamus (LH) of (AD) PB control mice and (EH) HCC-bearing mice. Scale bar = 200 μm. Mice were sacrificed at different time points at 6 h intervals starting at ZT02 = 2 h after the light was on. (I) Quantification of number of orexin-immunoreactive cells per mm2 in the lateral hypothalamus. White and black bar indicates light/dark phase, respectively. Two-way ANOVA followed by Sidak’s multiple comparisons test. Total of 12 mice per group, n = 3 mice at each time point.
Figure 4
Figure 4
Bmal1-immunoreaction (IR) in the SCN. Representative bright-field photomicrographs showing the Bmal1-immunoreactive cells (brown staining) in the SCN of (AD) PB control mice and (EH) in HCC-bearing mice. 3v: third ventricle. OC: optic chiasma. Scale bar = 100 μm. Mice were sacrificed at different time points at 6 h intervals starting at ZT02 = 2 h after the light on. (I) Quantification of Bmal1-IR in arbitrary units (A.U.) in the SCN at individual time points at 6 h intervals. White and black bar indicates light/dark phase, respectively. Two-way ANOVA followed by Sidak’s multiple comparisons test. Total of 12 mice per group, n = 3 mice at each time point. **: p < 0.01 between PB control and HCC.
Figure 5
Figure 5
c-Fos-immunoreactive (ir) cells in the SCN. Representative bright-field photomicrograph showing the positively stained c-Fos cells (brown staining) in the SCN of (AD) PB control mice and (EH) in HCC-bearing mice. 3v: third ventricle. OC: optic chiasma. Scale bar = 100 μm. Mice were sacrificed at different time points at 6 h intervals starting at ZT02 = 2 h after the light was on. (I) Quantification of c-Fos-ir cells/mm2 in the SCN. White and black bar indicates for light/dark phase, respectively. Two-way ANOVA followed by Sidak’s multiple comparisons test. Total of 12 mice per group, n = 3 mice at each time point. *: p < 0.05 between PB control and HCC.
Figure 6
Figure 6
Astrocytic marker GFAP-immunoreaction (IR) in SCN. Representative fluorescent microphotographs showing GFAP immunoreaction (IR) (green) in the SCN of (AD) PB control mice and (EH) HCC mice. 3v: third ventricle. Scale bar = 150 μm. Mice were sacrificed at different time points at 6 h intervals starting at ZT02 = 2 h after the light was on. (I) Quantification of GFAP-immunoreaction (IR) in arbitrary unit (A.U.) in the SCN. White and black bar indicates light/dark phase, respectively. Two-way ANOVA followed by Sidak’s multiple comparisons test. Total of 12 mice per group n = 3 mice at each time point. **: p < 0.01 between PB control and HCC.
Figure 7
Figure 7
Microglial marker IBA-1-immunoreaction (IR) in SCN. Representative fluorescent photomicrographs showing IBA-1-immunoreaction (IR) (red) in the SCN of (AD) PB control mice and of (EH) HCC-bearing mice. 3v: third ventricle. Scale bar = 150 μm. Mice were sacrificed at different time points at 6 h intervals starting at ZT02 = 2 h after the light was on. (I) Quantification of IBA-1-immunoreaction (IR) in arbitrary unit (A.U.) in the SCN. White and black bar indicates for light/dark phase, respectively. Two-way ANOVA followed by Sidak’s multiple comparisons test. Total of 12 mice per group, n = 3 mice at each time point. **: p < 0.01 between control and HCC.
Figure 8
Figure 8
Oxidative stress marker 8-OHdG-immunoreaction in (IR) SCN. Representative fluorescent photomicrographs showing the immunoreaction (IR) of 8- hydroxydeoxyguanosine (8-OHdG) (red) in the SCN of (AD) PB control mice and of (EH) HCC-bearing mice. 3v: third ventricle. OC: optic chiasma. Scale bar = 100 μm. Mice were sacrificed at different time points at 6 h intervals starting at ZT02 = 2 h after the light was on. (I) Quantification of 8-OHdG-immunoreaction (IR) in arbitrary unit (A.U.) in the SCN. White and black bar indicates light/dark phase, respectively. Two-way ANOVA followed by Sidak’s multiple comparisons test. Total of 12 mice per group, n = 3 mice at each time point. *: p < 0.05 between PB control and HCC.

Similar articles

References

    1. Swain M.G., Jones D.E.J. Fatigue in chronic liver disease: New insights and therapeutic approaches. Liver Int. Off. J. Int. Assoc. Study Liver. 2019;39:6–19. doi: 10.1111/liv.13919. - DOI - PubMed
    1. Singal A.G., Kanwal F., Llovet J.M. Global trends in hepatocellular carcinoma epidemiology: Implications for screening, prevention and therapy. Nat. Rev. Clin. Oncol. 2023;20:864–884. doi: 10.1038/s41571-023-00825-3. - DOI - PubMed
    1. Rao A., Rich N.E., Marrero J.A., Yopp A.C., Singal A.G. Diagnostic and Therapeutic Delays in Patients With Hepatocellular Carcinoma. J. Natl. Compr. Cancer Netw. 2021;19:1063–1071. doi: 10.6004/jnccn.2020.7689. - DOI - PubMed
    1. Qiu X., Li M., Wu L., Xin Y., Mu S., Li T., Song K. Severe Fatigue is an Important Factor in the Prognosis of Patients with Advanced Hepatocellular Carcinoma Treated with Sorafenib. Cancer Manag. Res. 2020;12:7983–7992. doi: 10.2147/CMAR.S233448. - DOI - PMC - PubMed
    1. Ee C., Kay S., Reynolds A., Lovato N., Lacey J., Koczwara B. Lifestyle and integrative oncology interventions for cancer-related fatigue and sleep disturbances. Maturitas. 2024;187:108056. doi: 10.1016/j.maturitas.2024.108056. - DOI - PubMed

LinkOut - more resources