

Whole-Genome Bisulfite Sequencing (WGBS) Analysis of Gossypium hirsutum under High-Temperature Stress Conditions
- PMID: 39457365
- PMCID: PMC11507439
- DOI: 10.3390/genes15101241
Whole-Genome Bisulfite Sequencing (WGBS) Analysis of Gossypium hirsutum under High-Temperature Stress Conditions
Abstract
Background: DNA methylation is an important part of epigenetic regulation and plays an important role in the response of plants to adverse stress.
Methods: In this study, whole-genome bisulfite sequencing (WGBS) was performed on the high-temperature-resistant material Xinluzao 36 and the high-temperature-sensitive material Che 61-72 at 0 h and 12 h under high-temperature stress conditions.
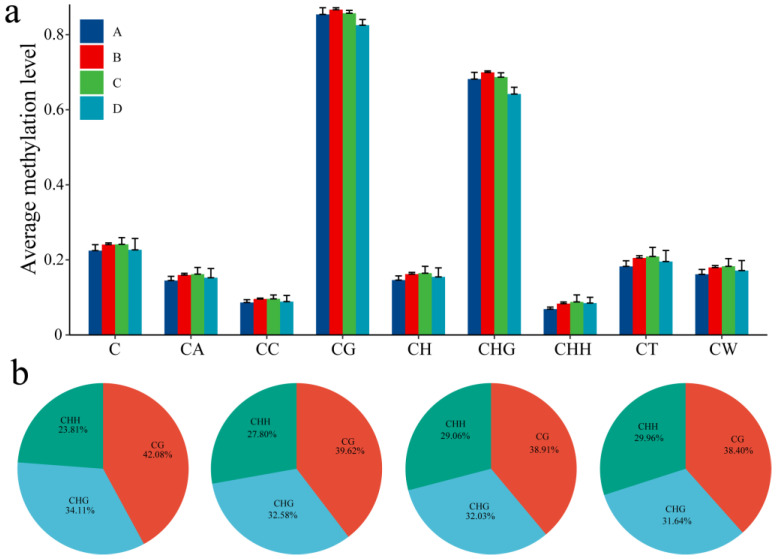
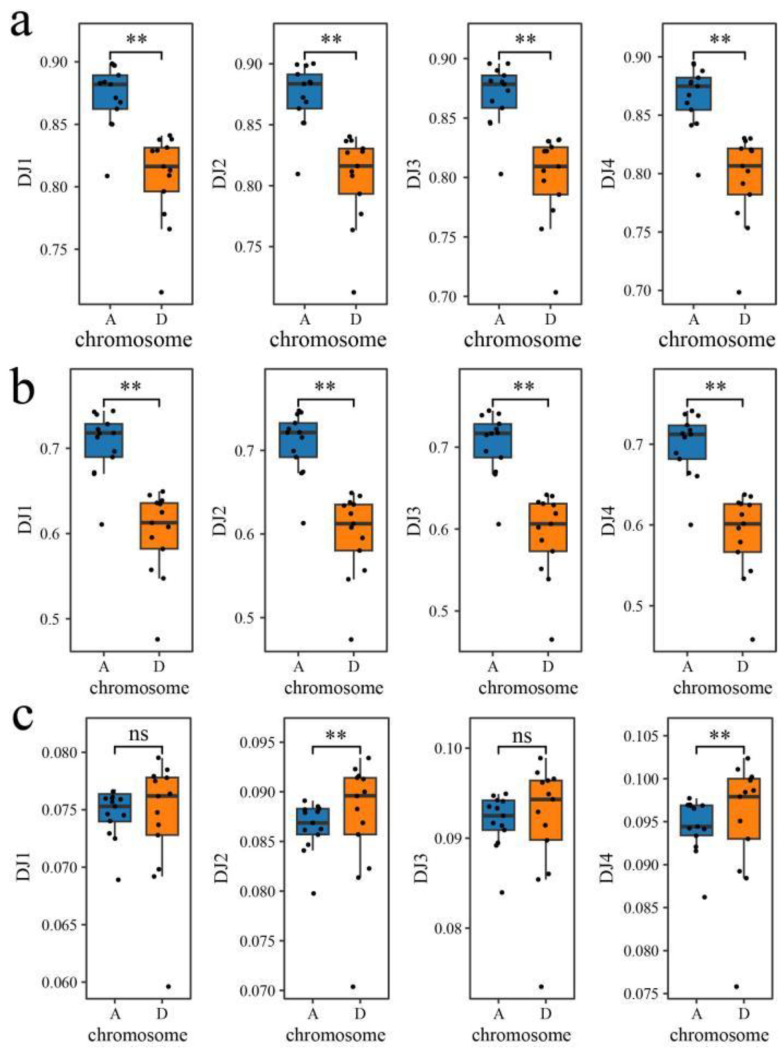
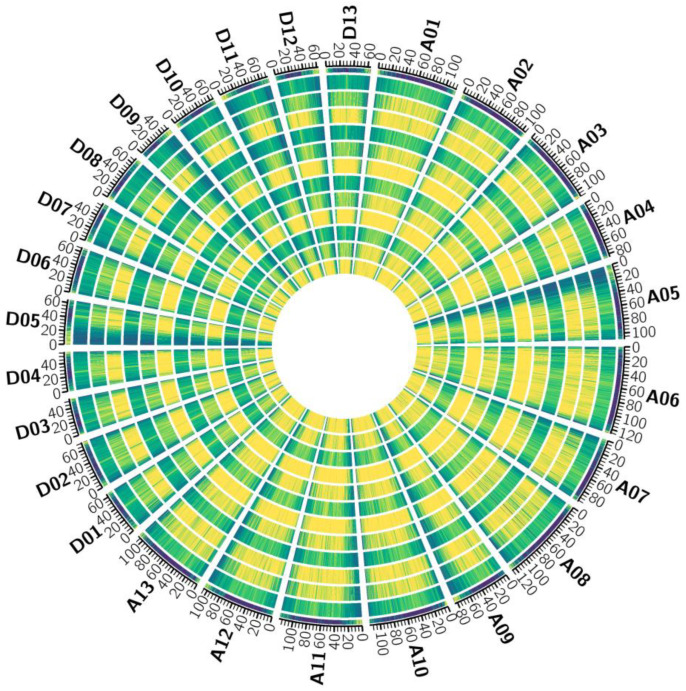
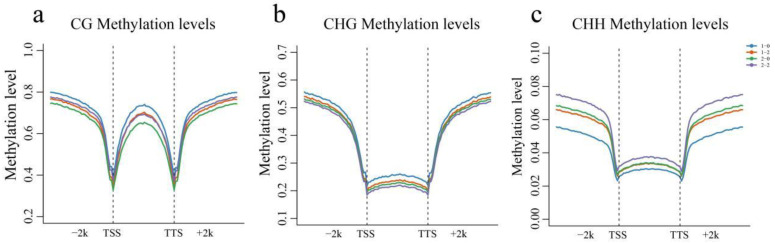
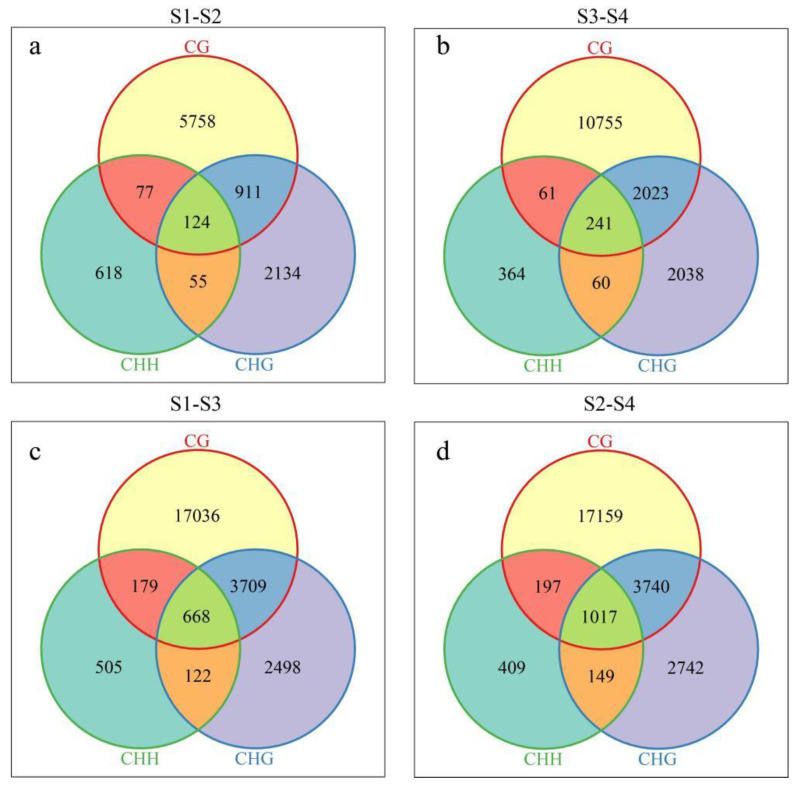
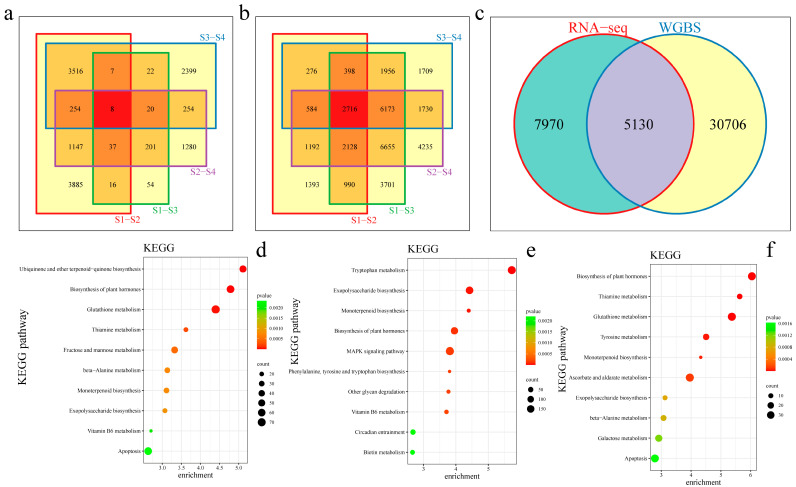
Results: The results revealed that the Gossypium hirsutum methylation levels of CG and CHG (H = A, C, or T) decreased after the high-temperature stress treatment, and the methylation level of the A subgenome was significantly greater than that of the D subgenome. The methylation level of CHH increased, and the methylation level of CHH in the D subgenome was significantly greater than that in the A subgenome after high-temperature stress treatment. The methylation density of CG is lower than that of CHG and CHH, and the methylation density of the middle region of chromosomes is greater than that of both ends, which is opposite to the distribution density of genes. There were 124 common differentially methylated genes in the CG, CHG, and CHH groups, and 5130 common DEGs and differentially methylated genes were found via joint analysis with RNA-seq; these genes were significantly enriched in the biosynthesis of plant hormones, thiamine metabolism, glutathione metabolism, and tyrosine metabolism pathways. DNA methylation did not affect the expression of many genes (accounting for 85.68% of the differentially methylated genes), DNA methylation-promoted gene expression was located mainly in the downstream region of the gene or gene body, and the expression of inhibitory genes was located mainly in the upstream region of the gene.
Conclusions: This study provides a theoretical basis for further exploration of the gene expression and functional regulatory mechanism of G. hirsutum DNA methylation under high-temperature stress conditions.
Keywords: G. hirsutum; RNA-seq; WGBS; high temperature.
Conflict of interest statement
The authors declare that they have no conflicts of interest.
Figures
Similar articles
-
Single-base resolution methylomes of upland cotton (Gossypium hirsutum L.) reveal epigenome modifications in response to drought stress.BMC Genomics. 2017 Apr 13;18(1):297. doi: 10.1186/s12864-017-3681-y. BMC Genomics. 2017. PMID: 28407801 Free PMC article.
-
Comparative genome-wide DNA methylation analysis reveals epigenomic differences in response to heat-humidity stress in Bombyx mori.Int J Biol Macromol. 2020 Dec 1;164:3771-3779. doi: 10.1016/j.ijbiomac.2020.08.251. Epub 2020 Sep 3. Int J Biol Macromol. 2020. PMID: 32891645
-
Analysis of DNA methylation profiles during sheep skeletal muscle development using whole-genome bisulfite sequencing.BMC Genomics. 2020 Apr 29;21(1):327. doi: 10.1186/s12864-020-6751-5. BMC Genomics. 2020. PMID: 32349667 Free PMC article.
-
Estimating Global Methylation and Erasure Using Low-Coverage Whole-Genome Bisulfite Sequencing (WGBS ).Methods Mol Biol. 2021;2272:29-44. doi: 10.1007/978-1-0716-1294-1_3. Methods Mol Biol. 2021. PMID: 34009607
-
Efficient and accurate determination of genome-wide DNA methylation patterns in Arabidopsis thaliana with enzymatic methyl sequencing.Epigenetics Chromatin. 2020 Oct 7;13(1):42. doi: 10.1186/s13072-020-00361-9. Epigenetics Chromatin. 2020. PMID: 33028374 Free PMC article.
References
-
- Liang Y., Gong Z., Wang J., Zheng J., Ma Y., Min L., Chen Q., Li Z., Qu Y., Chen Q., et al. Nanopore-Based Comparative Transcriptome Analysis Reveals the Potential Mechanism of High-Temperature Tolerance in Cotton (Gossypium hirsutum L.) Plants. 2021;10:2517. doi: 10.3390/plants10112517. - DOI - PMC - PubMed
MeSH terms
Substances
Grants and funding
LinkOut - more resources
Full Text Sources
