. 2024 Oct 25;15(1):9218.
doi: 10.1038/s41467-024-53276-4.

Skeletal muscle reprogramming enhances reinnervation after peripheral nerve injury

Affiliations

Skeletal muscle reprogramming enhances reinnervation after peripheral nerve injury

Pihu Mehrotra et al. Nat Commun. .

Abstract

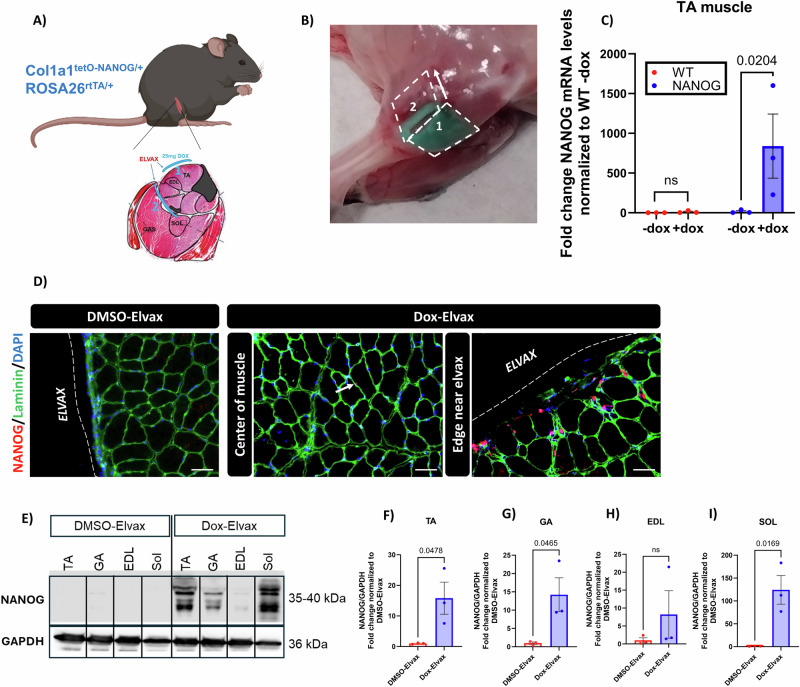
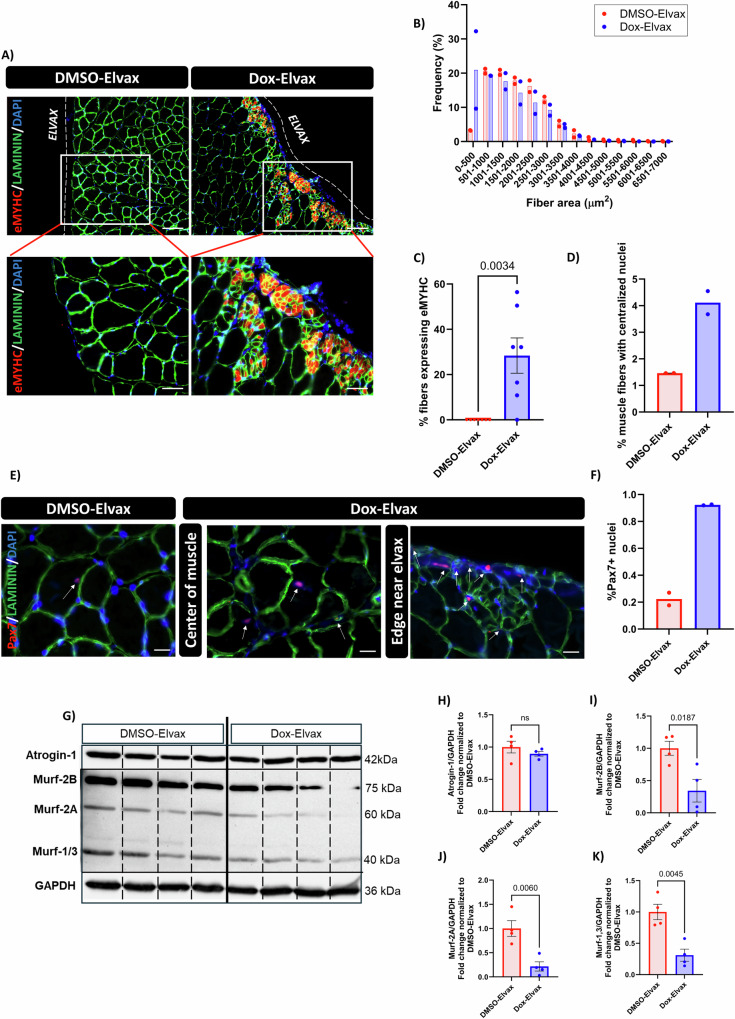
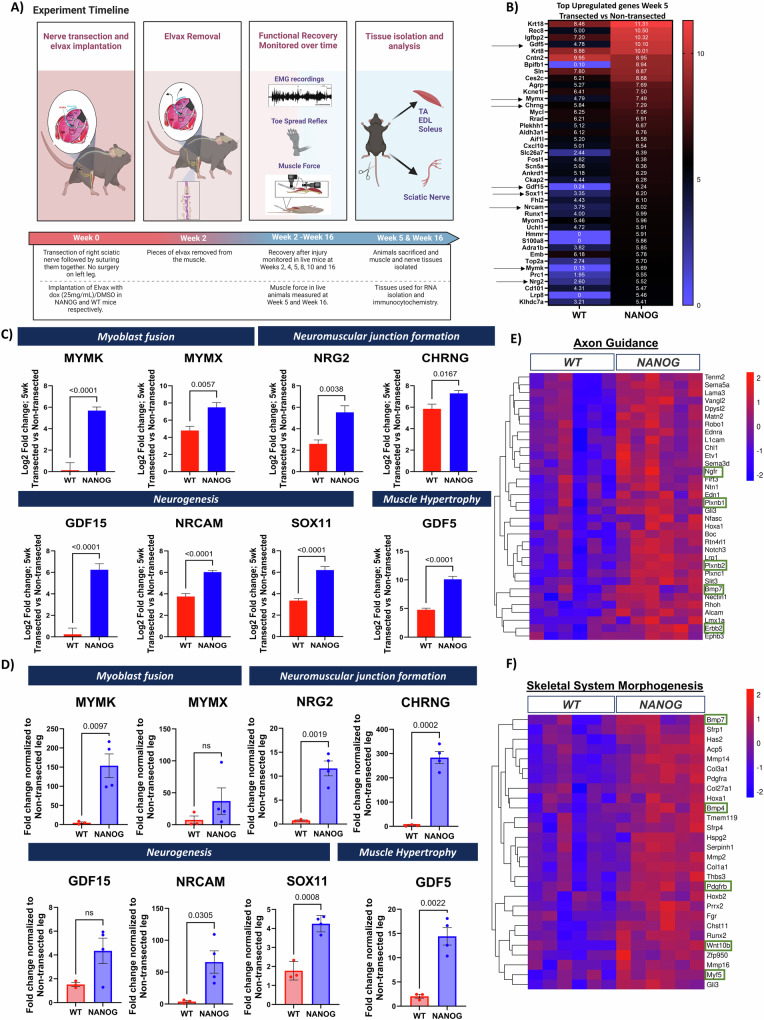
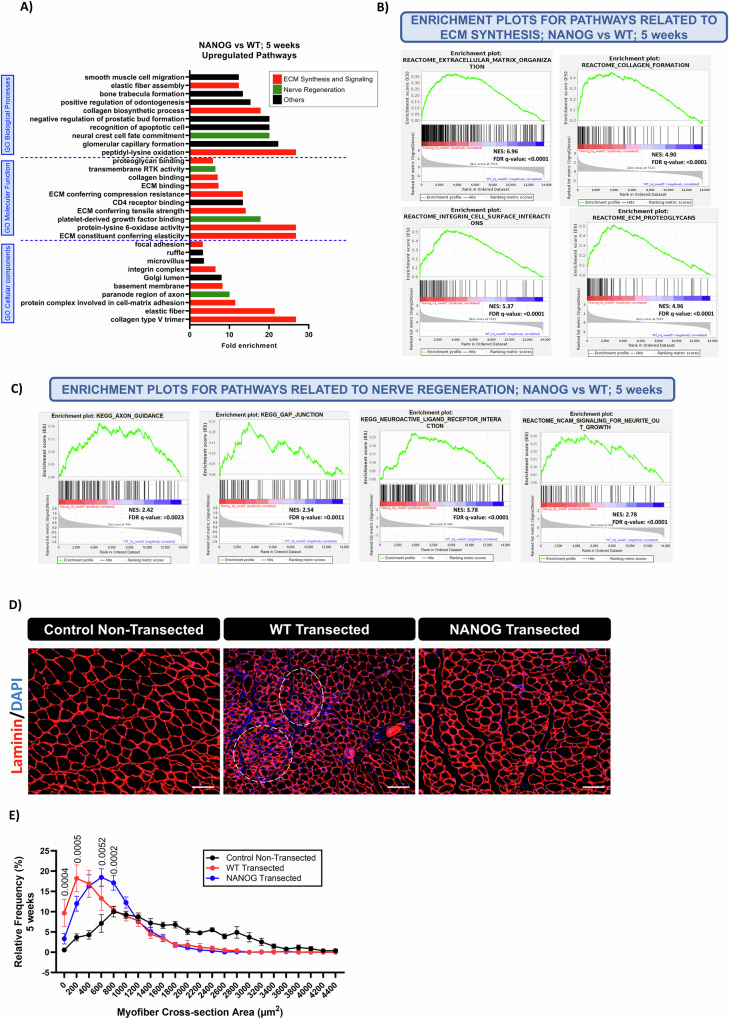
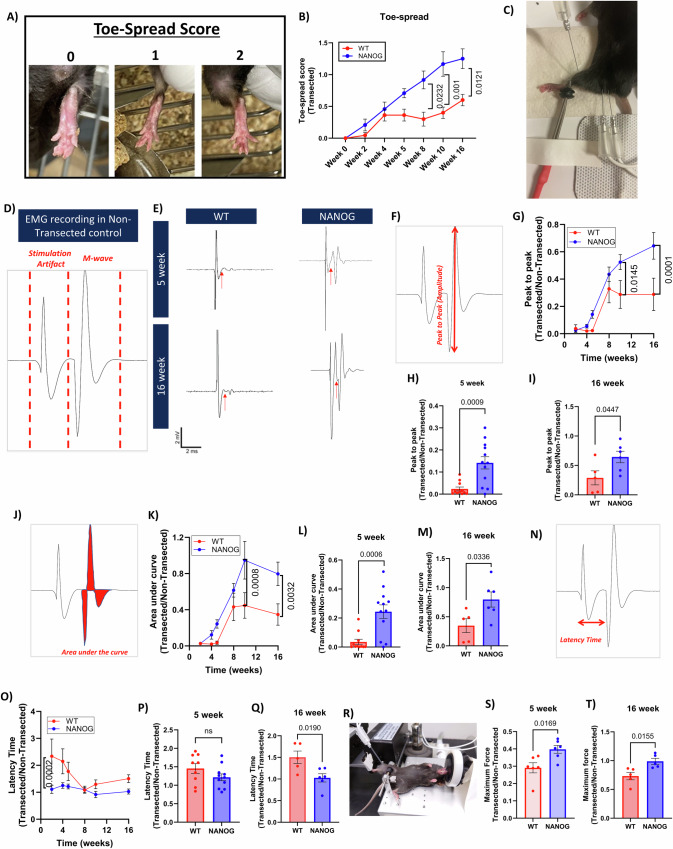
Peripheral Nerve Injuries (PNI) affect more than 20 million Americans and severely impact quality of life by causing long-term disability. PNI is characterized by nerve degeneration distal to the site of nerve injury resulting in long periods of skeletal muscle denervation. During this period, muscle fibers atrophy and frequently become incapable of "accepting" innervation because of the slow speed of axon regeneration post injury. We hypothesize that reprogramming the skeletal muscle to an embryonic-like state may preserve its reinnervation capability following PNI. To this end, we generate a mouse model in which NANOG, a pluripotency-associated transcription factor is expressed locally upon delivery of doxycycline (Dox) in a polymeric vehicle. NANOG expression in the muscle upregulates the percentage of Pax7+ nuclei and expression of eMYHC along with other genes that are involved in muscle development. In a sciatic nerve transection model, NANOG expression leads to upregulation of key genes associated with myogenesis, neurogenesis and neuromuscular junction (NMJ) formation. Further, NANOG mice demonstrate extensive overlap between synaptic vesicles and NMJ acetylcholine receptors (AChRs) indicating restored innervation. Indeed, NANOG mice show greater improvement in motor function as compared to wild-type (WT) animals, as evidenced by improved toe-spread reflex, EMG responses and isometric force production. In conclusion, we demonstrate that reprogramming muscle can be an effective strategy to improve reinnervation and functional outcomes after PNI.


Conflict of interest statement

The authors declare no competing interests.

Figures

Fig. 1
Fig. 1. Mouse model for Dox-inducible NANOG expression in skeletal muscle.
A Localized NANOG expression in the muscle was achieved by subcutaneous implantation of the slow-release polymer Elvax (shown in blue) near the TA, EDL, Soleus and Gastrocnemius muscles. Schematic of muscle adapted from. Figure created with BioRender.com. B Image showing two pieces of Elvax implanted in the mouse leg. Piece 1 induces Dox/DMSO delivery to the TA and EDL muscle. Piece 2 induces Dox/DMSO delivery to the GA and Sol muscles. C Fold change in relative mRNA levels of NANOG from isolated TA muscle 4 days after Elvax implantation in naïve uninjured WT and NANOG animals (n = 3 biological replicates, normalized to WT; no Elvax). Statistical test performed is two-way ANOVA with Uncorrected Fisher’s LSD test. D Immunostaining of TA muscle sections for NANOG (red), Laminin (green) and DAPI (Blue) 4 days after DMSO-Elvax or Dox-Elvax implantation. Scale bar = 50 µm. Fields of view depict representative images from the center of the muscle and section adjacent to Elvax placement. E Western blot for NANOG in TA, GA, EDL and Sol muscles 4 days after DMSO-Elvax and Dox-Elvax implantation. Fold change in NANOG expression in Dox-Elvax compared to DMSO-Elvax quantified after normalization to GAPDH in (F) TA (G) GA (H) EDL and (I) Sol muscles; n = 3 biological replicates for both DMSO-Elvax and Dox-Elvax. For G-I, unpaired t-test used for statistical analysis. All data are presented as Mean ± SEM. Source data are provided as a Source Data file.
Fig. 2
Fig. 2. NANOG expression de-differentiates skeletal muscle to a pro-regenerative state.
The left leg of naïve uninjured mice was implanted with Dox-Elvax for two weeks; the right leg was implanted with DMSO-Elvax and served as control for the Elvax placement. One week after removal of Elvax, the TA muscle was harvested for evaluation. A Immunostaining of TA muscle sections for eMYHC (red), Laminin (green) and DAPI (Blue). Scale bar = 100 µm, insets are higher magnification images with scale bar = 50 µm. B Quantification of fiber area of TA muscle in mice with Elvax-DOX vs. Elvax-DMSO; n = 2 biological replicates for both DMSO-Elvax and Dox-Elvax, 200-250 muscle fibers from 3 muscle sections. C Quantification of small muscle fibers (less than 100 µm2) expressing eMYHC; n = 7 fields of view for 2 biological replicates for both DMSO-Elvax and Dox-Elvax. D Percentage of centrally nucleated regenerative muscle fibers throughout the TA muscle; n = 2 biological replicates for both DMSO-Elvax and Dox-Elvax, 200-250 muscle fibers per mouse. E Immunostaining for Pax7 (red), Laminin (green) and DAPI (blue). Fields of view depicted are representative images from the center of the muscle, and section adjacent to Elvax placement. Scale bar = 20 µm. F Quantification for percentage of Pax7 positive nuclei throughout the TA muscle; n = 2 biological replicates for both DMSO-Elvax and Dox-Elvax. G Western blot for atrogenes Atrogin-1 and Murf-2B, Murf-2A and Murf-1/3 in the TA muscle. Fold change in (H) Atrogin-1 (I) Murf-2B (J) Murf-2A and (K) Murf-1/3 expression in Dox-Elvax compared to DMSO-Elvax quantified after normalization to GAPDH; n = 4 biological replicates for both DMSO-Elvax and Dox-Elvax. Unpaired t-test used for statistical analysis in all graphs. All data are presented as Mean ± SEM. Source data are provided as a Source Data file.
Fig. 3
Fig. 3. NANOG expression in skeletal muscle in a sciatic nerve injury model upregulates genes associated with skeletal muscle dedifferentiation, neurogenesis and nerve development 5 weeks post injury.
A Schematic depicting experimental procedure, timeline and experiments performed. Figure created with BioRender.com. B Top 42 upregulated genes in TA muscle on side of transection normalized to non-transected limb in WT and NANOG animals. Log2 fold change values are depicted within each cell. Genes of interest with respect to muscle or nerve development are highlighted by arrows. C Plot depicting mean log 2-fold change in selected genes from B associated with myoblast fusion (MYMK and MYMX), NMJ formation (NRG2 and CHRNG), neurogenesis (GDF15, NRCAM and Sox11) and muscle hypertrophy (GDF5) after transection, normalized to expression in non-transected limb of the same animal in WT and NANOG mice. n = 5 biological replicates for WT, n = 6 biological replicates for NANOG. D RT-PCR expression data from TA muscle for genes in C on side of transection normalized to non-transected limb in WT and NANOG animals; n = 3 biological replicates for WT, n = 4 biological replicates for NANOG. E Heatmaps showing differentially expressed genes associated with gene ontology term Axon Guidance and F Skeletal System Morphogenesis. Only genes with statistically significant differences (padj<0.05) between WT and NANOG samples have been depicted. Genes of particular interest are highlighted within green boxes; n = 6 biological replicates for both WT and NANOG mice. Unpaired t-test used for statistical analysis in all graphs. All data are presented as Mean ± SEM. Source data are provided as a Source Data file.
Fig. 4
Fig. 4. NANOG upregulates ECM organization and Nerve Regeneration pathways and increases myofiber cross section area 5 weeks after nerve injury.
A Top 10 most highly enriched GO cellular components, molecular functions and biological processes 5 weeks after PNI. ECM: Extracellular Matrix, RTK: Receptor Tyrosine Kinase. B Enrichment plots from Reactome database depicting ECM synthesis and signaling associated pathways; ECM organization, Collagen formation, Integrin cell surface interactions and ECM proteoglycans. C Enrichment plots from KEGG and Reactome databases depicting nerve development pathways; Axon guidance, Gap junction, Neuroactive ligand receptor interaction and NCAM signaling for neurite outgrowth; n = 6 biological replicates for both WT and NANOG. D Immunostaining of TA muscle sections for Laminin (red) and DAPI (Blue) 5 weeks after nerve injury. Scale bar = 100 µm. Areas within white circles depict atrophied muscle fibers. E Quantification for myofiber cross sectional area in WT transected, NANOG Transected and Control Non-Transected muscle; n = 6 biological replicates for all groups- Control non-transected, WT transected and NANOG transected, 200-250 muscle fibers per mouse. Data is presented as Mean ± SEM. Statistical analysis performed using two-way ANOVA with Tukey’s multiple comparison test. P-values depicted in the plot represent statistically significant differences in WT transected and NANOG transected groups. Source data are provided as a Source Data file.
Fig. 5
Fig. 5. NANOG improves overlap between neuronal synaptic vesicles and muscle AChRs following transection.
A Confocal images of NMJs 5 and 16 weeks after transection using whole mount immunocytochemistry labeled for presynaptic axons and synaptic vesicles (green) and postsynaptic AChRs (Red). Regions of overlap between pre- and post-synaptic regions are yellow. WT mice frequently demonstrate poor overlap between synaptic vesicles and AChRs (arrows). Multiple innervations were also seen in WT mice (asterisks). NANOG mice showed pre- vs. post-synaptic overlap similar to NMJs from control non-transected limbs. Scale bar = 20 µm. Quantification for percentage of colocalization between synaptic vesicles and AChRs at (B) 5 weeks and (C) at 16 weeks; each point in the dispersion plot represents a single NMJ from n = 6 biological replicates per condition. For 5 weeks dataset: n = 11 for Control Non-Transected, n = 9 for WT Transected, n = 22 for NANOG Transected. For 16 weeks dataset: n = 26 for Control non-transected, n = 22 for WT transected, n = 45 for NANOG transected. D Confocal images of NMJs 5 and 16 weeks after transection in muscle cross-sections labeled for presynaptic axons and synaptic vesicles (green) and postsynaptic AChRs (red). Regions of overlap between pre- and post-synaptic regions are yellow. WT mice frequently demonstrate poor overlap between synaptic vesicles and AChRs (arrows). NANOG mice showed overlap similar to NMJs from control non-transected limbs. Scale bar = 20 µm. Quantification for percentage of colocalization between synaptic vesicles and AChRs at (E) 5 weeks and (F) 16 weeks after nerve injury; each point in the dispersion plot represents a single NMJ from n = 6 biological replicates per condition. For 5 weeks dataset: n = 103 NMJs for Control Non-Transected, n = 116 NMJs for WT Transected, n = 95 NMJs for NANOG Transected. For 16 weeks dataset: n = 520 NMJs for Control non-transected, n = 453 NMJs for WT transected, n = 556 NMJs for NANOG transected. All data are presented as Mean ± SEM. Statistical analysis performed using two-way ANOVA with Tukey’s multiple comparison test for all graphs. Source data are provided as a Source Data file.
Fig. 6
Fig. 6. NANOG mice show enhanced functional recovery after nerve transection.
A Depiction of mouse toe spread reflex and assigned scores. B Quantification of toe-spread reflex from Week 0-16 after nerve transection; for weeks 0-5: WT- n = 11, NANOG- n = 12 biological replicates; for weeks 8-16: WT- n = 5, NANOG-n = 6 biological replicates. C Setup for needle EMG recordings. D A typical EMG waveform recorded in non-transected control mice. E Representative waveforms from WT and NANOG transected limbs at 5-and 16- weeks after injury. The start of M-wave is marked by red arrows. F Schematic depicting the amplitude of the CMAP M-wave. G Quantification of normalized EMG amplitude from weeks 0-16 after nerve transection in WT and NANOG mice. H EMG amplitude at 5 weeks and (I) 16 weeks post nerve injury. J Schematic depicting the area of an M-wave. K Quantification of normalized EMG area from weeks 0-16 after nerve transection in WT and NANOG mice. L CMAP M-wave area at 5 weeks and (M) 16 weeks post nerve injury. N Schematic of latency time. O Quantification of normalized EMG latency time from weeks 0-16 after nerve transection in WT and NANOG mice. P Latency time at 5 weeks and (Q) 16 weeks post nerve injury; In graphs GQ, for weeks 0-5: WT- n = 11, NANOG- n = 12 biological replicates; for weeks 8-16: WT-n = 5, NANOG- n = 6 biological replicates. R Setup for muscle force measurement in live mice using the Aurora force transducer. Maximum force recorded at stimulation frequency of 150 Hz from both transectedand non-transected limbs at (S) 5 weeks and (T) 16 weeks. Force in the transected side was normalized to the average force of the control non-transected limb; For both WT and NANOG, n = 6 biological replicates at 5 weeks (S). and n = 5 biological replicates at 16 weeks (T). For B, G, K and L, statistics performed using two-way ANOVA with Sidak’s test. For H, I, L, M, P, Q, S, and T, statistics performed using unpaired t-test. All data are presented as Mean ± SEM. Source data are provided as a Source Data file.

Update of

Similar articles

References

    1. Taylor, C. A., Braza, D., Rice, J. B. & Dillingham, T. The incidence of peripheral nerve injury in extremity trauma. Am. J. Phys. Med. Rehab.87, 381–385 (2008). - PubMed
    1. Rivera, J. C., Glebus, G. & Cho, M. Disability following combat-sustained nerve injury of the upper limb. bone Jt. J.96, 254–258 (2014). - PubMed
    1. Bergmeister, K. D. et al. Acute and long-term costs of 268 peripheral nerve injuries in the upper extremity. PloS one15, e0229530 (2020). - PMC - PubMed
    1. Grinsell, D. & Keating, C. Peripheral nerve reconstruction after injury: a review of clinical and experimental therapies. BioMed. Res. Int.2014, 698256 (2014). - PMC - PubMed
    1. Padovano, W. M. et al. Incidence of nerve injury after extremity trauma in the United States. Hand17, 615–623 (2022). - PMC - PubMed

MeSH terms