. 2024 Oct 25;8(1):e202402990.
doi: 10.26508/lsa.202402990. Print 2025 Jan.

Structural and biochemical analysis of ligand binding in yeast Niemann-Pick type C1-related protein

Affiliations

Structural and biochemical analysis of ligand binding in yeast Niemann-Pick type C1-related protein

Lynette Nel et al. Life Sci Alliance. .

Abstract

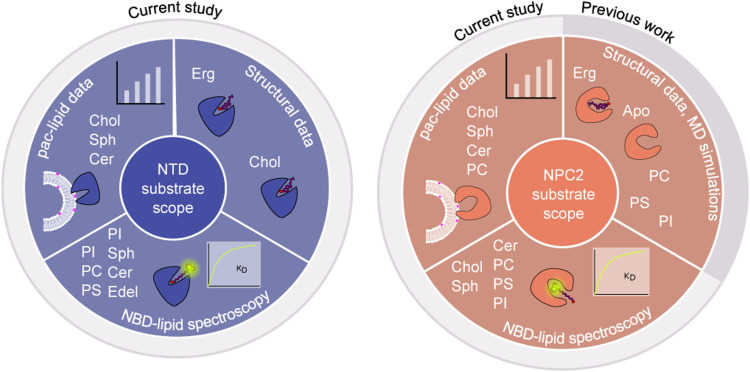
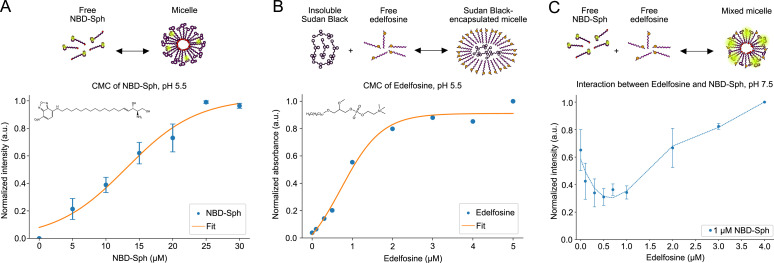
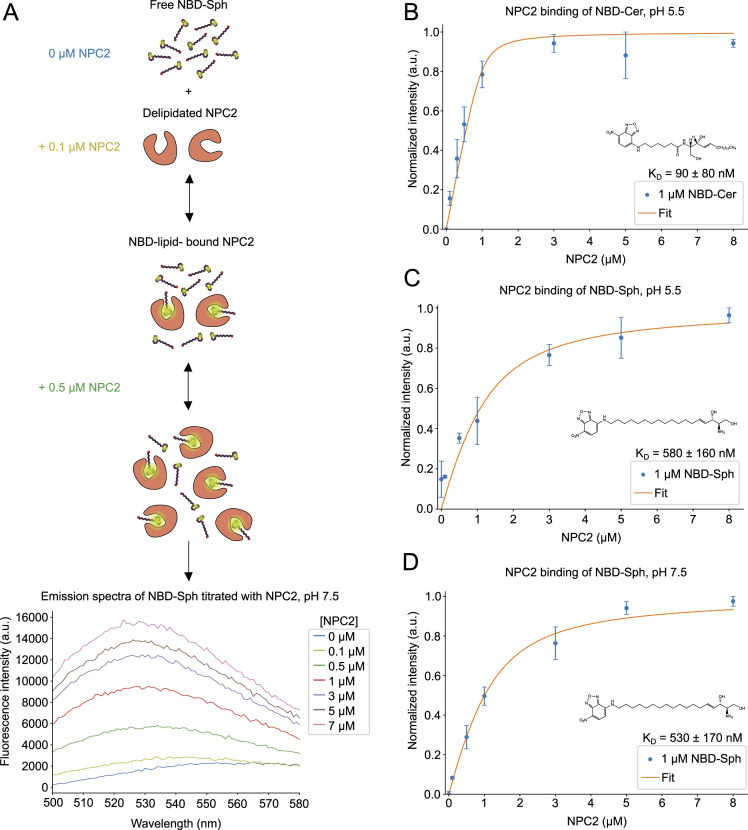
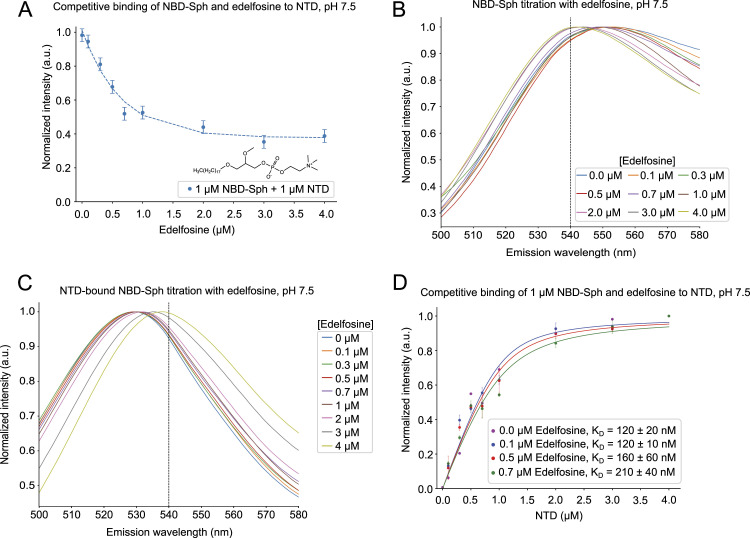
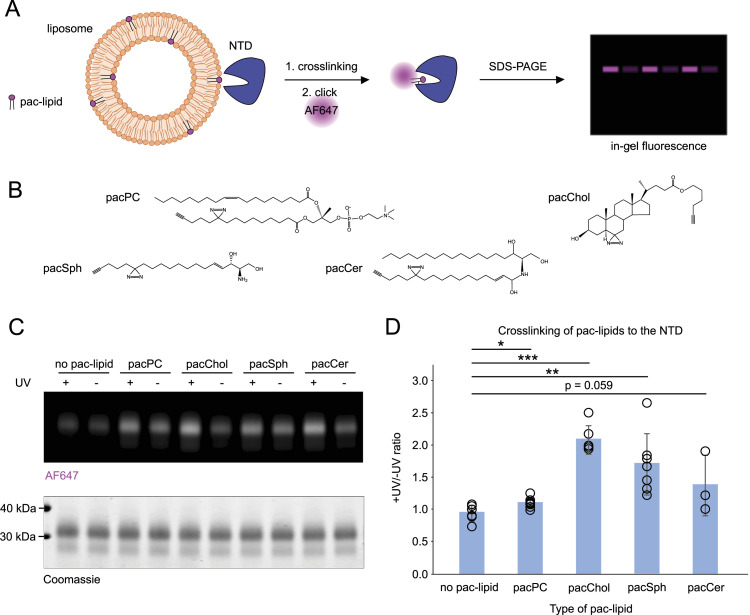
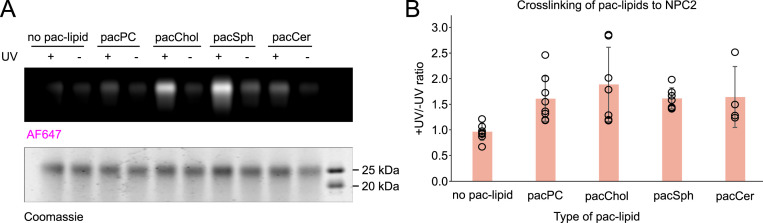
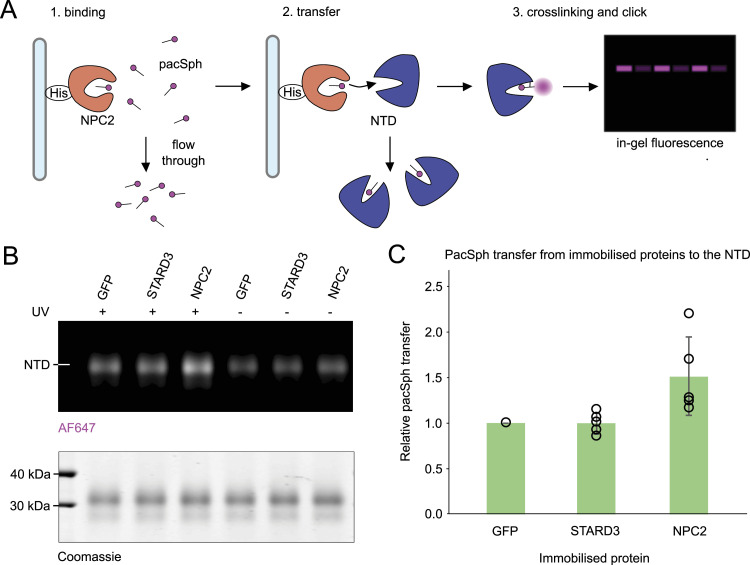
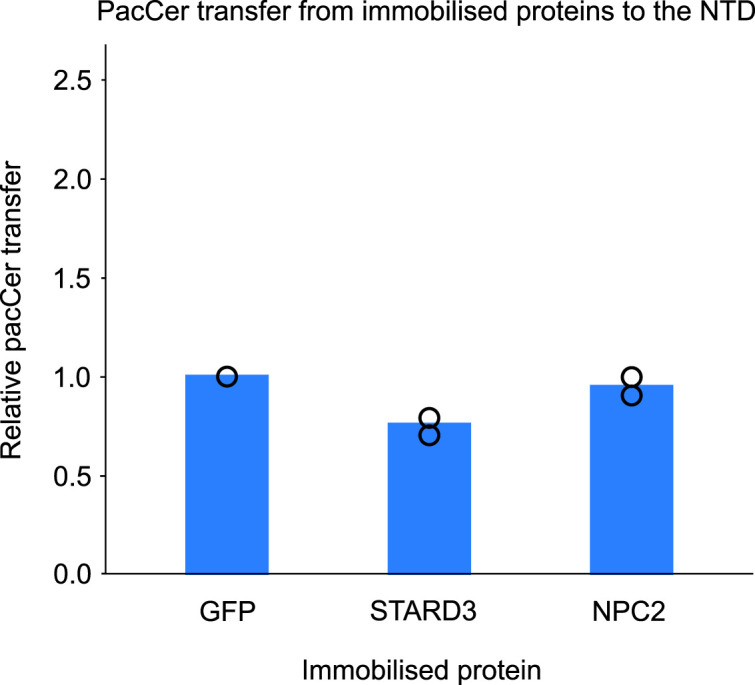
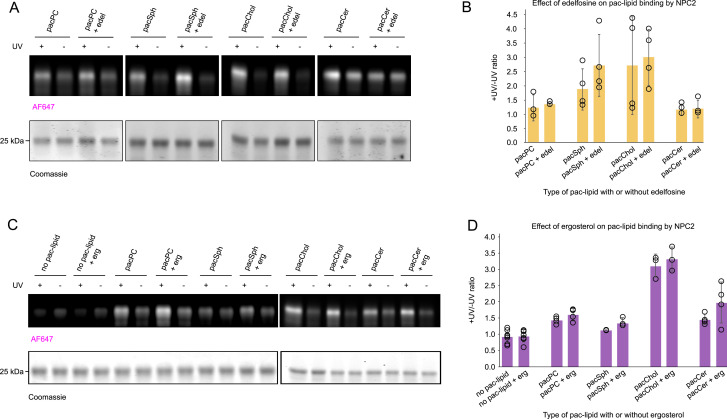
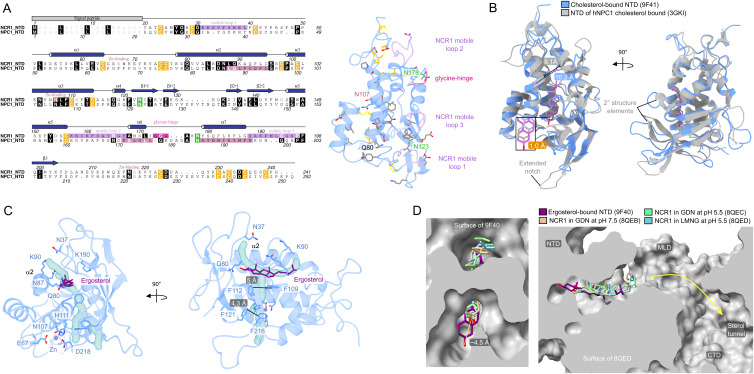
In eukaryotes, integration of sterols into the vacuolar/lysosomal membrane is critically dependent on the Niemann-Pick type C (NPC) system. The system consists of an integral membrane protein, called NCR1 in yeast, and NPC2, a luminal soluble protein that transfers sterols to the N-terminal domain (NTD) of NCR1 before membrane integration. Both proteins have been implicated in sterol homeostasis of yeast and humans. Here, we investigate sterol and lipid binding of the NCR1/NPC2 transport system and determine crystal structures of the sterol binding NTD. The NTD binds both ergosterol and cholesterol, with nearly identical conformations of the binding pocket. Apart from sterols, the NTD can also bind fluorescent analogs of phosphatidylinositol, phosphatidylcholine, and phosphatidylserine, as well as sphingosine and ceramide. We confirm the multi-lipid scope of the NCR1/NPC2 system using photo-crosslinkable and clickable lipid analogs, namely, pac-cholesterol, pac-sphingosine, and pac-ceramide. Finally, we reconstitute the transfer of pac-sphingosine from NPC2 to the NTD in vitro. Collectively, our results support that the yeast NPC system can work as versatile machinery for vacuolar homeostasis of structurally diverse lipids, besides ergosterol.


Conflict of interest statement

The authors declare that they have no conflict of interest.

Figures

None
Graphical abstract
Figure 1.
Figure 1.. Structures of the NTD bound to sterols.
(A) Structure of NCR1 (PDB ID: 6R4L) in gray with the NTD in color. NTD loading from NPC2 (PDB ID: 6R4N) is followed by transfer, transport, and integration by NCR1 into the vacuole membrane. (B) Secondary structure elements of the NTD. The NTD has seven α-helices, which are interrupted by two β-sheets between α4 and α5. After α7, the third β-sheet connects the NTD with the long loop leading to the M1 transmembrane helix. The color gradient starts as blue at the N-terminus and transitions to red at the C-terminus. (C) Chemical structure and density of ergosterol in the binding pocket of the NTD. The double bond between C22 and C23 makes the aliphatic tail of ergosterol rigid and can be seen within the continuous density in orange surrounding the molecule. (D) Residues surrounding ergosterol in the binding pocket of the NTD are mostly hydrophobic, except for Q80, N87, T113, and S196. The hydroxyl group of ergosterol is coordinated by Q80, 3.0 Å away. (E) Chemical structure and density of cholesterol in the binding pocket of the NTD. In cholesterol, the double bond is lacking between C22 and C23 and makes the aliphatic tail more flexible, as can be seen in the surrounding discontinuous orange density. (F) Residues surrounding cholesterol in the binding pocket of the NTD are the same as for ergosterol. The hydroxyl group of cholesterol is closer to Q80, 2.8 Å away.
Figure S1.
Figure S1.. Purification and crystallization of the NTD with all N-glycosylation sites.
(A) Construct used to overexpress the NTD that includes the signal peptide (SP), a representative SDS–PAGE gel of an NTD purification, a size-exclusion chromatography trace, and crystals obtained from the concentrated peak fraction at 10.5 ml. Samples for SDS–PAGE were collected throughout the purification. Lane 1: marker; lane 2: IMAC load; lane 3: IMAC flow-through; lane 4: wash flow-through; lane 5: wash + β-cyclodextrin flow-through; lane 6: wash flow-through; lane 7: G20 flow-through; lane 8: G40 flow-through; lane 9: SEC load; lane 10: SEC fraction 2; lane 11: SEC fraction 3; lane 12: SEC fraction 4; lane 13: SEC fraction 6; lane 14: peak SEC fraction 7; and lane 15: SEC fraction 8. (B) The NTD contains 16 cysteine residues, all of which are involved in forming eight disulfide bridges. The NTD also has three N-glycosylated residues and are partitioned to the opposite face compared with the disulfide bridges. (C) SDS–PAGE of the NTD treated with various deglycosylase enzymes. The size of the NTD decreased when treated with PNGase F and Endo F1 but remained unchanged when treated with Endo F2 and Endo F3, and was inconclusive with Endo H because of overlapping size with the NTD–see Materials and Methods section for details on cleavage sites. (D) Packing of four NTD monomers, Chain A to Chain D, in the asymmetric unit of the crystal. (E) Examples of density in gray surrounding the glycan branches from Chain A to Chain D.
Figure 2.
Figure 2.. Structural features of the NTD.
(A) Ion-coordinating residues are found at the opposite face of the substrate binding pocket. Density surrounding residues E67, N107, H111, D218, and the zinc ion are shown in orange. (B) Superposition of NTD structures bound to ergosterol and cholesterol. The sterols and residues of both binding pockets are overlain and show the same positioning between the two structures. (C) When overlaying the NTD bound to ergosterol and cholesterol, three “mobile loops” are displaced when comparing the two structures. These mobile loops cover the substrate binding pocket at the bottom, middle, and top. (D) Residues that form the “ridge” include N87, K90, and G194—with G194 being on “mobile loop 3”—and likely govern substrate accessibility to the binding pocket. The “ridge” divides the pocket into a “sterol opening,” with the aliphatic tail of the sterol being visible, and a “water opening,” which houses the hydroxyl group of the sterol.
Figure 3.
Figure 3.. NTD binding to phospholipids and sphingolipids.
(A) Overview of the principle behind the fluorescence binding assay. The graph shows representative raw emission spectra in a range of 500 to 580 nm of NBD-sphingosine (NBD-Sph), measured with varying concentrations of the NTD. The excitation wavelength was 460 nm. Measurements were conducted using a 1 μM NBD-Sph solution in 50 mM Tris (pH 7.5), while titrating increasing concentrations of the NTD. After the addition of NTD, the solution was incubated for 10 min to ensure equilibrium was reached before the next measurement. (B, C, D, E) Fluorescence for NBD-phosphatidylcholine, NBD-phosphatidylinositol, NBD-phosphatidylserine, and NBD-ceramide, respectively, is shown as a result of binding to increasing concentrations of the NTD at pH 5.5. The measurements were conducted at an excitation wavelength of 460 nm and emission wavelength of 530 nm. For each lipid–protein complex, a dissociation constant (KD) is determined and shown in the corresponding graphs. Data points show the mean ± SEM of three (n = 3) independent experiments. (F, G) Normalized fluorescence signal for NBD-Sph at an excitation wavelength of 460 nm and an emission wavelength of 530 nm shows increasing fluorescence intensity as a result of binding to increasing concentrations of NTD at pH 5.5 (F) or pH 7.5 (G). The KD-values are determined and shown in the graphs. Data points show the mean ± SEM of three (n = 3) independent experiments.
Figure S2.
Figure S2.. Critical micelle concentrations of NBD-sphingosine and edelfosine.
(A) Normalized fluorescence intensity of NBD-sphingosine (NBD-Sph) at different concentrations in MES buffer at pH 5.5. Excitation and emission wavelengths were 460 and 530 nm, respectively. The critical micelle concentration (CMC) is determined to be 13 μM. Data points show the mean ± SEM of three (n = 3) independent experiments. (B) Normalized absorbance of Sudan Black B at increasing concentrations of edelfosine in MES buffer at pH 5.5. The absorbance wavelength was 600 nm. The CMC of edelfosine is estimated to be 0.7 μM; however, the micelle formation might occur gradually as the concentration increases and start at the lowest concentration of 0.1 μM. The data are based on one (n = 1) experiment. (C) Normalized intensity of NBD-Sph when mixed with varying concentrations of edelfosine. As the concentration of edelfosine exceeds the suggested CMC, an increase in fluorescence of NBD-Sph occurs. Data are shown at excitation and emission wavelengths of 460 and 530 nm, respectively. Data points show the mean ± SEM of two (n = 2) independent experiments.
Figure S3.
Figure S3.. NBD-tagged sphingolipids bind to NPC2.
(A) Overview of the principle behind the fluorescence binding assay. The graph shows representative raw emission spectra in a range of 500 to 580 nm of NBD-sphingosine (NBD-Sph), measured with varying concentrations of NPC2. Measurements were conducted at an excitation wavelength of 460 nm. The dissociation constant (KD) is 90 ± 80 nM. Data points show the mean ± SEM of three (n = 3) independent experiments. (B, C, D) Normalized fluorescence signal for NBD-sphingosine shows increasing fluorescence intensity because of binding to increasing concentrations of NPC2 at pH 5.5 (B, C) or pH 7.5 (D). Data are shown at an excitation wavelength of 460 nm and an emission wavelength of 530 nm. The KD-values are 580 ± 160 nM at pH 5.5 and 530 ± 170 nM at pH 7.5. Data points show the mean ± SEM of three (n = 3) independent experiments.
Figure 4.
Figure 4.. Competitive binding of edelfosine and sphingosine to the NTD.
(A) Normalized fluorescence of 1 μM NBD-sphingosine (NBD-Sph) mixed with 1 μM NTD, with concentrations ranging from 0 to 4 μM of edelfosine at pH 7.5. The excitation and emission wavelengths are 460 nm and 530 nm, respectively. The IC50 is estimated to be 0.5 μM. The data points show the mean ± SEM of three (n = 3) independent experiments. (B) Each emission spectrum of 1 μM NBD-Sph with varying edelfosine concentrations at pH 7.5 normalized to 1. The measurements were obtained using an excitation wavelength of 460 nm. The dashed line marks 540 nm. (C) Similar to (B) but with 1 μM NTD in the solution. (D) Normalized NBD-signal of 1 μM NBD-Sph incubated with either 0 (magenta), 0.1 (blue), 0.5 (red), or 0.7 (green) μM edelfosine at increasing concentrations of the NTD. The data points show the mean ± SEM of three (n = 3) independent experiments in the presence of edelfosine, whereas the data points without edelfosine show the mean of two (n = 2) independent experiments.
Figure 5.
Figure 5.. NTD crosslinking with pac-lipids.
(A) Schematic of the liposome crosslinking assay performed for experiments shown in (C) and quantified in (D). (B) Structures of pac-lipids used in the experiments. (C) Representative gel image shows the crosslinking profile of purified NTD. Liposomes containing 1.5 mol% of indicated pac-lipids (1 μM pac-lipid) were incubated with 1.5 μM NTD and UV-crosslinked. Protein–lipid complexes were subjected to the click reaction with AF647-picolyl azide and visualized by SDS–PAGE. In-gel fluorescence of AF647 was normalized to loaded protein in each well based on Coomassie staining. (D) Normalized in-gel fluorescence is quantified as the +UV/−UV signal ratio. N = at least three independent experiments.
Figure S4.
Figure S4.. NPC2 crosslinking with pac-lipids.
(A) Representative gel image with crosslinking profile of purified NPC2. Liposomes containing 1.5 mol% of indicated pac-lipids (1 μM pac-lipid) were incubated with 1.5 μM NPC2 and UV-crosslinked. Protein–lipid complexes were subjected to the click reaction with AF647-picolyl azide and visualized by SDS–PAGE. In-gel fluorescence of AF647 was normalized to loaded protein in each well based on Coomassie staining. (B) Normalized in-gel fluorescence is quantified as the +UV/−UV signal ratio. N = at least four independent experiments.
Figure 6.
Figure 6.. Pac-lipid transfer assay to the NTD.
(A) Schematic of the pacSph transfer assay performed for experiments shown in (B) and quantified in (C). (B) Representative gel image showing the fluorescently labeled pacSph-NTD complexes. Soluble pacSph was incubated with His-tagged GFP (normalization control), STARD3 (negative control), or NPC2. Unbound pacSph was washed away, and then, His-tagged proteins were incubated with soluble untagged NTD. After 1 h of incubation, the NTD was subjected to UV crosslinking and the click reaction with AF647. Crosslinked and stained protein–lipid complexes were resolved on SDS–PAGE. In-gel fluorescence of AF647 was first normalized to loaded protein. Then, +UV/−UV ratios were calculated. The +UV/−UV ratio of GFP was used as baseline (=value 1 for each experiment). (C) Quantification of normalized in-gel fluorescence. N = at least five independent experiments.
Figure S5.
Figure S5.. Quantification of normalized in-gel fluorescence of the pacCer transfer assay.
The pacCer transfer assay was performed in the same way as the pacSph transfer assay described in Fig 6. N = 2 independent experiments.
Figure S6.
Figure S6.. Impact of edelfosine and ergosterol on NPC2 crosslinking with pac-lipids.
(A) Representative gel image with results of a crosslinking assay. Liposomes containing 1.5 mol% of indicated pac-lipids were supplemented with 7.5 mol% edelfosine (final concentration is 1 μM pac-lipid and 5 μM edelfosine), incubated with 1.5 μM NPC2, and UV-crosslinked. Protein–lipid complexes were subjected to the click reaction with AF647-picolyl azide and visualized by SDS–PAGE. In-gel fluorescence of AF647 was normalized to loaded protein in each well based on Coomassie staining. (B) Normalized in-gel fluorescence is quantified as the +UV/-UV signal ratio. N = at least four independent experiments. (C) Representative gel image with results of a crosslinking assay. Liposomes containing 1.5 mol% of indicated pac-lipids supplemented with 20 mol% ergosterol (final concentration is thus 1 μM pac-lipid and 13 μM ergosterol). The assay was carried out as described in (A). (D) Quantification of the normalized +UV/−UV signal, as described in (B). N = at least three independent experiments.
Figure S7.
Figure S7.. Comparison of the NTD with that of hNPC1 and full-length NCR1.
(A) Sequence alignment of the NTD and the NTD of hNPC1. Secondary structure annotation is based on the NTD of NCR1. The model of the NTD is colored according to the alignment: conserved residues (gray), disulfide bridges (orange), N-glycosylated residues (green), mobile loops (light purple), glycine hinge (pink), and Zn binding site (light brown). (B) Superposition of the NTD (PDB ID: 9F41) and the NTD of hNPC1 (PDB ID: 3GKI) bound to cholesterol. (C) A hydrophobic, solvent-accessible pocket extends from the substrate binding pocket toward the ion coordination site. (D) Superposition of the NTD bound to ergosterol (PDB ID: 9F40) with the cryo-EM structures of full-length NCR1 (PDB IDs: 8QEB at pH 7.5, and 8QEC and 8QED both at pH 5.5).

Similar articles

References

    1. Winkler MBL, Nel L, Frain KM, Dedic E, Olesen E, Pedersen BP (2022) Sterol uptake by the NPC system in eukaryotes: A Saccharomyces cerevisiae perspective. FEBS Lett 596: 160–179. 10.1002/1873-3468.14253 - DOI - PubMed
    1. Krause MR, Regen SL (2014) The structural role of cholesterol in cell membranes: From condensed bilayers to lipid rafts. Acc Chem Res 47: 3512–3521. 10.1021/ar500260t - DOI - PubMed
    1. Schade DS, Shey L, Eaton RP (2020) Cholesterol review: A metabolically important molecule. Endocr Pract 26: 1514–1523. 10.4158/EP-2020-0347 - DOI - PubMed
    1. Meng Y, Heybrock S, Neculai D, Saftig P (2020) Cholesterol handling in lysosomes and beyond. Trends Cell Biol 30: 452–466. 10.1016/j.tcb.2020.02.007 - DOI - PubMed
    1. Kohler V, Aufschnaiter A, Buttner S (2020) Closing the gap: Membrane contact sites in the regulation of autophagy. Cells 9: 1184. 10.3390/cells9051184 - DOI - PMC - PubMed

MeSH terms

LinkOut - more resources