. 2024 Oct 17;14(10):556.
doi: 10.3390/metabo14100556.

Silybin Meglumine Mitigates CCl4-Induced Liver Fibrosis and Bile Acid Metabolism Alterations

Affiliations

Silybin Meglumine Mitigates CCl4-Induced Liver Fibrosis and Bile Acid Metabolism Alterations

Xiaoxin Liu et al. Metabolites. .

Abstract

Background: Altered patterns of bile acids (BAs) are frequently present in liver fibrosis, and BAs function as signaling molecules to initiate inflammatory responses. Silybin meglumine (SLB-M) is widely used in treating various liver diseases including liver fibrosis. However, research on its effects on bile acid (BA) metabolism is limited. This study investigated the therapeutic effects of SLB-M on liver fibrosis and BA metabolism in a CCl4-induced murine model.

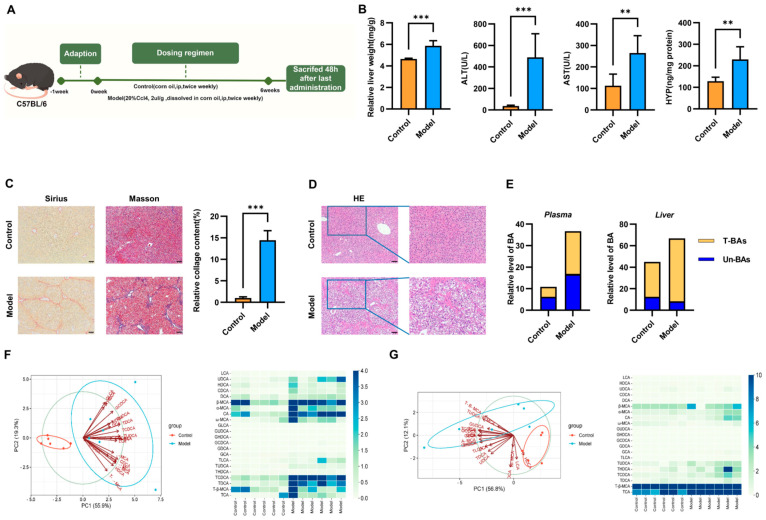
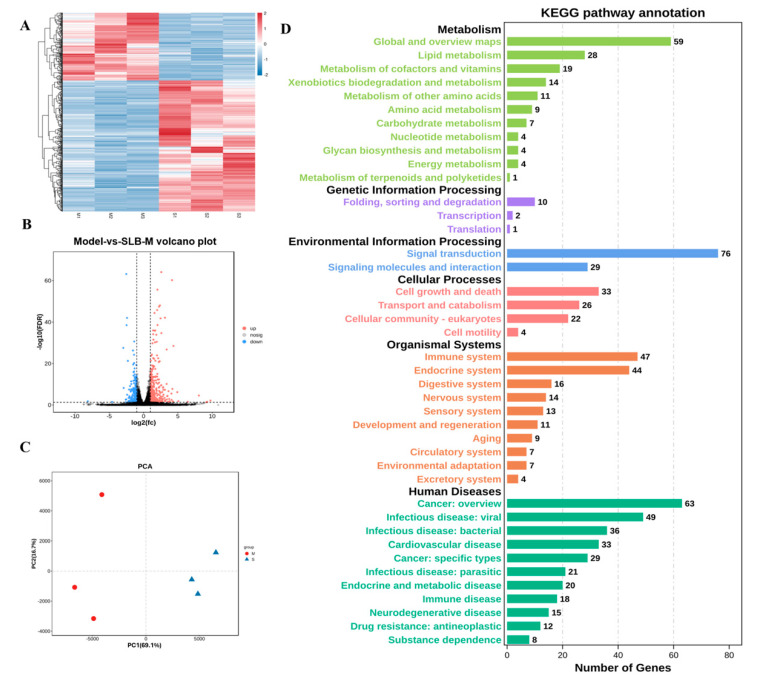
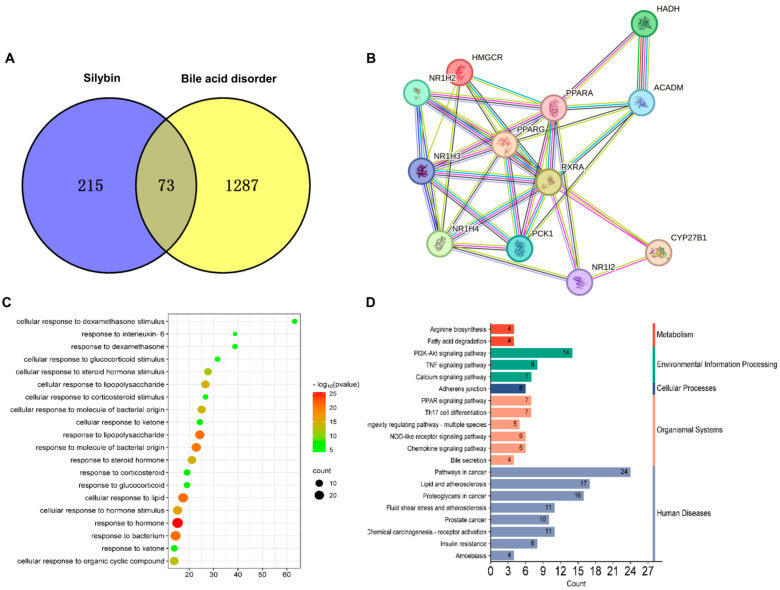
Methods: A murine liver fibrosis model was induced by CCl4. Fibrosis was evaluated using HE, picrosirius red, and Masson's trichrome staining. Liver function was assessed by serum and hepatic biochemical markers. Bile acid (BA) metabolism was analyzed using LC-MS/MS. Bioinformatics analyses, including PPI network, GO, and KEGG pathway analyses, were employed to explore molecular mechanisms. Gene expression alterations in liver tissue were examined via qRT-PCR.

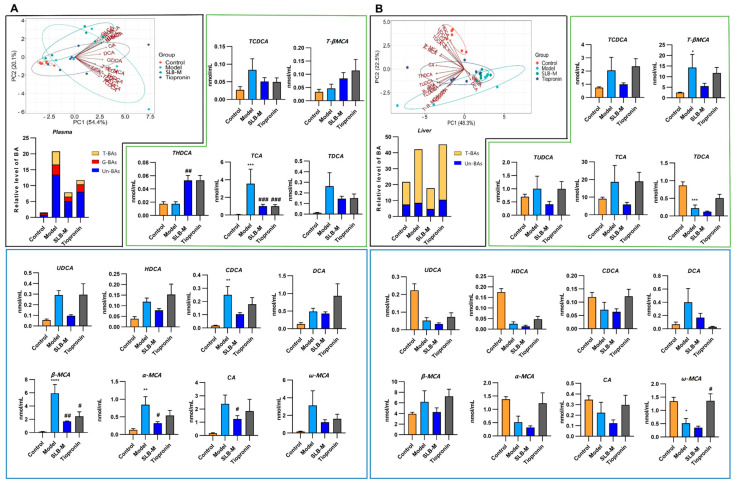
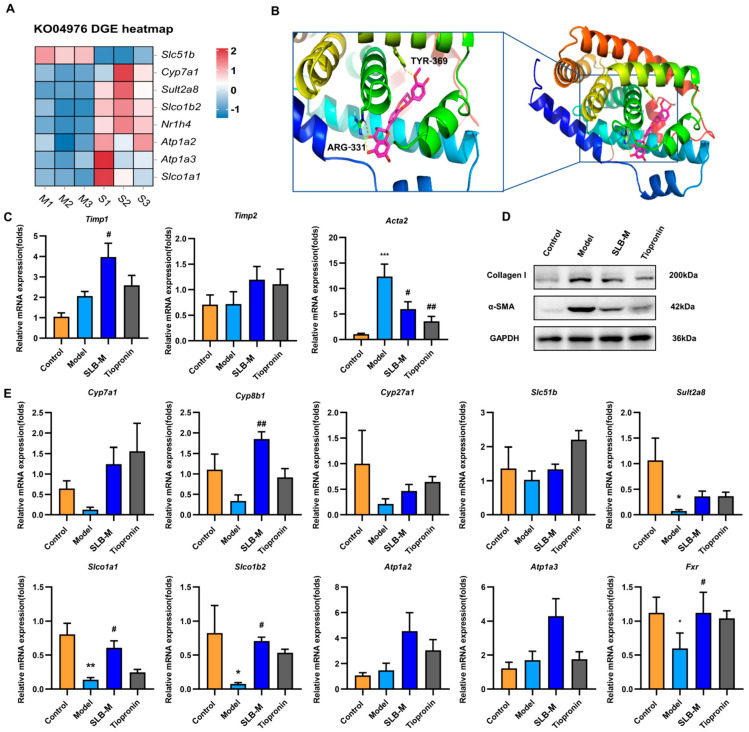
Results: SLB-M treatment resulted in significant histological improvements in liver tissue, reducing collagen deposition and restoring liver architecture. Biochemically, SLB-M not only normalized serum liver enzyme levels (ALT, AST, TBA, and GGT) but also mitigated disruptions in both systemic and hepatic BA metabolism by increased unconjugated BAs like cholic acid and chenodeoxycholic acid but decreased conjugated BAs including taurocholic acid and taurodeoxycholic acid, compared to that in CCl4-induced murine model. Notably, SLB-M efficiently improved the imbalance of BA homeostasis in liver caused by CCl4 via activating Farnesoid X receptor.

Conclusions: These findings underscore SLB-M decreased inflammatory response, reconstructed BA homeostasis possibly by regulating key pathways, and gene expressions in BA metabolism.

Keywords: bile acid; bioinformatics; carbon tetrachloride; liver fibrosis; silybin meglumine.


Conflict of interest statement

The authors declare that they have no competing interests.

Figures

Figure 1
Figure 1
Carbon tetrachloride (CCL4)-induced liver fibrosis and bile acid profile alterations in a mouse model. (A) A schematic overview of the murine model (by Figdraw 2.0, Hangzhou, China). (B) Graphical representation of liver weight and serum markers of liver function. (C) Comparative histological outcomes, picrosirius red (left) and Masson’s trichrome (right), to visualize collagen presence and fibrosis. Scale bar = 100 µm. Relative collagen content of Masson staining. Data represent at least three independent experiments with triplicate measurements. (D) Liver sections were stained with hematoxylin and eosin (HE) to visualize structural changes. Scale bar = 100 µm. (E) The concentrations of unconjugated BAs and glycine (G)-conjugated and taurine (T)-conjugated BAs in blood and liver samples. (F) Principal component analysis (PCA) plots illustrate the distinct metabolic profiles of BAs between the control and model groups in blood and quantification of individual BAs in blood by LC-MS/MS. (G) Principal component analysis (PCA) plots illustrate the distinct metabolic profiles of BAs between the control and model groups in liver sample and quantification of individual BAs in liver by LC-MS/MS. Data are expressed as mean ± SEM; ** p < 0.01, *** p < 0.001 vs. control n = 6; HYP: hydroxyproline; ALT: alanine aminotransferase, AST: aspartate aminotransferase.
Figure 2
Figure 2
Therapeutic effects of silybin meglumine and tiopronin on CCl4-induced liver fibrosis in C57BL/6 mice. (A) Comparative histological outcomes, picrosirius red and Masson’s trichrome, to visualize collagen presence and fibrosis. Scale bar = 100 µm. Relative collagen content of Masson staining. Data represent at least three independent experiments with triplicate measurements. (B) Liver sections were stained with hematoxylin and eosin (HE) to visualize structural changes. (C) Body weight trajectories of mice over the study period. (D) Serum levels of alanine aminotransferase (ALT), aspartate aminotransferase (AST), gamma-glutamyl transferase (GGT), alkaline phosphatase (ALP). (E) Quantification of liver weight to body weight ratio. (F,G) Liver tissue levels of hydroxyproline (HYP), malondialdehyde (MDA), total bile acids (TBA), and blood levels of TBA. Data are represented as mean ± SEM; * p < 0.05, ** p < 0.01, *** p < 0.001 vs. control; # p < 0.05, ## p < 0.01, ### p < 0.001 vs. model; n = 6.
Figure 3
Figure 3
PCA plots and bar graphs from LC-MS/MS analysis demonstrated the modulation of BA profiles by silybin meglumine treatment in the plasma (A) and liver (B) of control, model and silybin meglumine- and tiopronin-treated mice. Data are represented as mean ± SEM; * p < 0.05, ** p < 0.01, *** p < 0.001, **** p < 0.0001 vs. control; # p < 0.05, ## p < 0.01, ### p < 0.001 vs. model; n = 6.
Figure 4
Figure 4
Identification of differentially expressed genes (DEGs) in liver tissues from silybin meglumine-treated mice (S1–S3) and untreated model mice (M1–M3). (A) Heatmap with hierarchical clustering depicts gene expression levels across samples. (B) A PCA scatter plot demonstrates the separation between the two groups. (C) A volcano plot identifies DEGs based on log2 fold-change and adjusted p-value. (D) KEGG pathway analysis indicates the predominant involvement of DEGs in various pathways.
Figure 5
Figure 5
Bioinformatics analysis of silybin meglumine’s therapeutic mechanism. (A) Venn diagram displaying the overlap of silybin targets and genes associated with bile acid disorder. (B) Protein–protein interaction (PPI) network for the 12 intersecting genes. (C) Gene ontology (GO) analysis outcomes. (D) Kyoto Encyclopedia of Genes and Genomes (KEGG) pathway analysis results.
Figure 6
Figure 6
Differential gene expression analysis related to bile secretion and validation of the impact of silybin meglumine on gene expression in liver fibrosis and bile secretion. (A) A heatmap displays differential gene expression in the bile secretion pathway (ko04976) in silybin meglumine-treated (S1, S2, S3) versus model group samples (M1, M2, M3) (n = 3). Schematic representation of the bile secretion pathway with emphasis on OATPs, Cyp7a1, Fxr, Sult2a1, and OST-β. (B) A 3D visualization of the protein–ligand complex demonstrates the spatial conformation of the secondary structures of Fxr around silybin. (C) A qRT-PCR was performed to validate the impact of SLB-M on gene expression in liver fibrosis from control, model and SLB-M- and tiopronin-treated mice. (D) The protein expression of α-SMA and Col1a1 in liver tissue, detected by Western blot. GAPDH was used as a reference control for equal protein loading. (E) A qRT-PCR was performed to validate the impact of SLB-M on gene expression in bile secretion from control, model and SLB-M- and tiopronin-treated mice liver tissue. Data are represented as mean ± SEM; * p < 0.05, ** p < 0.01, *** p < 0.001 vs. control; # p < 0.05, ## p < 0.01 vs. model; n = 6.

Similar articles

References

    1. Dhar D., Baglieri J., Kisseleva T., Brenner D.A. Mechanisms of liver fibrosis and its role in liver cancer. Exp. Biol. Med. 2020;245:96–108. doi: 10.1177/1535370219898141. - DOI - PMC - PubMed
    1. Acharya P., Chouhan K., Weiskirchen S., Weiskirchen R. Cellular mechanisms of liver fibrosis. Front. Pharmacol. 2021;12:671640. doi: 10.3389/fphar.2021.671640. - DOI - PMC - PubMed
    1. Ginès P., Krag A., Abraldes J.G., Solà E., Fabrellas N., Kamath P.S. Liver cirrhosis. Lancet. 2021;398:1359–1376. doi: 10.1016/S0140-6736(21)01374-X. - DOI - PubMed
    1. Pinter M., Trauner M., Peck-Radosavljevic M., Sieghart W. Cancer and liver cirrhosis: Implications on prognosis and management. ESMO Open. 2016;1:e000042. doi: 10.1136/esmoopen-2016-000042. - DOI - PMC - PubMed
    1. Arroyo V., Moreau R., Kamath P.S., Jalan R., Ginès P., Nevens F., Fernández J., To U., García-Tsao G., Schnabl B. Acute-on-chronic liver failure in cirrhosis. Nat. Rev. Dis. Primers. 2016;2:16041. doi: 10.1038/nrdp.2016.41. - DOI - PubMed

LinkOut - more resources