. 2024 Oct 19;13(20):1733.
doi: 10.3390/cells13201733.

AREG Upregulation in Cancer Cells via Direct Interaction with Cancer-Associated Fibroblasts Promotes Esophageal Squamous Cell Carcinoma Progression Through EGFR-Erk/p38 MAPK Signaling

Affiliations

AREG Upregulation in Cancer Cells via Direct Interaction with Cancer-Associated Fibroblasts Promotes Esophageal Squamous Cell Carcinoma Progression Through EGFR-Erk/p38 MAPK Signaling

Takashi Nakanishi et al. Cells. .

Abstract

Cancer-associated fibroblasts (CAFs) are a key component of the tumor microenvironment and significantly contribute to the progression of various cancers, including esophageal squamous cell carcinoma (ESCC). Our previous study established a direct co-culture system of human bone marrow-derived mesenchymal stem cells (progenitors of CAFs) and ESCC cell lines, which facilitates the generation of CAF-like cells and enhances malignancy in ESCC cells. In this study, we further elucidated the mechanism by which CAFs promote ESCC progression using cDNA microarray analysis of monocultured ESCC cells and those co-cultured with CAFs. We observed an increase in the expression and secretion of amphiregulin (AREG) and the expression and phosphorylation of its receptor EGFR in co-cultured ESCC cells. Moreover, AREG treatment of ESCC cells enhanced their survival and migration via the EGFR-Erk/p38 MAPK signaling pathway. Immunohistochemical analysis of human ESCC tissues showed a positive correlation between the intensity of AREG expression at the tumor-invasive front and the expression level of the CAF marker FAP. Bioinformatics analysis confirmed significant upregulation of AREG in ESCC compared with normal tissues. These findings suggest that AREG plays a crucial role in CAF-mediated ESCC progression and could be a novel therapeutic target for ESCC.

Keywords: amphiregulin (AREG); cancer-associated fibroblasts (CAFs); direct co-culture; epidermal growth factor receptor (EGFR); esophageal squamous cell carcinoma (ESCC).


Conflict of interest statement

The authors declare no conflicts of interest.

Figures
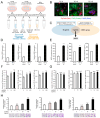
Figure 1
Figure 1
Amphiregulin (AREG) in esophageal squamous cell carcinoma (ESCC) cells induced by direct co-culture with cancer-associated fibroblast (CAF)-like cells promotes survival and migration of ESCC cells: (A) A schematic representation of the experimental design of the direct co-culture and cDNA microarray analysis. ESCC cell lines (TE-9, -10, and -15) and mesenchymal stem cells (MSCs) were co-cultured in the same dish for 4 d. Individually cultured ESCC cell lines and MSCs were prepared as control monocultures. Following monoculture or co-culture, cells were separated using epithelial cell adhesion molecule (EpCAM) microbeads. EpCAM-positive and EpCAM-negative cells after co-culture were defined as TE co (TE-9, -10, and -15 co) and CAF-like cells (CAF9, 10, and 15), respectively. Similarly, ESCC cell lines and MSCs after monoculture were defined as TE mono (TE-9, -10, and -15 mono) and MSC mono, respectively. While a previous study analyzed gene expression between MSC mono and CAF9, this study focuses on gene expression changes between TE-9 mono and TE-9 co using cDNA microarray analysis. (B) Double immunofluorescence staining for EpCAM (red) and FAP (green) was performed on a direct co-culture of ESCC cells and MSCs. The nucleus of each cell was counterstained with DAPI (blue). (C) Venn diagram depicting the overlap between genes exhibiting a global normalization threshold of TE-9 co > 100 and TE-9 co/TE-9 mono ratio > 4 in the cDNA microarray analysis as well as genes displaying a global normalization threshold of MSC mono and CAF9 < 100 in the previous analysis. Five genes were identified that overlapped between the two groups, with AREG showing the highest fold change. (D,E) The mRNA expression and secreted protein levels of AREG in TE mono and TE co were compared using qRT-PCR (D) and enzyme-linked immunosorbent assay (E). (F,G) The effects of recombinant human AREG (rhAREG) (10 and 100 ng/mL) on the survival (F) and growth (G) of ESCC cells were evaluated using the MTS assay. (H) The effect of rhAREG (1, 10, and 100 ng/mL) on the migration of ESCC cells was evaluated using the transwell migration assay. ESCC cells were seeded in the upper chamber, and migrated cells were counted in five representative fields of view using a microscope after 48 h. Representative images for each condition are presented below the graphs. The data are presented as the mean ± standard error of the mean (SEM) of three independent experiments (DH). N.S., not significant; * p < 0.05, ** p < 0.01, *** p < 0.001. Scale bars: 50 μm (B); and 100 μm (H).
Figure 2
Figure 2
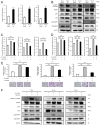
Direct co-culture with CAF-like cells promotes survival, growth, and migration of ESCC cells through the activation of the EGFR-Erk/p38 MAPK signaling pathway: (A) The mRNA expression levels of EGFR in TE mono and TE co were compared using qRT-PCR. (B) The protein expression levels of EGFR, pEGFR (Tyr1068), Erk, pErk, p38 MAPK, and pp38 MAPK in TE mono and TE co were compared using Western blotting. β-actin was used as a loading control. (CE) To investigate the role of EGFR phosphorylation on the survival, growth, and migration of ESCC cells co-cultured with CAF-like cells, the effect of EGFR tyrosine kinase inhibitor AG1478 was examined in using the MTS assay (C,D) and transwell migration assay (E). ESCC cells were pretreated with AG1478 (10 μM) or DMSO as a control for 24 h before the start of the co-culture. ESCC cells were seeded in the upper chamber, and migrated cells were counted in five fields of view after 48 h (E). Representative images for each condition are presented below the graphs (E). (F) To investigate the effect of AG1478 or DMSO on the signaling pathways activated in ESCC cells co-cultured with CAFs, the protein expression levels of EGFR, pEGFR (Tyr1068), Erk, pErk, p38 MAPK, and pp38 MAPK in TE mono and TE co were compared using Western blotting. ESCC cells were treated with AG1478 (10 μM) or DMSO as a control for 24 h before co-culture. β-actin was used as a loading control. The data are presented as the mean ± SEM of three independent experiments (A,CE). * p < 0.05, ** p < 0.01, *** p < 0.001. Scale bars: 100 μm (E).
Figure 3
Figure 3
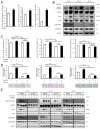
AREG promotes survival and migration of ESCC cells via the EGFR-Erk/p38 MAPK signaling pathway: (A) To investigate the effect of AREG on the mRNA expression levels of EGFR in ESCC cells, qRT-PCR was performed in TE cells with or without rhAREG (100 ng/mL). (B) To investigate the effect of AREG on the protein expression levels of EGFR, pEGFR (Tyr1068), Erk, pErk, p38 MAPK, and pp38 MAPK in ESCC cells, Western blotting was performed in TE cells with or without rhAREG (100 ng/mL). (C,D) To investigate the effects of AG1478 on the rhAREG-induced survival and migration of ESCC cells, the MTS assay (C) and transwell migration assay (D) were performed. ESCC cells were pretreated with AG1478 (10 μM) or DMSO as a control for 24 h before each assay. ESCC cells were seeded in the upper chamber, and migrated cells were counted in five fields of view after 48 h (D). Representative images for each condition are presented below the graphs (D). (E) To investigate the effect of AG1478 on rhAREG-induced signaling pathways in ESCC cells, the protein expression levels of EGFR, pEGFR (Tyr1068), Erk, pErk, p38 MAPK, and pp38 MAPK were compared using Western blotting. ESCC cells were pretreated with AG1478 (10 μM) or DMSO as a control for 24 h before treatment with rhAREG for 0, 10, 30, and 60 min. β-actin was used as a loading control. The data are presented as the mean ± SEM of three independent experiments (A,C,D). N.S., not significant; * p < 0.05, ** p < 0.01, *** p < 0.001. Scale bars: 100 μm (D).
Figure 4
Figure 4
AREG promotes migration and CAF-like differentiation of MSCs: (A,B) To investigate the differentiation of MSCs into CAFs upon treatment with rhAREG (100 ng/mL), the mRNA and protein expression levels of FAP, IL-6, and αSMA were compared using qRT-PCR (A) and Western blotting (B). β-actin was used as a loading control (B). (C,D) The effects of rhAREG (100 ng/mL) on the survival (C) and growth (D) of MSCs were evaluated using the MTS assay. (E) The effect of rhAREG (100 ng/mL) on the migration of MSCs was evaluated using the transwell migration assay. MSCs were seeded in the upper chamber, and migrated cells were counted in five fields of view after 48 h. Representative images for each condition are presented below the graph (E). The data are presented as the mean ± SEM of three independent experiments (A,CE). N.S., not significant; ** p < 0.01, *** p < 0.001. Scale bars: 100 μm (E).
Figure 5
Figure 5
Significance of AREG expression in ESCC tissues: (A) Representative images of low (left) and high (right) expression of AREG in the tumor-invasive front (low-power field, 40×; high-power field, 200×). The corresponding normal squamous epithelium is shown as an inset within the high-power field. Scale bars: 400 μm (low-power field and insets in high-power field); and 100 μm (high-power field). (B) Kaplan–Meier analysis of overall survival, disease-free survival, and cancer-specific survival in 67 patients (one patient was excluded from the analysis due to a lack of postoperative outcomes) with ESCC stratified by AREG immunohistochemical staining intensity. The data were analyzed using the log-rank test. (C) Spearman correlation analysis of AREG and FAP gene expression levels in ESCC tissues using the TNMplot database. (D) AREG gene expression levels in normal and ESCC tissues using the TNMplot database.
Figure 6
Figure 6
A schematic representation of AREG’s role in ESCC-MSC interactions. AREG secretion from ESCC cells, enhanced through direct contact with MSCs, promotes cell survival and migration via the EGFR-Erk/p38 MAPK signaling pathway. AREG also enhances the migration of MSCs and their differentiation into CAFs.

Similar articles

References

    1. Bray F., Laversanne M., Sung H., Ferlay J., Siegel R.L., Soerjomataram I., Jemal A. Global cancer statistics 2022: GLOBOCAN estimates of incidence and mortality worldwide for 36 cancers in 185 countries. CA Cancer J. Clin. 2024;74:229–263. doi: 10.3322/caac.21834. - DOI - PubMed
    1. Morgan E., Soerjomataram I., Rumgay H., Coleman H.G., Thrift A.P., Vignat J., Laversanne M., Ferlay J., Arnold M. The Global Landscape of Esophageal Squamous Cell Carcinoma and Esophageal Adenocarcinoma Incidence and Mortality in 2020 and Projections to 2040: New Estimates from GLOBOCAN 2020. Gastroenterology. 2022;163:649–658.e642. doi: 10.1053/j.gastro.2022.05.054. - DOI - PubMed
    1. Li W., Xu T., Jin H., Li M., Jia Q. Emerging role of cancer-associated fibroblasts in esophageal squamous cell carcinoma. Pathol. Res. Pract. 2024;253:155002. doi: 10.1016/j.prp.2023.155002. - DOI - PubMed
    1. Biffi G., Tuveson D.A. Diversity and Biology of Cancer-Associated Fibroblasts. Physiol. Rev. 2021;101:147–176. doi: 10.1152/physrev.00048.2019. - DOI - PMC - PubMed
    1. Paszek M.J., Zahir N., Johnson K.R., Lakins J.N., Rozenberg G.I., Gefen A., Reinhart-King C.A., Margulies S.S., Dembo M., Boettiger D., et al. Tensional homeostasis and the malignant phenotype. Cancer Cell. 2005;8:241–254. doi: 10.1016/j.ccr.2005.08.010. - DOI - PubMed

MeSH terms