. 2024 Oct 23;22(1):490.
doi: 10.1186/s12916-024-03710-7.

Hexokinase 2 expression in apical enterocytes correlates with inflammation severity in patients with inflammatory bowel disease

Affiliations

Hexokinase 2 expression in apical enterocytes correlates with inflammation severity in patients with inflammatory bowel disease

Saskia Weber-Stiehl et al. BMC Med. .

Abstract

Background: Inflammation is characterized by a metabolic switch promoting glycolysis and lactate production. Hexokinases (HK) catalyze the first reaction of glycolysis and inhibition of epithelial HK2 protected from colitis in mice. HK2 expression has been described as elevated in patients with intestinal inflammation; however, there is conflicting data from few cohorts especially with severely inflamed individuals; thus, systematic studies linking disease activity with HK2 levels are needed.

Methods: We examined the relationship between HK2 expression and inflammation severity using bulk transcriptome data derived from the mucosa of thoroughly phenotyped inflammatory bowel disease (IBD) patients of two independent cohorts including both subtypes Crohn's disease (CD) and ulcerative colitis (UC). Publicly available single-cell RNA sequencing data were analyzed, and immunofluorescence staining on colonic biopsies of unrelated patients with intestinal inflammation was performed to confirm the RNA-based findings on cellular and protein level.

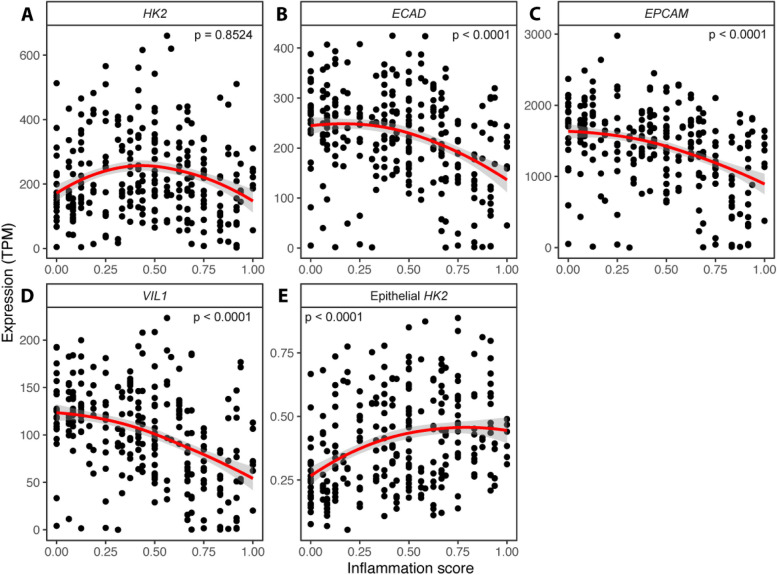
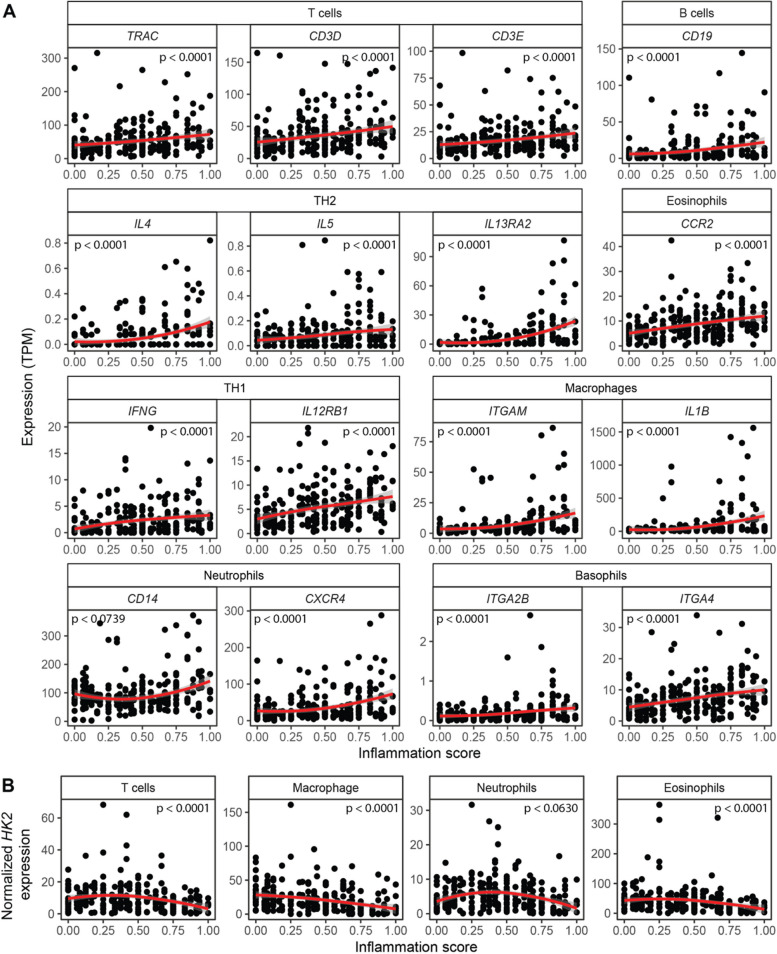
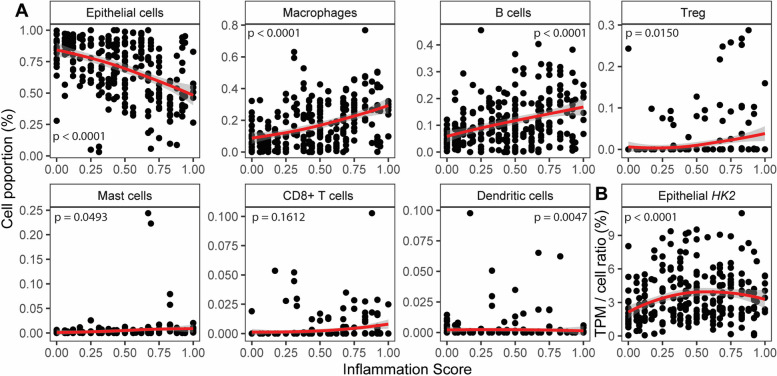
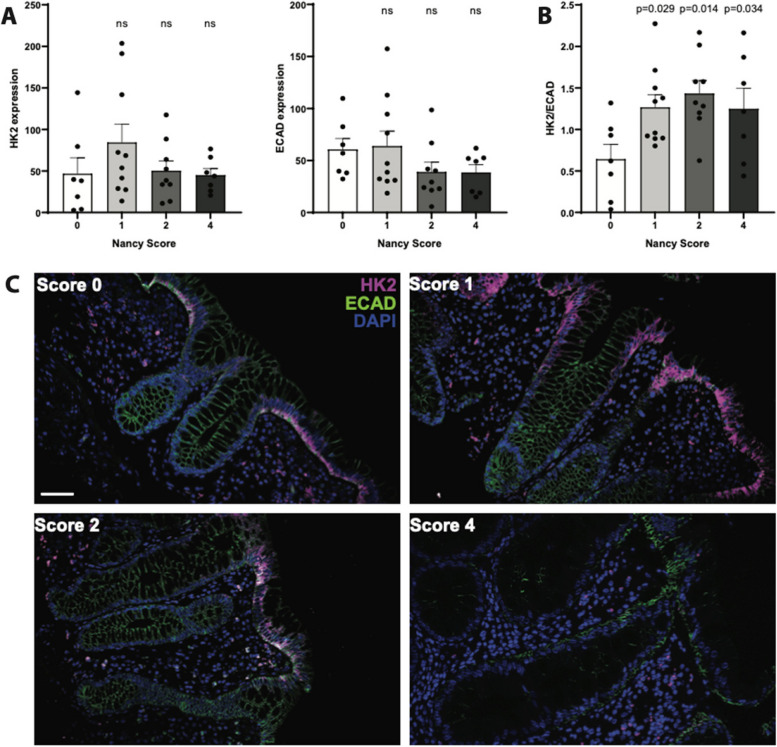
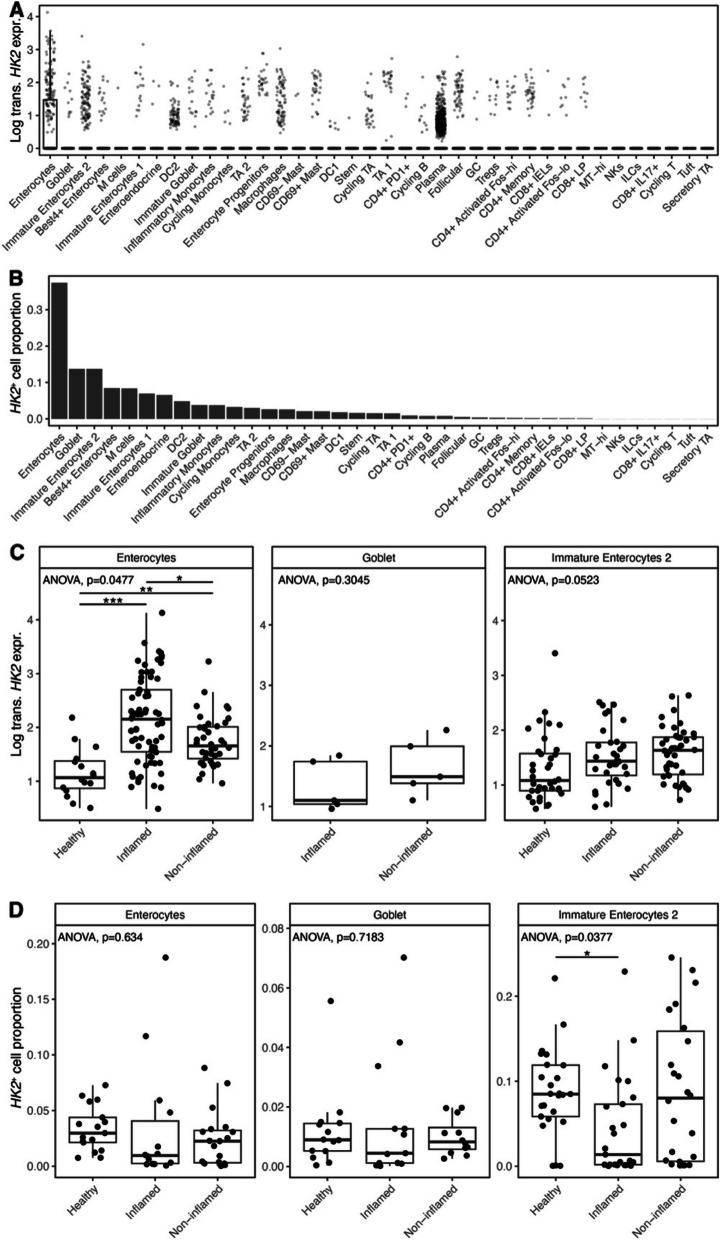
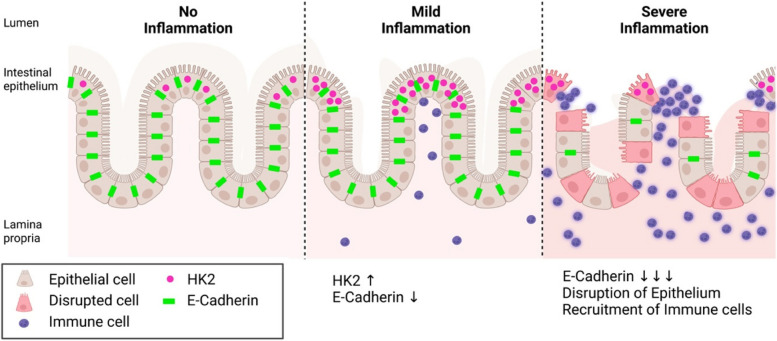
Results: HK2 expression gradually increased from mild to intermediate inflammation, yet strongly declined at high inflammation scores. Expression of epithelial marker genes also declined at high inflammation scores, whereas that of candidate immune marker genes increased, indicating a cellular remodeling of the mucosa during inflammation with an infiltration of HK2-negative immune cells and a loss of terminal differentiated epithelial cells in the apical epithelium-the main site of HK2 expression. Normalizing for the enterocyte loss clearly identified epithelial HK2 expression as gradually increasing with disease activity and remaining elevated at high inflammation scores. HK2 protein expression was mostly restricted to brush border enterocytes, and these cells along with HK2 levels vanished with increasing disease severity.

Conclusions: Our findings clearly define dysregulated epithelial HK2 expression as an indicator of disease activity in intestinal inflammation and suggest targeted HK2-inhibition as a potential therapeutic avenue.

Keywords: HK2; Hexokinase; Human biopsies; Inflammation.


Conflict of interest statement

SS reports indirect stock ownership in Gerion Biotech GmbH as well as consulting and personal fees from AbbVie, Allergosan, Amgen, Arena, BMS, Biogen, Celltrion, Celgene, Falk, Ferring, Fresenius, Galapagos/Gilead, HIKMA, I-Mab, Janssen, Lilly, Morphic, MSD, Mylan, Pfizer, Prometheus, Protagonist, Provention Bio, Sandoz/Hexal, Takeda, and Theravance. PR reports stock ownership in Gerion Biotech GmbH and consulting fees from Takeda. All other authors declare no competing interests.

Figures

Fig. 1
Fig. 1
Epithelial HK2 expression correlates with inflammation severity. AD Expression (TPM, transcript per million) of HK2 (A) and the epithelial marker genes ECAD (B), EPCAM (C), and VIL1 (D) in the sigmoid colon mucosa of patients with various degrees of gut inflammation. Note that at high inflammation scores (> 0.4) expression of HK2 and the epithelial marker genes all decrease indicating epithelial erosion. The inflammation score was calculated as a scaled Harvey-Bradshaw index (Crohn’s disease) or Mayo score (ulcerative colitis) to accommodate both disease types. E HK2 expression increases with inflammation scores after normalization to epithelial marker gene expression. The red lines represent the mean expression trendline with the grey area indicating its 95% confidence interval. The number in the upper left/right corner represents the p value for the correlation between gene expression and inflammation score as determined by linear mixed model
Fig. 2
Fig. 2
Expression of candidate immune marker genes increases with inflammation severity. Expression of selected marker genes, which are characteristic for individual immune cell types, were evaluated in patient sigmoid colon biopsies. Expression of virtually all candidate immune marker genes increase with inflammation severity indicating an expansion of immune cells—a known feature of intestinal inflammation. The red lines represent the mean expression trendline with the grey area indicating its 95% confidence interval. The number in the upper left/right corner represents the p value for the correlation between gene expression and inflammation score as determined by linear mixed model
Fig. 3
Fig. 3
Deconvolution of mucosal transcriptomes demonstrates cellular remodeling during inflammation. A MuSiC cell deconvolution package was used to estimate ratios of the most abundant cell types based on the sigmoid colon mucosal patient transcriptomes. Notably, epithelial cell abundance is decreasing with inflammation, whereas abundances of macrophages and B cells, the two most frequent immune cell types that combine for approximately 35% proportion, are increasing with inflammation severity. Therefore, cell deconvolution supports the candidate gene analyses indicating mucosal cellular remodeling characterized by a reduction of epithelial cells and an expansion of immune cells with increasing inflammation severity. B HK2 expression increases with inflammation scores after normalization to epithelial cell abundance. The red lines represent the mean expression trendline with the grey area indicating its 95% confidence interval. The number in the upper left/right corner represents the p value for the correlation between gene expression and inflammation score as determined by linear mixed model
Fig. 4
Fig. 4
Epithelial HK2 protein expression increases with inflammation severity. Colonic mucosa biopsies of unrelated UC patients were stained for HK2, epithelial cells (ECAD) and nuclei (DAPI). All biopsies were analyzed for classical histological signs of inflammation using the Nancy score (see the “ Methods” section). A Quantification of HK2 and ECAD signal intensity in apical intestinal epithelium. Note that HK2 and ECAD level decrease with higher Nancy Scores. B HK2 protein expression normalized to ECAD levels. Note that after epithelial normalization HK2 expression increases with inflammation severity, i.e., Nancy score. Significance testing was performed using one-way ANOVA compared to score = 0. C Representative images of the multiplex immunofluorescence staining (HK2, ECAD, DAPI). Scale bar indicates 50 μm. n = 7–10 per group. Note that microscopic images were taken from areas with rather intact epithelium for a better visualization of the mucosal structure
Fig. 5
Fig. 5
HK2 is mainly expressed by mature enterocytes and increased during inflammation. HK2 expression was analyzed in published single-cell RNA sequencing data derived from mucosal biopsies of UC patients [18]. A HK2 expression per cell type. Box plot depicting the median and 25th–75th percentile. Whiskers indicate most extreme points within 1.5-times interquartile range deviance from the median and dots represent samples outside of this interval. Note that only enterocytes express significant HK2 levels; thus, only here an interval box is visible. B Abundances of cell types expressing HK2. C HK2 expression in mature and immature enterocytes and goblet cells divided into samples from healthy controls, inflamed and non-inflamed mucosa. D Abundances of cell types expressing HK2 after stratification into disease group. ANOVA p values denote whether significant differences among the three groups exist that were then further analyzed by pairwise Wilcoxon tests (*p < 0.05, **p < 0.01, ***p < 0.001)
Fig. 6
Fig. 6
Model of HK2 expression changes in relation to intestinal inflammation severity. HK2 is predominantly expressed by apical epithelial cells and HK2 expression in these cells increases with disease severity. However, during the course of inflammation, the cellular composition of the mucosa changes. In severely inflamed tissue, the epithelium is disrupted, brush border epithelial cells with high levels of HK2 are shed and lost, whereas immune cells with little to no HK2 expression are recruited. Therefore, overall HK2 expression is reduced in bulk tissue samples under severe inflammation despite local high expression in remaining HK2-positive epithelial cells. Created with BioRender.com

Similar articles

References

    1. Kaplan GG, Windsor JW. The four epidemiological stages in the global evolution of inflammatory bowel disease. Nat Rev Gastroenterol Hepatol. 2021;18:56–66. - PMC - PubMed
    1. Kaplan GG. The global burden of IBD: from 2015 to 2025. Nat Rev Gastroenterol Hepatol. 2015;12:720–7. - PubMed
    1. Rath E, Haller D. Intestinal epithelial cell metabolism at the interface of microbial dysbiosis and tissue injury. Mucosal Immunol. 2022;15:595–604. - PMC - PubMed
    1. Gaber T, Strehl C, Buttgereit F. Metabolic regulation of inflammation. Nat Rev Rheumatol. 2017;13:267–79. - PubMed
    1. Soto-Heredero G, Gómez de las Heras MM, Gabandé-Rodríguez E, Oller J, Mittelbrunn M. Glycolysis – a key player in the inflammatory response. FEBS J. 2020;287:3350–69. - PMC - PubMed

Publication types

LinkOut - more resources